

Abstract
A model describing the role of transversal and longitudinal diffusion of cGMP and Ca2+ in signaling in the rod outer segment of vertebrates is developed. Utilizing a novel notion of surface-volume reaction and the mathematical theories of homogenization and concentrated capacity, the diffusion of cGMP and Ca2+ in the interdiscal spaces is shown to be reducible to a one-parameter family of diffusion processes taking place on a single rod cross section; whereas the diffusion in the outer shell is shown to be reducible to a diffusion on a cylindrical surface. Moreover, the exterior flux of the former serves as a source term for the latter, alleviating the assumption of a well-stirred cytosol. A previous model of visual transduction that assumes a well-stirred rod outer segment cytosol (and thus contains no spatial information) can be recovered from this model by imposing a “bulk” assumption. The model shows that upon activation of a single rhodopsin, cGMP changes are local, and exhibit both a longitudinal and a transversal component. Consequently, membrane current is also highly localized. The spatial spread of the single photon response along the longitudinal axis of the outer segment is predicted to be 3–5 μm, consistent with experimental data. This approach represents a tool to analyze pointwise signaling dynamics without requiring averaging over the entire cell by global Michaelis-Menten kinetics.
INTRODUCTION
Diffusion of the second messengers cGMP (cyclic-guanosine monophosphate) and Ca2+ mediates phototransduction in rod outer segments. This process occurs within the thin layers between the membranous discs (transversal diffusion) and the equally thin outer shell along the plasma membrane (longitudinal diffusion). An open issue is to understand the physical role of the transversal diffusion (Dumke et al., 1994; Lamb et al., 1981; Olson and Pugh, 1993) and of the longitudinal diffusion (Gray-Keller et al., 1999; Lamb et al., 1981; Olson and Pugh, 1993). More importantly, no description exists in the literature of how these two mutually perpendicular diffusions communicate and interact.
First, the physics of the diffusion of the second messengers is in need of a deeper understanding; for example the very same notion of “transversal” and “longitudinal” diffusions are not well defined. Diffusion within the interdiscal spaces is important because these are the only physical spaces through which cGMP can be depleted by phosphodiesterase (PDE) localized on the faces of the discs. Diffusion along the outer shell is equally important because there is a spread of depletion of cGMP to a distance of several discs (Gray-Keller et al., 1999; Matthews, 1986) and because this is the region where the channels and transporters reside and Ca2+ enters.
Second, to our knowledge, no pointwise, predictive model exists for the cascade. Such a pointwise model would have to describe the current of the cGMP-gated channels as a function of position on the lateral boundary of the rod in terms of the number of photons hitting the rod. Because the current and [cGMP] are directly linked, this would require the calculation of [cGMP] as a function of space and time. Thus the biophysical issue of understanding the diffusion process and the issue of creating a pointwise model are intertwined.
Researchers have long recognized the importance of diffusion of the second messenger in the cytosol and its space-time dependence (for a recent discussion see Leskov et al. (2000), and in particular Fig. 6 A). Some have generated a mathematical model for the radial diffusion within a single interdiscal space, neglecting the longitudinal diffusion (Dumke et al., 1994). Others have taken into account only the diffusion along the axis of the rod, neglecting space variables in the interdiscal space (Gray-Keller et al., 1999). Although others have attempted to account for both (Lamb et al., 1981; Olson and Pugh, 1993), they do not provide a description of the mechanism by which interdiscal and outer shell diffusions interact.
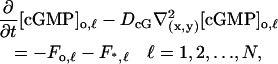
FIGURE 6.

Activation by a point source and the diffusion process (Eq. 24). Activation site (point source) at  and
and  (A) Plots of
  (B) Plots of 1 − Jrel(z, 0, t); spr(0, 0.6 s) = 2.86 μm; spr(0, 1.2 s) = 4.17 μm. (C) Plots of
 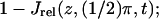 values of
To address the complex nature of the two physical processes, the mathematical theories of homogenization and concentrated capacity are utilized. The homogenization theory was introduced to understand the properties of composite materials with fine periodic structures (Bensoussan et al., 1978; Cioranescu and Saint-Jean-Paulin, 1998; Oleinik et al., 1992). The periodic distribution of discs in the rod outer segment can be regarded as one such composite system. Ideally, the number of discs is thought of as increasing to infinity whereas their mutual distance tends to zero. The theory of concentrated capacity originated from investigating thermal and elastic responses of thin, surface-like materials (Andreucci, 1990; Ciarlet and Lods, 1996; Magenes, 1998; Motyagin et al., 2000). The outer shell is one such thin layer. These two theories, which in the existing literature appear separately, here occur simultaneously and call for novel mathematical approaches (Andreucci et al., 2002, 2003). The combination of these theories in conjunction with basic biophysical principles, such as mass action, Hill's law, and Michaelis-Menten dynamics allows for elucidation of the interaction between transversal and longitudinal diffusion of the second messengers involved in signaling in the rod outer segment. An equation is derived describing directly how these diffusions interact. Without the assumption of a well-stirred cytosol, a description of the spatial spread of excitation is obtained.
BACKGROUND
The phototransduction cascade
The outer segment of a rod photoreceptor in vertebrates is a right cylinder of height H and radius R + σɛo, housing a longitudinal stack of no equispaced parallel cylinders, called discs, each of radius R, and width ɛo, and mutually separated by a distance νɛo (Figs. 1 and 2). Each disc is made up of two functionally independent layers of lipidic membrane where proteins are embedded, such as rhodopsin (Rh), the light receptor, G-protein (G), also called transducin, and cGMP phosphodiesterase (PDE), the effector. These membrane-associated proteins can diffuse on the face of the disc where they are located. The plasma membrane of the rod contains cGMP-gated channels. In absence of light, these channels are open and allow a positive influx of sodium and calcium (Ca2+) ions. The space within the rod, and not occupied by the discs, is filled with fluid cytosol, in which cGMP and Ca2+ diffuse.
FIGURE 1.

Geometrical description of the ROS and its outer shell.
FIGURE 2.

Geometry of the ROS and its discs.
Assume a photon hits a molecule of rhodopsin, located on one of the discs, say for example  (Fig. 2). The rhodopsin becomes activated (denoted by R*), by absorbing a photon of light and in turn activates any G-protein it interacts with. Each of the activated G-proteins, G*, is capable of activating one catalytic subunit of PDE on the disc
  by binding to it upon contact. The bound pair so generated is denoted by PDE*. This cascade takes place only on the disc
  The next cascade, involving cGMP and Ca2+, takes place in the cytosol.
Active PDE* hydrolyzes cGMP in the cytosol, thereby lowering its concentration. The decrease of concentration of the cGMP causes closure of some of the cGMP-gated channels of the plasma membrane, resulting in a lowering of the influx of positive ions, and thus a lowering of the local current across the outer membrane. Because of the Na+/K+/Ca2+ exchanger that continues to remove Ca2+ from the cytosol, there is a decrease in the calcium concentration, which in turn results in an increase in cGMP production by stimulation of Ca2+-inhibited guanylyl cyclase, and thus a consequent reopening of the channels. The same decreased Ca2+ closes the cycle by causing disactivation of rhodopsin through stimulation of rhodopsin kinase. Rhodopsin ceases activating new G-protein. Thus PDE* decays to basal, ending depletion of cGMP.
This cascade is well known and it is supported by a sizable amount of published experimental data (e.g., Wald, 1968; Liebman et al., 1987; Schnapf and Baylor, 1987; Pugh and Lamb, 2000; Burns and Baylor, 2001). Its formal mathematical description, however, is less developed. Here we have used a novel mathematical formulation of the excitation phase, which allows us to take into account the complex geometry of the rod outer segment and the diffusion of both second messengers through it.
The geometry of the rod outer segment
Let ɛ denote a parameter in the range (0, ɛo] and let n be a positive integer larger or equal to no. Denote by  a disc, and of radius R + σɛ, where R, σ, ɛ and H are positive numbers. Let Ωɛ and Ω be the cylinders, of height H and cross sections the disc
  and
and  respectively. The cylinder Ω is included in Ωɛ, is coaxial with it, and it is formally obtained from Ωɛ by setting ɛ = 0. The outer shell Sɛ is the gap between these cylinders. Coordinates
  and
and  are introduced as in Fig. 1.
The cylinder Ω houses a longitudinal stack of n parallel, equispaced cylinders Cj, j = 1, 2, …, n, coaxial with Ω and with cross section a disc  of radius R. They are thin in the sense that their height
The Cj are equally spaced, i.e., the upper face of Cj has distance νɛ from the lower face of Cj+1, where ν is a positive number. The first C1 has distance  from the lower face of the rod Ωɛ and the last Cn has distance
  from the upper face of the rod. The indicated geometry implies that,
 |
Also the volume fraction of the union of the Cj with respect to Ω is
 |
(1) |
The upper and lower faces of the cylinders Cj are denoted by  whereas Lj denotes their lateral surface (Fig. 2). The spaces between two contiguous cylinders Cj and Cj+1 and within Ω are the interdiscal spaces. We label them by Ij, j = 0, 1, 2, …, n by defining Io as the space between the lower face {z = 0} of Ω and the lower face of C1 and In as the space between the upper face {z = H} of Ω and the upper face of Cn. The disc hit by the photon on one of its faces is called the activated disc and is denoted by
  for some 1 ≤ jo ≤ n. For definiteness we assume that the photon hits
  on its lower face
  The interdiscal space
  adjacent to the lower face of
  is called the activated interdiscal space.
This geometrical description is done in terms of the parameter ɛ ranging in the interval (0, ɛo]. The actual physical width of the discs Cj is ɛo and their actual number is no. Thus the geometrical description of the actual physical rod outer segment is obtained from this by taking for ɛ = ɛo and for n = no. Such a description is motivated by the idea of regarding ɛo as a parameter ɛ that will be let go to zero.
THEORY
Diffusion of cGMP and Ca2+ within the cytosol
Ca2+ and cGMP diffuse in the cytosol, within the rod outer segment (ROS). This is the domain obtained from the cylinder  from which the internal discs Cj have been removed. In Fig. 2 it corresponds to the white area that is left in the cylinder
  when the discs are removed. This domain consists of the outer shell
  which is a thin cylindrical layer, and the union of the parallel, transversal thin layers of the interdiscal spaces. We denote it by
  . Because within
  there are no volume sources for either cGMP or Ca2+,
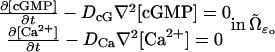 |
(2) |
where t is time, ∇2 is the Laplacian operator in the space variables  and DcG, DCa are the respective free diffusivity constants in the cytosol.
The system (Eq. 2) is complemented with source terms supported on the lateral boundary of the rod and the faces  of the discs Cj. These sources, positive or negative, are due to volume-to-surface first-order reactions. Postponing the discussion of these sources, here we indicate how we intend to interpret the diffusion phenomenon in the cytosol. One might study the system (Eq. 2) in the structured layered geometry of
  by regarding such a domain as macroscopic. However
  consists of layers, transversal or cylindrical, whose thickness is of three orders of magnitude less with respect to the dimensions of the rod outer segment. In situations such as these, the homogenization theory seeks to extract physical information from the system by letting the thickness of the layers go to zero, without altering the total relative volume available for diffusion. In practical terms the parameter ɛo is replaced with a parameter ɛ ∈ (0, ɛo]. Such a parameter ɛ is then let to go to zero. Because ɛ is the thickness of the new fictitious discs, their number n must increase to infinity to keep constant the volume available for diffusion. From Eq. 1 and the geometry of the rod outer segment, the limit is carried out so that,
 |
(3) |
In such a limiting process we impose that although the activated disc  changes its width as ɛ → 0, its lower face, which is the face where the photon hits, remains fixed. Diffusion starts at time t = 0 from a steady state, i.e., with [cGMP](0) and [Ca2+](0) constant in the space variables and given by their dark values [cGMP]dark and [Ca2+]dark.
Boundary source terms for [cGMP]
We will model the activation phase of an idealized experiment by which a single photon hits a disc  on the lower face, at coordinate zo along the axis of the rod.
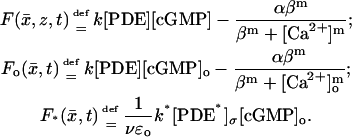
Production or depletion of molecules of cGMP occurs through binding phenomena on the lower and upper faces  of each of the cylinders Cj. Precisely, cGMP is depleted as it binds to dark-activated phosphodiesterase, at a rate,
 |
Here [PDE]σ is defined as the surface concentration of PDE, uniformly distributed on the total area of the faces of the discs Cj. Precisely denoting by no the number of discs and by NAV Avogadro's number,
 |
 |
 |
 |
where [PDE] is the volumic concentration of PDE regarded as uniformly distributed in the rod. This is the quantity actually being experimentally measured under the assumption of well stirred. Thus,
 |
(4) |
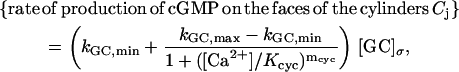
Guanylyl cyclase (GC), which is bound to the faces of the discs Cj, synthesizes cGMP. Molecules of guanosine triphosphate bind guanylyl cyclase to generate cGMP. Such activity is modulated by Ca2+, which is bound to guanylyl cyclase-activating protein (GCAP). As the concentration of Ca2+ decreases, GCAP is released and is free to bind to guanylyl cyclase and to activate it. Diffusion of GCAP is assumed to be negligible, so that molecules of GCAP are essentially still within  . Thus only those near the faces of the cylinders Cj and in contact with the GC affect the process. The rate of conversion of guanosine triphosphate into cGMP in terms of [Ca2+] is given by an experimental Hill-type relation,
 |
where m is a positive parameter, kGC is the catalytic rate of guanylyl cyclase, [GC]σ is the surface density of GC, uniformly distributed on the total area of the faces of the discs Cj, and β is the Ca2+ concentration that achieves half of the maximum rate. Proceeding as before [GC]σ = νɛo[GC]/2, where [GC] is the measured volumic concentration of GC regarded as uniformly distributed in the rod. Setting α = kGC[GC], such a rate of production takes the form,
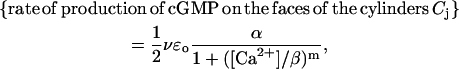 |
(5) |
where  is the maximum rate of production of cGMP, corresponding to absence of Ca2+. Let
  be the disc hit by the photon on one of its faces, say for example the lower one, and let
  be the resulting, pointwise surface density of activated phosphodiesterase. Then assuming full activation of PDE,
 |
(6) |
where k* is the catalytic rate of the light-activated PDE.
Combining these various contributions (Eqs. 4–6), the physical flux of [cGMP] on the faces  of the discs Cj, takes the form
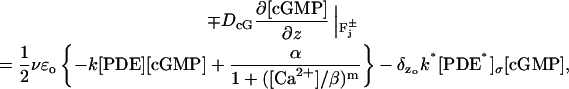 |
(7) |
where
 |
[cGMP] does not penetrate the lateral part Lj of the boundary of the cylinders Cj, and does not outflow the boundary  of the rod. Therefore [cGMP] has zero physical flux on each of the Lj, on the lateral boundary and on the top (z = H) and bottom (z = 0) of the rod outer segment.
Boundary source terms for [Ca2+]
Calcium does not penetrate the discs Cj carrying the rhodopsin, so that its flux across the boundary of each Cj is zero. Calcium does not outflow the bottom (z = 0) and the top (z = H) of the outer segment.
Calcium ions are lost through the lateral boundary of the rod, by electrogenic exchange and are gained by their influx, through the cGMP-activated channels.
The pointwise current density Jex across the boundary of the rod (charge flux), due to electrogenic exchange, is modeled by the Michaelis-Menten type relation,
 |
(8) |
Here  is the surface area of the lateral boundary of the rod, jex;sat is the maximal, or saturation current as [Ca2+] → ∞, and Kex is the half-maximal constant. The pointwise current density JcG carried by the cGMP-activated channels, across the boundary of the rod, is given by the Hill's type law,
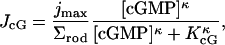 |
(9) |
where jmax is the maximal current as [cGMP] → ∞, KcGMP is the half-maximal constant and κ is a positive parameter. Let n denote the unit normal to the lateral boundary of the rod, pointing outside the rod. Then, the total pointwise flux of Ca2+ across such a surface is given by,
 |
(10) |
where η is a positive parameter, and fCa is a dimensionless number in (0, 1) (see Table 1 footnote). In this formula the product fCaJcG is the portion of the flux of current JcG carried by Ca2+. The fluxes in Eqs. 4–10 contain no recovery mechanisms; accordingly the model is currently valid for the activation phase only.
TABLE 1.
Parameters for the salamander
| Symbol | Units | Published ranges | Simulation |
|---|---|---|---|
| αmax | μM s−1 | 40–50 | 50 |
| αmin | μM s−1 | 1 | 1 |
| BCa | – | ∼44 | 45 |
| BcG | – | 2 | 2 |
| [cGMP]dark | μM | 2–4 | 2.81 |
| [Ca2+]dark | μM | 0.4–0.7 | 0.55 |
| D* | μm2 s−1 | – | 5 |
| DCa | μm2 s−1 | 15 | 15 |
| DcG | μm2 s−1 | 50–196 | 150 |
| ɛo | μm | 0.01–0.014 | 0.014 |
| η | mol 𝒞−1 | – | 23·10−8 |
| fCa | – | 0.1–0.2 | 0.17 |
| H | μm | 20–28 | 22.4 |
| jex;sat | pA | 17–20 | 17 |
| jmax | pA | 70–7000 | 7000 |
| k | μM−1 s−1 | – | 0.042 |
| k* | μM−1 s−1 | – | 110 |
| kcat/KM | μM−1 s−1 | 440 | 440 |
| kE | s−1 | 0.625 | 0.625 |
| kR | s−1 | 2.91 | 2.91 |
| Kcyc | μM | 0.10–0.23 | 0.135 |
| KcG | μM | 13–32 | 32 |
| Kex | μM | 1.5, 1.6 | 1.5 |
| κ | – | 2 | 2 |
| mcyc | – | 2–3 | 2 |
| ν | – | – | 1 |
| νRE | s−1 | 220 | 275 |
 |
μM | 23.8 | 23.8 |
| R | μm | 5.5 | 5.5 |
| σ | – | – | 1.071 |
The geometrical parameters R, H, ɛo, σ, ν are taken from Pugh and Lamb (1993). The parameters αmin, αmax, Kcyc, mcyc, appearing in Eq. 21 as the cyclase mediated rate of production of cGMP, are in Nikonov et al. (2000) and in Lamb and Pugh (1993). The value of mcyc is also in Koutalos and Yau (1996). The dark values [cGMP]dark and [Ca2+]dark are taken from Nikonov et al. (2000) and Pugh and Lamb (2000). These references have also provided ranges for the values of the parameters jex;sat, jmax, Kex, KcG, κ, fCa, η, a, entering in the current densities Jex and JcG defined in Eqs. 8 and 9 and in the flux (Eq. 10). The constant η has the form η = (BCaℱ)−1, where ℱ = 96,500 𝒞mol−1 is the Faraday constant and BCa is a dimensionless number that takes into account calcium buffering effects within the cytosol. In Nikonov et al. (2000), the parameter KcG is given to be itself a function of [Ca2+], with range 13–32 μM as [Ca2+] ranges over [0, ∞). The calcium diffusivity DCa is taken from Nakatani et al. (2002), whereas the range of values of the cGMP diffusivity DcG is in Koutalos et al. (1995) and Olson and Pugh (1993). In the discussion we will motivate the choice of D*. The parameters kE, kR, νRE appear in Eqs. 23a and 23b as a mechanism of activation of a single disc by a lumped model and are in Nikonov et al. 2000. The catalytic constant k* is of the form (kcat/2 KMBcG) as in Nikonov et al. (2000) (see formula A8). The values of the catalytic constants k and k* (no background light is assumed) are in Nikonov et al. (2000), Stryer (1991), and Gray-Keller et al. (1999). The last two references contain also the value of [PDE] assumed as constant.
Homogenizing and concentrating
Our goal is to understand what the pointwise problem introduced in Eqs. 2–10 looks like for small ɛo, and what kind of information one might derive out of this limit. Roughly speaking one rewrites the pointwise problem in Eqs. 2–10 with ɛo replaced by ɛ and then lets ɛ → 0. This is the role of the homogenization theory (Ciarlet and Lods, 1996; Oleinik et al. 1992; Bensoussan et al., 1978; Cioranescu and Saint-Jean-Paulin, 1998). We denote by [cGMP]ɛ and [Ca2+]ɛ the labeled solutions of the diffusion problems (Eqs. 2–10), for 0 < ɛ ≤ ɛo. We call these the ɛ-approximating problems.
The diffusivity and capacity coefficients in Eq. 2, in the outer shell and in the activated interdiscal space  are, roughly speaking, multiplied by ɛo/ɛ to compensate for a shrinkage of the domain of the same order. This is the role of concentrated capacity (Andreucci, 1990; Ciarlet and Lods, 1996; Magenes, 1998). The precise mathematical implementation of this idea is in Andreucci et al. (2002, 2003) (see also Supplementary Material, Appendix A, § A2 and § A3).
Here we discuss what the limiting [cGMP] and [Ca2+] look like and the equations they satisfy.
As ɛ → 0 the layered domain  tends formally to the cylinder Ω and the activated interdiscal spaces tend to the disc
  Likewise the outer shell Sɛ tends to the surface
  The functions [cGMP]ɛ(x, t) and [Ca2+]ɛ(x, t) generate three pairs of limiting functions, each representing [cGMP] and [Ca2+] in different parts of the rod outer segment. Precisely:
 |
The interior limits [cGMP] and [Ca2+] are defined on a volumic domain and their physical dimensions remain unchanged. Although the last two limits are defined on surfaces, they keep their physical dimensions in μM. To make this point precise, consider for example the limit [cGMP]s in the limiting outer shell S. Describe the approximating outer shell Sɛ in terms of cylindrical coordinates,
 |
and express [cGMP]ɛ in terms of these coordinates. It can be shown that [cGMP]s is a function of (θ, z, t) defined as the limit, as ɛ → 0, of the radial integral average of [cGMP]ɛ in the approximating outer shell Sɛ, i.e., (see Supplementary Material, Appendix A, § A3),
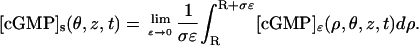 |
This formula implies that [cGMP]s, although defined on the surface (0, 2π] × (0, H), keeps its physical dimensions in μM, because it is the limit of integral averages of volume densities. The factor 1/ɛ in this limiting formula, arises form the rescaling of the capacity and diffusivity coefficients in the outer shell, as part of the process of concentrated capacity. Similar considerations apply to  (see Supplementary Material, Appendix A § A3).
We next give the equations satisfied by these limiting quantities, each in its own geometric portion of the rod outer segment. More importantly we elucidate how these seemingly separate diffusion processes interact with each other. To gain in simplicity we do this for the equations satisfied by the limiting [cGMP]. The analogs for [Ca2+] are in Supplementary Material, Appendix A, § A3, where justifications and proofs are provided.
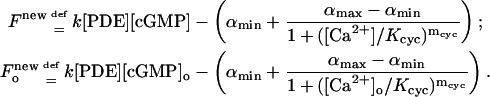
The limiting equations will contain in various forms the forcing terms generated by Eq. 7. To simplify the symbolism we will set,
 |
(11) |
In these expressions [cGMP] and [Ca2+] are the interior limits of [cGMP]ɛ and [Ca2+]ɛ and [cGMP]o and [Ca2+]o are the limits at the activated level zo.
Form of the interior limit of [cGMP]
The interior homogenized limit is computed by a local average in each of the interdiscal spaces Ij. Such an average takes into account the boundary conditions in Eq. 7. The net result is that the interior limiting [cGMP] satisfies the equation,
 |
(12) |
Here  is the Laplace diffusion operator acting only on the transversal variables
  i.e., formally,
 |
Because  is a function of the transversal variables
  and the longitudinal variable z, these can be regarded as diffusion processes, parameterized with z ∈ (0, H), taking place on the disc
  Thus the volumic diffusion in Eq. 2 in the layered structure of the rod, is transformed into a family of two-dimensional diffusions. Also, the homogenized limit transforms the boundary fluxes in Eq. 7 into volumic source terms holding in Ω.
Form of the limiting [cGMP]o at the special level zo
The limiting [cGMP]o on the activated level zo is also computed by averaging Eq. 2 over the interdiscal space adjacent to the activated disc  and by letting its thickness go to zero. The limiting [cGMP]o satisfies the equation (Andreucci et al., 2003; also see Supplementary Material, Appendix A, § A3),
 |
(13) |
on the activated limiting disc 𝒟R × {zo}. Thus, also at the activated level zo, the volumic diffusion in Eq. 2 is transformed into a two-dimensional diffusion on the layer 𝒟R × {zo} and the fluxes in Eq. 7 are transformed into sources defined in the interior of the same disc and keeping the same form. Note that in this case the limit equation contains also the term F* due to activated PDE.
Form of the limiting [cGMP]s in the outer shell
The limiting [cGMP]s(θ, z, t) on S is a function of the angular variable θ ∈ [0, 2π), of the longitudinal variable z ∈ (0, H) and of time. Outside the activated level zo it must equal the interior limit  when this is computed on S. For consistency, on the activated level zo it must equal the limiting [cGMP]o when this is computed on S. Therefore,
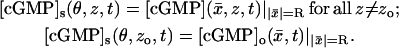 |
(14) |
Moreover, the interior limit [cGMP] and the limit [cGMP]o on the activated level zo are linked to the limit [cGMP]s in a more essential way. Describe the limiting cylinder Ω in cylindrical coordinates (ρ, θ, z). Then the fluxes of [cGMP] and [cGMP]o on S are given by
 |
Denote by  the Laplace-Beltrami diffusion operator on S, i.e., formally
 |
Then these fluxes and the limiting [cGMP]s(θ, z, t) on the outer shell, satisfy the surface-diffusion equation,
 |
(15) |
in S. Here δzo is the Dirac delta function on S with mass on the level zo. Thus, the diffusion of [cGMP]s on the limiting outer shell S, is forced by the exterior fluxes on S, of the interior limit [cGMP] and the limit [cGMP]o on the activated zo.
This is the biophysical law by which the homogenized-concentrated limiting diffusions interact with each other. Although it is somewhat intuitive that [cGMP] coming from the transversal interstices should provide the driving force for the movement of the [cGMP] on the longitudinal surface S, Eqs. 14 and 15 provide a precise law by which this occurs. In particular they contain a precise combination of the original geometric parameters θo, ɛo, σ, ν. This combination of geometric parameters expresses the balance of mass between [cGMP]s on S and the outflow through S of the interior [cGMP]. Multiplying Eq. 15 by σɛo, the left-hand side represents the pointwise space-time variation of σɛo[cGMP]s. The latter quantity can be regarded as a surface density of cGMP concentrated on S, starting from the original shell Sɛo of thickness σɛo. The factor (1 − θo) on the right-hand side signifies that only a fraction of (1 − θo) of S is exposed to the outflow of the homogenized interior limit of [cGMP]. This is the same fraction of surface exposed to inflow/outflow of cGMP from the interdiscal spaces into the outer shell Sɛo in the original, nonhomogenized configuration of the rod outer segment.
An integral version of Eqs. 11–15
The form of Eqs. 14 and 15 precisely describes the interaction between the “interior” and the “boundary” diffusion of the second messengers cGMP and Ca2+. However, from a mathematical point of view, Eqs. 11–15 must be interpreted in a suitable weak sense (Andreucci et al., 2003 and Suppplementary Material, Appendix A, § A4). Here we give an integrated form of Eqs. 11–15, which is a particular case of such a weak formulation.
Far from being an artificial construct, such a rigorous mathematical interpretation has dense physical consequences that will be brought to light in the next section. Its main feature is that it combines the geometrical properties of the various compartments. This permits one to specialize it under various simplifying assumptions such as transverse or global well-stirred cytosol.
One of the outcomes of such an integral form is that Eqs. 11–15 contain, as a particular case, the known well-stirred theories (either in the transversal variables (x, y) or in all space variables). In addition, even in the well-stirred assumption, they represent a significant improvement with respect to the existing theories in that they distinguish the diffusion of the second messengers outside the activation site zo from the diffusion on the activated level zo. This is the content of the next mathematical derivations from Eqs. 11–15.
Integrate Eq. 12 over the disc 𝒟R × {z} at the generic level z. Applying the Gauss-Green theorem,
 |
where dℓ is the line measure on the circle  An entirely similar operation on Eq. 13 yields,
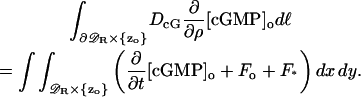 |
Next integrate Eq. 15 on ∂𝒟R × {z} for a generic level z ∈ (0, H), to obtain
 |
In performing such an integration we have taken into account that the angular part of the Laplace-Beltrami operator does not give any contribution because [cGMP](θ, z, t) is a periodic function of θ. The last two integrals are substituted from the previous two formulae, thereby eliminating the explicit calculation of the flux of [cGMP] across S. Regrouping the resulting terms we arrive at
 |
(16) |
This is a particular case of the notion of “weak formulation” for the problem (Eqs. 11–15). A more general weak formulation is in Andreucci et al. (2002, 2003) (see also Supplementary Material, Appendix A, § A4).
Cytosol well stirred in the transversal variables (x, y)
Assume the cytosol is well stirred in the transversal variables (x, y). Thus, the rod outer segment is ideally lumped on its axis and transversal diffusion effects are immaterial. Such an assumption is suggested by the idea that the system diffuses with infinite speed on each transversal cross section and thereby responds with an instantaneous transversal equilibration. Although not rigorous on physical and mathematical grounds, such an assumption here is made in the sense that errors originating from it are neglected.
The analysis below will permit one to compare our model to the existing ones based on the assumption of well stirred.
If [cGMP] and [Ca2+] are regarded as lumped on the axis of the rod, they depend only on z and t, and are independent of (x, y). Because there is no dependence on the (x, y) variables, by Eq. 14
 |
We insert this information into the formula (Eq. 16) and compute the resulting integrals, to obtain,
 |
Set,
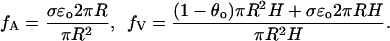 |
These two parameters have a geometric and physical significance. Specifically, up to higher-order corrections, fA is the fraction of the cross-sectional area of the outer segment that is available for longitudinal diffusion, and fV is the fraction of the total outer segment volume occupied by the cytosol (Lamb et al., 1981; Olson and Pugh, 1993). Then, dividing by fV the previous equation takes the more concise form,
 |
(17) |
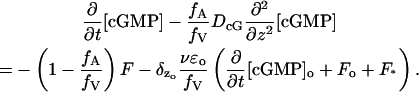
This is the law of diffusion of [cGMP] under the assumption that the cytosol is well stirred in the transversal variables. A key feature is that it distinguishes between diffusion outside the activated level zo and diffusion at zo by the action of the Dirac delta function  If z is different than the activated level zo, Eq. 17 implies,
 |
(18) |
Equation 18 is formally similar to a model proposed by Gray-Keller et al. (1999). In that work, however, the term F* due to activation is distributed along the longitudinal variable z. To elucidate the effect of the activation site zo, one has to compute Eq. 17 for z = zo. In view of the Dirac delta function  computation of Eq. 17 for z = zo can be done only in the sense of distributions (DiBenedetto, 2002, Chap. VII). For example, we might integrate in dz over a small interval (zo − a, zo + a) about zo, where
  Letting a → 0, we obtain a relation expressing the conservation of mass of [cGMP] across the activated level zo.
Globally well-stirred cytosol
Regard now the rod as a homogeneous bag of cytosol, and [cGMP], [Ca2+], [PDE], [PDE*], as lumped quantities depending only on time. Thus, in particular [cGMP] = [cGMP]o = [cGMP]s and similarly for [Ca2+]. Rewrite Eq. 17 in the integrated form,
 |
(17)′ |
Then we may set to zero the term involving the z-derivative and compute the remaining integrals to get,
 |
Now fV is of the order of one and ɛo is of three orders of magnitude smaller than H and R. Therefore,
 |
From the expression of fV and the form (Eq. 11) of F*,
 |
where Vcyto is the volume of the outer rod segment available for diffusion. Therefore, the assumption of well stirred in all the space variables yields, up to higher-order corrections, the dynamic equation,
 |
(19) |
where F is defined in the first of Eq. 11. A similar analysis for calcium gives,
 |
(20) |
where the various parameters are the ones occurring in the flux condition (Eqs. 8–10) and discussed there. These formulae coincide with Nikonov et al. (2000) (A3 and A4; p. 39), upon identifying the various parameters. This is a validating point of our model as it fits the experimental data at least as well as Nikonov's model does.
Flexibility of the model
In Eqs. 12–19 and throughout the development of the theory, the functions F, Fo, F* are those defined in Eq. 11. Although this has been done for notational simplicity, nowhere in the arguments does the specific form in Eq. 11 enter, in the calculation of the homogenized-concentrated limit (Eqs. 12–19). Thus, such a limit is independent of the form (Eq. 11) of F, Fo, F*, provided these are bounded smooth functions of [cGMP] and [Ca2+].
These functions originated from modeling the production and depletion mechanisms of [cGMP] on the faces  of the discs. Variants or refinements of these mechanisms might be incorporated into these functions and would produce the very same homogenized-concentrated limit (Eqs. 12–19) with the newly redefined forms of F, Fo, F*. This affords considerable flexibility to the model.
As an example, consider the rate of production of [cGMP] due to membrane-bound guanylyl cyclase GC, leading to Eq. 5. The mechanism we have adopted is that proposed by Forti et al. (1989) and Gray-Keller et al. (1999). A refinement of such a mechanism is in Nikonov et al. (2000), although in a volumic well-stirred form. When interpreted as a boundary flux it reads,
 |
where mcyc is a Hill's exponent, Kcyc is a positive parameter, and [GC]σ is the surface density of GC, regarded as uniformly distributed on the total area of the faces of the discs Cj. Because GC is inhibited by Ca2+ its maximum catalytic rate kGC,max occurs for [Ca2+] → 0 and its minimum catalytic rate kGC,max occurs theoretically as [Ca2+] → ∞. Surface bound GC is converted into volumic [GC], by the same surface-volume mechanism leading to Eq. 5. Setting,
 |
the cyclase mediated rate of production of cGMP takes the form,
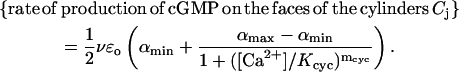 |
This contributes to the total flux of [cGMP] in the faces  of the discs. The factor
  accounts for the surface-volume interpretation. A similar form of the rate of production of cGMP due to cyclase is in Nikonov et al. (2000), where, however, such a term is volumic and offers no spatial resolution. In that work, the value of αmax is reported as 50 μM s−1 whereas (αmin/αmax) = 0.02. Thus αmin is about two orders of magnitude smaller than αmax. If αmin is neglected by setting it to be zero, the previous rate of production reduces to Eq. 5 with αmax = α and Kcyc = β. Starting with this new rate of production, the function F and Fo in Eq. 11 are modified into
 |
(21) |
These reduce to Eq. 11 if αmin = 0. The function F* in Eq. 11 remains unchanged.
Multiple photon activation
To gain in simplicity, the theory has been developed to model a single-photon response. Multiple-photon responses are easily treated as follows. Assume  discs are activated at the levels zo,1, zo,2, …, zo,N. The very same theory applies and the resulting equations remain the same in nature with the following variants. The function
  remains defined as in Eq. 11. Each of the activated discs now generates its own forcing terms Fo,ℓ and F*,ℓ defined as in Eq. 11 each at the level zo,ℓ. Precisely,
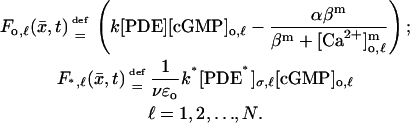 |
In these expressions [cGMP]o,ℓ and [Ca2+]o,ℓ are the limits of the approximating [cGMP]ɛ and [Ca2+]ɛ on the activated level zo,ℓ. Also [PDE*]σ,ℓ is the surface density (in μmol/μm2) of [PDE*] on the disc 𝒟R × {zo,ℓ}.
Equation 12 remains unaltered. Equation 13 is replaced by N equations of exactly the same form as Eq. 13, each representing the limiting [cGMP] on its own activated disc. Precisely,
 |
(13)′ |
each on its own activated limiting disc 𝒟R × {zo,ℓ}. All the terms of Eq. 15 remain the same except the last, which now has to account for the presence of N activated “levels” and takes the form,
 |
 |
 |
(15)′ |
in S. Here δzo,ℓ are the Dirac delta functions on S with masses on the levels zo,ℓ.
If several photoisomerizations occur on the same disc at level zo,ℓ this is accounted for in the form of the function F*,ℓ defined in Eq. 11′ for its own level zo,ℓ.
If the rate of generation of [cGMP] due to cyclase is modeled by Eq. 21, and several isomerizations occur on more than one disc, then Eq. 11′ is modified accordingly. Thus, the model encompasses a large spectrum of experimental settings.
NUMERICAL SIMULATIONS
The strength of the homogenized model (Eqs. 11–15) is in its spatio-temporal resolution. The numerical simulations presented below build on this feature. The main results are a suppression of total dark current, in close agreement with the experimental data (0.5–1.5%; F. Rieke, unpublished) and the phenomenon of local spread of excitation along the axis of the rod outer segment (Baylor et al., 1979 a,b; Lamb et al., 1981; Gray-Keller et al., 1999; Matthews, 1986). Let JcG and Jex be defined as in Eqs. 8 and 9 and set
 |
(22a) |
As z ranges over (0, H) and θ ranges over [0, 2π), the variables (z, θ) range over the lateral surface S of the rod outer segment. When computed at t = 0 both [cGMP] and [Ca2+] are constant and corresponding to their dark values. Consequently Jdark is also a constant. The plots below show relative currents and their deviation from the dark state, i.e.,
 |
(22b) |
where dS is the surface measure on S. A set of simulation parameters for the salamander have been collected from a large cross section of the literature and numerically tested for consistency in Khanal et al. (2003) and are reproduced in the Table 1 parameters.
Numerical simulations take also into account the equations for Ca2+ (in their weak form, Andreucci et al., 2002, 2003; see also Supplementary Material, Appendix A, § A4 Although simulations could be done for a number of modeling combinations, as indicated previously, we assume at this point that a single rhodopsin is activated on a disc at level zo. In Eqs. 11–15, we take the forcing terms F and Fo as the Fnew and  defined in Eq. 21. This way all the terms in Eqs. 11–15 are well identified except the form of the function [PDE*]σ on the activated level zo, which enters in the forcing term F* of Eq. 11. In the simulations, such a function has been taken two different ways. We call the first “diffused activation” and the second “pointwise activation” (see below).
Diffused activation on a single disc by a lumped/bulk model
The function [PDE*]σ depends only on time, and if activation occurs on a single disc, [PDE*]σ = E*/NAVπR2, where E* is the number of activated effectors. Initially E*(0) = 0. Consider the case when a single rhodopsin is activated, and remains active along the numerical simulation. Then following Nikonov et al. (2000), (see formula (A2) in this reference), activation of the effector starts and continues (at least for the activation phase) by the differential equation,
 |
(23a) |
whose solution is
 |
(23b) |
Here νRE is the rate of activation of the effector for a single rhodopsin and kE is the rate of inactivation of E*. The values of these parameters are reported in the previous table. Such an activation mechanism as proposed in Nikonov et al. (2000), assumes a well-stirred environment. We are assuming that PDE* is uniformly distributed on the activated disc at level zo. However, only the input [PDE*]σ, on the activated disc 𝒟R × {zo}, is taken to be well stirred in the transversal variable of the disc. Starting from this input, the evolution process involves all the spatio-temporal variables and delivers pointwise information on [cGMP], [Ca2+] and the resulting current. Starting from t = 0 the number E* of effectors grows as in Eq. 23b but remain confined on a fixed disc, which, in the simulation, is taken at the middle level of the rod outer segment. Depletion of [cGMP] occurs on the rod as a function of position and time. Current is generated on the boundary of the rod as a function of position and time. Because the process is radially symmetric the current depends only on the variable z along the longitudinal axis of the rod. All simulations are run for 1.2 s with a time-step integration of 10 ms.
As a way of comparing the space-resolved, homogenized model with existing well-stirred ones, we have also generated numerical simulations for: a), the lumped/bulk model as arising in Eqs. 19 and 20; b), the model well stirred in the transversal variables (x, y) as appearing in Eq. 17 with the companion equation for calcium. Activation occurs at the level zo.
In all cases, the PDE activation mechanism is the one described in Eq. 23b. A result of the numerical simulations is that current suppression is less the more space resolved the model is (Fig. 3). This is due to the damping effect of the diffusion mechanism. In a well-stirred model all the molecules of cGMP in the rod are regarded as contributing instantaneously to the closing of the channels, thereby generating a larger current suppression.
FIGURE 3.

Activation by a single R* with [PDE*] given by the lumped/bulk model (Eqs. 23a and 23b). History of the relative integrated current Jint. After 800 ms, dark current suppression is ∼1.54% for a well-stirred ROS, ∼1.34% for ROS well stirred in the transversal variables, and ∼0.94% for a fully space-resolved model. Thus, the more space resolved is the model, the less is the current suppression. The three lowest curves represent current suppression for the homogenized model activated by a punctual source as in Eq. 24. The three activation sites are in Fig. 4. Current suppression is dramatically dependent on the activation site.
Fig. 5 plots the single-photon current suppression for the activation mechanism (Eq. 23). Panel A shows the response for a ROS well stirred in the transversal variables, whereas panel B refers to a fully space-time resolved ROS with the homogenized model. In either case there is radial symmetry and Jrel(z, t) depends only upon the longitudinal variable z. The response (1 − Jrel(z, t)) are plotted as functions of z, along the longitudinal axis of the rod, at t = 0.2, 0.4, 0.6, 0.8, 1.2 s.
FIGURE 5.

Plots of 1 − Jrel(z, t) at times 0.2, 0.4, 0.6, 0.8, 1.2 s. (A, B) Activation by Eqs. 23a and 23b. (A) Model with ROS well stirred in the transversal variables; spr(0.6 s) = 3.28 μm; spr(1.2 s) = 4.78 μm. (B) Homogenized model with disc 𝒟R × {zo} activated; spr(0.6 s) = 3.21 μm; spr(1.2 s) = 4.58 μm. (C) Activation by the diffusion process (Eq. 24). Homogenized model with activation site at the center of the disc 𝒟R × {zo}; spr(0.6 s) = 2.66 μm; spr(1.2 s) = 4.01 μm. Common to these panels is that they exhibit radially symmetric solutions and therefore there is no dependence on the angular variable θ. Both dark current suppression and spread decrease for higher space resolution of the model.
Activation by a two-dimensional diffusion process originating from a point source
The model is capable of delivering spatio-temporal information originating from a nonconstant distribution of [PDE*]σ on the activated disc 𝒟R × {zo}. To underscore this point, we have assumed that:
E* is zero at time t = 0 when activation starts.
Activation of the effector E starts at time t = 0 by a single R* and it continues for all the duration of the simulation.
The activating rhodopsin is localized at a fixed point (xo, yo) on the disc 𝒟R × {zo}. Therefore its action is that of a Dirac point-mass

The resulting molecules of E* diffuse on the disc 𝒟R × {zo} and are depleted by a decay term of the type kEE*. Such a depletion term has been inserted to keep the model consistent with Eq. 23a above.
Thus, the surface density of molecules P* = [PDE*]σNAV is a solution of,
 |
(24) |
Integrating this over 𝒟R × {zo} gives precisely Eq. 23a for the variable
 |
In this sense Eq. 24 can be regarded as a space-resolved version of Eq. 23a. By varying the position of (xo, yo) on 𝒟R × {zo} one can trace numerically the spatio-temporal dependence of the response.
Simulations have been run for three different activation sites (locations where the photon hits). The first is at the center of the disc; the second is half-way between the center and the rim (in polar coordinates (ρ, θ) such a site is  and
and  see Fig. 4); the third is exactly at the rim of the disc (ρ = R and
  ). In either case the current, as a function of the longitudinal variable z and time t, has been recorded at three angular locations on the boundary of the rod. As indicated in Fig. 4 at
  (the farthest point on the disc, from the activation site),
  (the closest point on the surface of the rod to the activation site), and θ = 0 (at some intermediate distance from activation).
FIGURE 4.

Transversal cross section of the rod outer segment at the level zo of the disc where activation occurs. Activations are simulated at 0, at  and
and  and on the boundary of the rod at R and
Fig. 5 C reports current suppression for the fully space-time resolved ROS with homogenized model, with activation mechanism given by Eq. 24. The activating point source is placed at the center of the disc 𝒟R × {zo} so that the response is radial. Relative current suppression (1 − Jrel(z, t)) is plotted along the axis of the rod for the times t = 0.2, 0.4, 0.6, 0.8, 1.2 s.
In Figs. 6 and 7, the activation mechanism is that of Eq. 24, for the fully space-time resolved ROS with homogenized model. In Fig. 6 the activating point source is placed half-way between the center and the rim of the disc 𝒟R × {zo}. In each of the panels the relative current suppression (1 − Jrel(z, θ, t)) is plotted, as a function of z at three different sites on the lateral boundary of the ROS. Precisely at θ = π/2 in panel A; at θ = 0 in panel B and at θ = − π/2 in panel C. In each of the panels, the responses are plotted at the same times. In Fig. 7 the activating point source is placed exactly at the rim of the disc 𝒟R × {zo}. In each of the panels the relative current suppression (1 − Jrel(z, θ, t)) is plotted, as a function of z at the same three different sites on the lateral boundary of the ROS and in the previous figure and at the same times.
FIGURE 7.

Activation by a point source and the diffusion process (Eq. 24). Activation site (point source) at R and  (A) Plots of
  (B) Plots of 1 − Jrel(z, 0, t); spr(0, 0.6 s) = 3.10 μm; spr(0, 1.2 s) = 4.37 μm. (C) Plots of
Comparing Figs. 5–7 shows the influence of the activation site on the dynamics of the system response. For example, when activation occurs at ρ = R, the relative variation in total current is largest and fastest near the activation site as indicated in Fig. 7. Local responses depend dramatically on the activation sites when recorded near it (Figs. 6 C and 7 C) and less dramatically if recorded far away from the activation sites (Figs. 6 C and 7 C).
On the spread of activation
Current suppression depends on the recording site (z, θ) along the lateral boundary of the ROS. Let zo be the level of the activated disc. At each fixed time t and angle θ ∈ (0, 2π], current suppression is highest at zo, decreases symmetrically, away from zo and it becomes “negligible” sufficiently away from zo. That interval about zo, along the longitudinal axis of the ROS, where the current suppression is “not negligible” defines, roughly speaking, the interval of spread of the response in the activation phase. We have attempted to quantify the notion of “spread” by setting,
 |
(25) |
where Jdark and Jtot are defined in Eqs. 22a and 22b. Thus, for fixed θ and t, the spread of excitation is the width of the largest interval, about zo, along the longitudinal direction of the rod, where the response is not <1% of the peak response. A further discussion on the notion of spread is in Supplementary Material, Appendix B, § B1.
A pictorial notion of spread is in Figs. 5–7. In Fig. 5 the spread depends only on z as all three panels reflect radially symmetric solutions. In Figs. 6 and 7 the spread depends on the recording sites through the angle θ.
The spread corresponding to the model with ROS well stirred in the transversal variables (Fig. 5 A) is larger than the one corresponding to the homogenized model (Fig. 5 B), for the same activation (Eq. 23). For larger times the spread tends to become uniform irrespective of the models and activation. This seems to suggest that the diffusion equations involved in the phenomenon have an intrinsic length, connected to the spread of activation in some fashion. This was suggested by Gray-Keller et al, 1999. We are unclear at this stage on the precise mathematical formulation of this notion.
Fig. 8 below represents a numerical comparison of “spread” for five models and it takes into account the dependence of the longitudinal variable z and the angular variable θ. In all cases the spread is measured at time t = 200 ms.
FIGURE 8.

Curves “iso-suppression” at time t = 200 ms, for the five models (1) ROS well stirred in the transversal variables and activation, at the level zo, by Eqs. 23a and 23b. (2) Homogenized model with activated disc at level zo. Activation mechanism is Eqs. 23a and 23b. (3) Homogenized model with point-mass activation by the mechanism (Eq. 24). The activated point is on the disc 𝒟R × {zo}. (3i) Activation at the center of 𝒟R × {zo}. (3ii) Activation at  on 𝒟R × {zo}. (3iii) Activation at the rim ρ = R of 𝒟R × {zo}.
The horizontal axis reports the angles θ ∈ [0, 2π] and the vertical axis reports the longitudinal variable z with zo denoting the level of the activated disc. By ideally folding the horizontal segment [0, 2π] into a circle, one may regard these curves as drawn on the lateral surface of the ROS.
The curve marked in bold describes the process as activated by the mechanism (Eq. 24) with activation site on the rim of the disc 𝒟R × {zo} for  The length of the vertical segment included by this curve is the spread of the response at that particular location θ on the lateral boundary of the ROS. Varying θ and keeping z = zo fixed, means moving away from the activation site, while remaining on the boundary of the activated disc. The same indicated procedure provides the values for the spread at different values of θ. The picture shows that the farther from the activation site, the lower the spread. For each model, the curves drawn are, so to speak, curves of “iso-suppression”. This terminology is suggested by the definition (Eq. 25) of “spread” in terms of dark current suppression. Along them the current suppression is constant and equal to 1% of the dark current.
These simulations dramatically show the dependence of the spread on θ for those cases where activation is off the center of 𝒟R × {zo}. In all cases the activated area is considerably smaller than the total lateral surface of the ROS. The spread of the response is markedly different in the various models, and it can, in general, be evidenced only by means of a pointwise model.
DISCUSSION
Longitudinal and transversal diffusion in the cytosol
The control of signal transduction in cells occurs by precise, highly regulated localization of key enzymes in subcompartments in cells. Michaelis-Menten kinetics assume a well-stirred aqueous environment, and current approaches to modeling signal transduction pathways employ ordinary differential equations (Bhalla and Iyengar, 1999; Nikonov et al., 2000; Pugh and Lamb, 2000; Heinrich et al., 2002; Elowitz and Leibler, 2000). These methods do not seem to address the precisely regulated signal transduction processes emanating from these highly localized structures, sometimes called “signalsomes” (Pawson and Scott, 1997). Both invertebrate (Shieh and Niemeyer, 1995) and vertebrate (Korschen et al., 1999; Schwarzer et al., 2000; Poetsch et al., 2001) photoreceptors may also contain local signaling complexes.
The second messengers [cGMP] and [Ca2+], far from being bulk quantities, are pointwise functions of space and time. An examination of the geometry of the rod outer segment and the corresponding geometric parameters in the Table 1 parameters, reveals that the thickness of the interstices between the discs and the thickness of the outer shell are three order of magnitude smaller than the dimension of the rod. This suggests looking at the diffusion of [cGMP] and [Ca2+] at a scale that bridges between these two scales.
The original domain  available for diffusion, consists of transversal and longitudinal thin layers, but it is three-dimensional. Therefore, the only meaningful notion of diffusion is that of volumic, pointwise, direction-independent balance of mass (Fick's law) as indicated in Eq. 2. In particular
  does not distinguish between “transversal” and “longitudinal” diffusion and these notions, in the context of
  are not well defined.
As ɛ → 0 the domain  tends to the cylinder Ω. We define “transversal diffusion” as the limiting diffusion of cGMP and Ca2+ on such a limiting domain as indicated by Eq. 12. The outer shell Sɛ tends to the surface S. The limiting “boundary diffusion” of cGMP and Ca2+ on S is described by Eq. 15 and involves the longitudinal variable z ∈ (0, H) along the axis of the rod, and the angular variable θ ∈ (0, 2π]. Such a diffusion is “longitudinal” if it is independent of the angular variable θ. This occurs for example for radially symmetric solutions, or under the assumption that the cytosol is well stirred in the transversal variables (x, y). Thus, the homogenized-concentrated limit in Eqs. 11–15 provides a logical, rigorous notion of “longitudinal” and “transversal” diffusion.
Volume-surface reactions
A novel feature of our model is that phenomena such as PDE*-cGMP interactions, which physically occur on the surface of the discs, are correctly modeled as flux sources located on the discs Cj. Similarly, the evolution of [Ca2+] is effected by influx through cGMP-gated channels, and as such is described by source terms supported on the lateral boundary of the rod. In the existing literature, analogous source terms are accounted for as volumic quantities, against their actual physical location. This touches on the more general issue concerning the interaction of an enzyme bound to a membrane with a substrate distributed in the cytosol.
In the arguments leading to the formula (Eq. 4), the reaction at a fixed point  lying on one of the faces of the disc Cj is meant as occurring in an infinitesimal volume contiguous to
  Regarding now
  as variable on
  the function
  is defined on the faces
  as a surface density. In the formula (Eq. 4), the function
  although defined in the domain
  as a volume density, is meant as computed on the faces
  in the sense of the traces (DiBenedetto, 2002, Chapter IX).
Production or depletion rates are measured in mol of the substrate, per unit surface and per unit time. These interpretations are mathematically natural and permit one to give (Eq. 4) the correct dimensions of a flux. Similar considerations hold for the remaining volume-surface reactions regarding [Ca2+], [cGMP] and [PDE*]σ.
The same rate of production of cGMP as in the formula (Eq. 5) is given in Forti et al. (1989) as a volumic source for a well-stirred cytosol and in Gray-Keller et al. (1999), for an environment well stirred in the transversal variables  As indicated, it actually is a boundary source to be prescribed as a component of the flux of [cGMP] on each of the faces of the cylinders Cj. For the salamander rod, α = 13 μM s−1, β = 87 nM and m = 2.1 (Koutalos and Yau, 1996).
The formula (Eq. 6) is an approximate form of the depletion rate,
 |
where Kcat is the catalytic turnover rate, measured in s−1 and KM is a Michaelis constant. It is commonly accepted in the literature to neglect the contribution of [cGMP] in the denominator in favor of KM. This is justified because the maximum value of [cGMP] is ∼4 μM, whereas KM ≥ 40 μM (Lamb and Pugh, 1992). Such an approximation leads to the form (Eq. 6) of the depletion rate, with
 |
A satisfactory full modeling of the function  for
for  ranging over the face
  hit by the photon, is a major open problem. The rate of activation of the photoresponse indeed depends on the surface diffusion of rhodopsin. A hemizygous knockout of rhodopsin in transgenic mice leading to a 50% reduction of protein crowding, was shown by Calvert et al. (2001) to accelerate photoresponses by 1.7-fold.
The literature contains empirical attempts to describe such a function (Lamb and Pugh, 1992; Nikonov et al., 2000; Gray-Keller et al., 1999). We maintain that the function  should emerge out of its own diffusion process, based only on first principles, as follows:
A diffusion equation for the activated rhodopsin [R*]σ, on the face
 of the disc
  where light activation occurs, is written. The initial data for such a diffusion phenomenon would have to be a Dirac mass concentrated at the point
  where the photon acts.
Activated rhodopsin activates transducin. Activated transducin (G*) diffuses within
 A diffusion equation for the unknown function
  is written. The rhodopsin function
  in turn would serve as a source term into a diffusion process of the activated transducin. The initial data and the boundary flux for the [G*]σ would have to be zero.
The output of [G*]σ binds to PDE producing PDE*. The latter would have to satisfy a Fick's law, yielding a third diffusion equation for the function
 The various source terms would have to be derived by repeated application of the law of mass action.
Thus  appears as a solution of a system of diffusion partial differential equations arising from 1, 2, and 3 above and taking place on a disc face, coupled with the system of diffusion partial differential equations (Eq. 2), which take place in the cytosol. These two systems of diffusion equations are quite different in nature in that one takes place on a surface (the face
  ) and the other is volumic, taking place in
  Because of this, although the modeling pattern is rather clear, its mathematical implementation is intricate.
The model is flexible enough to permit one to include, by minor variants, the recovery phase, dark and light adaptation, the effect of buffers and incisures, as well as a variety of regulatory processes that impact on this cascade. These issues are the object of ongoing investigations.
The goal of this first investigation is to explain the theoretical mechanism of the mutual communication and interaction between transversal and longitudinal diffusion of the second messengers. It is remarkable that such a theoretical mechanism is independent of the form of the function  (Eqs. 11–15).
The idea of “local modeling” also enters in the expression (Eq. 10) for the flux of Ca2+ across the outer shell. Because the electrogenic exchange takes place through the Na+/Ca2+/K+ exchanger on the boundary of the rod, and it is local in nature, the contribution of Jex is taken as a boundary source. Similar considerations hold for the current density JcG due to the cGMP-gated channels.
The homogenized-concentrated limit
The modeling ideas leading to the flux term (Eq. 7) generate naturally a factor of ɛo on the distributed sources and the Dirac delta function on the activating sources. This provides a natural framework for the mathematical calculation of the homogenized-concentrated limit (Andreucci et al., 2002, 2003; see also Supplementary Material, Appendix A, § A1–A3.
Conversely computing the homogenized limit would not be possible if fluxes of [cGMP] were not distributed on the boundary of the discs with the physically correct scaling factor ɛo. Thus, the mathematical methods and the modeling ideas are mutually complementary.
By the homogenization process, diffusion effects taking place in the geometry of Fig. 1 are recast into diffusion processes holding in simpler geometries while preserving the key features of the original ones.
A descriptive summary of Eqs. 11–15 is:
The rod outer segment tends ideally to the cylinder Ω. As far as the physics of diffusion is concerned, the discs inside it disappear and the outer shell becomes the lateral boundary of Ω, i.e., the surface S = (0, 2π] × (0, H).
The diffusion of cGMP and Ca2+ reduces to a one-parameter family of diffusion equations holding on the disc 𝒟R, parameterized with the axial variable z as it ranges along the axis of the rod (0 < z < H). We call this the “interior, transversal diffusion” (see Eq. 12).
The diffusion process taking place in the outer shell can be concentrated to a surface evolution equation (by the Laplace-Beltrami operator) on the limiting surface S. We call this the “boundary diffusion” (see Eqs. 14 and 15).
The two diffusions interact with each other in two ways: a), the exterior flux of the interior diffusion serves as a source term for the boundary diffusion (see Eq. 15); and b), the interior limits of [cGMP] and [Ca2+], when computed on S coincide with the corresponding values diffusing on S (see Eq. 14).
On the speed of diffusion and effective diffusivities
The classical “bulk/lumped” theories arise as a particular case of our homogenized limit. Comparing our point of view with the existing well-stirred theories, provides a logical framework for the notions of “effective diffusivity” and “speed of diffusion” in the cytosol.
Equations 17 and 18 state that if the cytosol is well stirred in the transversal variables (x, y), the cGMP lumped on the axis of the rod, diffuses along z with diffusivity (fA/fV)DcG. This provides a mathematical validation of a result anticipated in Lamb et al. (1981) and Olson and Pugh (1993). Similar relations could be derived for the diffusion of Ca2+ “well stirred” in the (x, y) variables.
The geometric values of R, H and σɛo for the salamander give fA/fV ≈ .012. Therefore, the number Dz = (fA/fV)DcG is much smaller than DcG. Equivalently, the diffusivity in Eq. 17 is much less than the aqueous diffusivity coefficient DcG. This has been taken as evidence that diffusion in the interdiscal spaces is much faster than the longitudinal diffusion. Actually, the diffusion in the interdiscal spaces and that in the outer shell have the same diffusivity DcG, i.e., they occur with the same speed. However, an artificial cytosol, well stirred in the (x, y) variables, permits a diffusion only in the longitudinal variable z with diffusivity Dz. In this sense Dz is an “effective” diffusivity. The literature contains estimations of aqueous diffusivities (see Table 1).
The presence of incisures augments the relative area fA available for longitudinal diffusion. Therefore, the experimental value of Dz is expected to be larger (fA/fV ≈ .028 in Olson and Pugh (1993)). However, the presence of incisures renders less plausible the assumption of “well stirred” in the transversal variables (x, y).
Numerical simulations and comparisons with data
The numerical simulations presented here use the table of parameters of Khanal et al. (2003). The numerical approach, however, is based on finite elements (Ciarlet, 1978) and builds on the weak formulation (Eq. 16) and a more general form of weak formulation as presented in Andreucci et al. (2002, 2003) (see also Supplementary Material, Appendix A, § A4).
The three-dimensional model (Eqs. 2–10), as simulated in Khanal et al. (2003), assumes that the photon falls exactly at the center of the disc, thus generating radially symmetric solutions. It also forces one to take into account explicitly the contribution of all the discs in the rod. This augments the computational complexity and the running time, and renders unfeasible implementation of nonsymmetrical activations.
The homogenized version allows a free choice of the discretization step in the axial direction, is relatively simple to implement, has a considerably shorter running time, and permits one to simulate phenomena of nonsymmetric activations.
All the simulations are in remarkable quantitative agreement with the nonhomogenized numerical simulations of Khanal et al. (2003). This last occurrence shows that the homogenization is the correct way of modeling the phenomenon, by passing information across scales.
Our simulations are of two orders. First the pointwise current is integrated over the lateral boundary of the rod outer segment and suppression of dark current is computed. The suppression of dark current, corresponding to a single-photon response, as indicated in Fig. 3 is in close agreement with the experimental data of F. Rieke (0.5–1.5% at 800 ms; unpublished, personal communication; see also Vu et al. (1997)). The Rieke measurements were in salamander. The range of 2–5% present in the literature (Baylor et al., 1979; Lamb et al., 1981) refers to the toad.
The second order involves pointwise calculations of [Ca2+], [cGMP] (and current) on the boundary of the outer segment. Our simulations, run over a time period of 1.2 s, assume activation of a single rhodopsin and generate a “localized” spread of excitation about the activated disc. This is in good qualitative agreement with the experimental results of Gray-Keller et al. (1999) who used two-photon excitation to locally stimulate rhodopsin. In their experiments, each flash was estimated to activate ∼20 rhodopsins spanning over ∼40 discs. This suggests that if, theoretically, a single rhodopsin were activated, the spread of 5 μm they detected, would probably be an overestimate.
The amplitudes predicted by our model are smaller (but of the same order) than the experimental results of Gray-Keller et al. (1999). The two results, however, are not directly comparable as the notion of spread and the experimental setup and parameters are significantly different. In that work the spread is defined as the distance from the activation site where the current is e−1 of the peak response, measured at the time of peak response. The experiments are carried on the gecko ROS and 10–20 rhodopsins were activated as opposed to only one. Our parameters are for the salamander and the spread is a function of space and time. Further discussion on the notion of spread is in Supplementary Material, Appendix B, § B1.
In all cases the current suppression and the spread of activation depends strongly on the diffusion parameters D* and DcG and on the ratio νRE/kE. There is considerable variability of these parameters. In the simulations we have taken kE as in Nikonov et al. (2000), and have varied νRE from 220/s to 275/s. The value of νRE estimated in Gray-Keller et al. (1999), for the gecko is ∼1000/s. In Lamb and Pugh (1992), it is conjectured that Rh* and PDE are immobile, that G* is produced at a single point and that the disc is actually infinite (the whole plane). To compensate for the stillness of Rh* and PDE it is assumed that G* diffuses on the faces of the discs with diffusivity DG*, given by the sum of the diffusivities of rhodopsin, G-protein and PDE. Rough, indirect estimates for the values of these diffusivities are given, and result into DG* ≈ 3 μm2/s. It is further assumed that PDE* is generated instantaneously by G* and that the ratio of the two quantities must remain constant. Thus [PDE*] must diffuse with the same diffusivity as G*. We are uncertain of the physical and mathematical basis of these assumptions. However, to compare our model to existing theories we have assumed that PDE* is generated by a point source and diffuses on the face of the disc (not an infinite plane) with diffusivity of the same order as the one proposed in Lamb and Pugh (1992). This is the basis of the activating mechanism (Eq. 24) as well as for the choice D* = 5 μm2/s. In Supplementary Material, Appendix B, § B2, we report on numerical simulations with various numerical values combinations of the diffusivities D* and DcG while keeping the value of νRE to the published value of 220/s.
Past the time of peak response t ≈ 800 ms, the simulated current suppression keeps increasing, because the model does not contain a viable recovery mechanism other than the negative damping term in Eq. 23a and the corresponding one in Eq. 24.
These remarks, the numerical simulations and the attempts, present in the literature, of modeling the lateral diffusion of Rh*, G*, and PDE* point to a need for a more complete understanding of the role of diffusion in the activation mechanism.
Numerical setup
The domain of integration consists of volumes (the interior of the cylinder Ω) and surfaces (the outer shell S and the limiting activated disc 𝒟R × {zo}). The volumes have been discretized by tetrahedral elements whereas the surfaces have been subdivided into triangles. Both are isoparametric elements based on affine, shape functions. As a consequence, both [cGMP] and [Ca2+] are approximated by continuous, piecewise affine functions. The time discretization has been achieved by an implicit finite-difference scheme, thus guaranteeing an intrinsic numerical stability. The nonlinear forcing terms have been linearized within each of the discretization elements about the local, instantaneous, mean value of each of the unknowns [cGMP] and [Ca2+].
The peculiar nature of the problem does not permit direct usage of standard finite element packages. Accordingly we have generated a dedicated finite-element code within the Matlab (Natick, MA) interpreted environment. A suitable mesh generator has been written so that local refinements of the mesh are permitted within predefined regions, such as the one near the activated disc 𝒟R × {zo}. The values of the global current have been calculated by numerical integration of the sum JcG + Jex, where [cGMP] and [Ca2+] are, at each time, the nodal solutions. Runs were done on a Dell Poweredge 4600 server with dual Xeon 2.2 GHz processors, 2.5 GB of RAM with Redhat 7.3 Linux operating system and utilities.
CONCLUSIONS
We have developed a model describing the correlation between the transversal and longitudinal diffusion of cGMP and Ca2+ in the rod outer segment. This model, at present, examines the excitation phase of the signaling cascade of the rod outer segment in response to illumination. The model does not assume that the cytosol is well stirred, and as a result, the exact biochemical processes that are occurring do not have to be assumed to be averaged over the total rod outer segment. This allows for the potential to examine more locally the current fluxes that are occurring and how these localized current fluxes combine to elicit a response in the rods.
The two main modeling ideas to arise from this work are: 1), a novel approach to correctly model surfaces to volumes interactions; and 2), retaining all of the spatio-temporal information while obtaining an easily computable signaling module. In regards to the first point, biochemical formalisms such as Michaelis-Menten and Hill relationships that describe enzyme kinetics, assume a well-stirred environment. These formalisms do not adequately describe cases where the enzyme or substrate are membrane bound. Thus, the modeling ideas described here may be applied to correctly model membrane-associated phenomena. In regards to the second point, homogenization is an approach that allows all of the dynamic spatio-temporal signaling information to be retained across two different geometric scales while still allowing a computational approach to modeling.
We postulate that homogenization methods similar to those described here can be applied to other complex geometries of many cell types. Single signal transduction modules, such as the one described here, may be able to be built up together to describe multiple signal transduction pathways interacting in ways known from biological experimentation or predicted from the model. The level of cellular regulatory complexity that is unfolding is likely to call upon mathematical models of signal transduction for critical evaluation of the data, for quantitative understanding of the processes, as well as for useful tools for designing discriminating experiments (Hartwell et al., 1999).
SUPPLEMENTARY MATERIAL
An online supplement to this article can be found by visiting BJ Online at http://www.biophysj.org.
Supplementary Material
Acknowledgments
We would like to thank Vasilios Alexiades, of the University of Tennessee Knoxville and the Oak Ridge National Laboratory, and Lou DeFelice and Lee Limbird of the Vanderbilt Medical School for numerous conversations and critical reading of the manuscript. We are also indebted to P. Detwiler and F. Rieke of the University of Washington, Seattle, for helping us interpret published data and interpolate estimates. We are particularly grateful to F. Rieke for extensive conversations and for sharing unpublished data.
References
- Andreucci, D. 1990. Existence and uniqueness of solutions to a concentrated capacity problem with change of phase. European J. Appl. Math. 1:339–351. [Google Scholar]
- Andreucci, D., P. Bisegna, and E. DiBenedetto. 2002. Homogenization and concentrated capacity in reticular almost disconnected structures. C. R. Math. Acad. Sci. Paris. 335:329–332. [Google Scholar]
- Andreucci, D., P. Bisegna, and E. DiBenedetto. 2003. Homogenization and concentrated capacity for the heat equation with nonlinear variational data in reticular almost disconnected structures and applications to visual transduction. Ann. Mat. Pura Appl. (4). In press.
- Bensoussan, A., J.-L. Lions, and G. Papanicolau. 1978. Asymptotic Analysis for Periodic Structures. Studies in Mathematics and its Applications 5. North-Holland, New York.
- Bhalla, U. S., and R. Iyengar. 1999. Emergent properties of networks of biological signaling pathways. Science. 283:381–387. [DOI] [PubMed] [Google Scholar]
- Burns, M. E., and D. A. Baylor. 2001. Activation, deactivation, and adaptation in vertebrate photoreceptor cells. Annu. Rev. Neurosci. 24:779–805. [DOI] [PubMed] [Google Scholar]
- Calvert, P. D., V. I. Govardovskii, N. Krasnoperova, R. E. Anderson, J. Lem, and C. L. Makino. 2001. Membrane protein diffusion sets the speed of rod phototransduction. Nature. 411:90–94. [DOI] [PubMed] [Google Scholar]
- Ciarlet, P. G. 1978. The Finite Element Method for Elliptic Problems. Studies in Mathematics and its Applications 4. North-Holland, Amsterdam.
- Ciarlet, P. G., and V. Lods. 1996. Asymptotic analysis of linearly elastic shells. I. Justification of membrane shell equations. Arch. Rational Mech. Anal. 136:119–161. [Google Scholar]
- Cioranescu, D., and J. Saint-Jean-Paulin. 1998. Homogenization of Reticulated Structures. Applied Mathematical Sciences 136, Springer, New York.
- DiBenedetto, E. 2002. Real Analysis. Birkhäuser, Boston.
- Dumke, C. L., V. Y. Arshavsky, P. D. Calvert, M. D. Bownds, and E. N. Pugh, Jr. 1994. Rod outer segment structure influences the apparent kinetic parameters of cyclic GMP phosphodiesterase. J. Gen. Physiol. 103:1071–1098. [DOI] [PMC free article] [PubMed] [Google Scholar]
- Elowitz, M. B., and S. Leibler. 2000. A synthetic oscillatory network of transcriptional regulators. Nature. 403:335–338. [DOI] [PubMed] [Google Scholar]
- Forti, S., A. Menini, G. Rispoli, and V. Torre. 1989. Kinetics of phototransduction in retinal rods of the newt Triturus cristatus. J. Physiol. 419:265–295. [DOI] [PMC free article] [PubMed] [Google Scholar]
- Gray-Keller, M. P., and P. B. Detwiler. 1996. Ca2+ dependence of dark- and light-adapted flash responses in rod photoreceptors. Neuron. 17:323–331. [DOI] [PubMed] [Google Scholar]
- Gray-Keller, M., W. Denk, B. Shraiman, and P. B. Detwiler. 1999. Longitudinal spread of second messenger signals in isolated rod outer segments of lizards. J. Physiol. 519:679–692. [DOI] [PMC free article] [PubMed] [Google Scholar]
- Hartwell, L. H., J. J. Hopfield, S. Leibler, and A. W. Murray. 1999. From molecular to modular cell biology. Nature. 402:C47–C52. [DOI] [PubMed] [Google Scholar]
- Heinrich, R., B. G. Neel, and T. A. Rapoport. 2002. Mathematical models of protein kinase signal transduction. Mol. Cell. 9:957–970. [DOI] [PubMed] [Google Scholar]
- Khanal, H., V. Alexiades, E. DiBenedetto, and H. E. Hamm. 2002. Numerical simulations of diffusion of second messengers cGMP and Ca2+ in rod photoreceptor outer segment of vertebrates. AIP, Proceedings of “Unsolved Problems in Noise and Fluctuation,” National Institutes of Health, Bethesda, MD. In press.
- Khanal, H., V. Alexiades, E. DiBenedetto, and H. E. Hamm. 2003. Numerical Simulations of Diffusion and Interaction in Visual Transduction. In press.
- Korschen, H. G., M. Beyermann, F. Muller, M. Heck, M. Vantler, K. W. Koch, R. Kellner, U. Wolfrum, C. Bode, K. P. Hofmann, and U. B. Kaupp. 1999. Interaction of glutamic-acid-rich proteins with the cGMP signalling pathway in rod photoreceptors. Nature. 400:761–766. [DOI] [PubMed] [Google Scholar]
- Koutalos, Y., K. Nakatani, and K.-W. Yau. 1995. Cyclic GMP diffusion coefficients in rod photoreceptor outer segments. Biophys. J. 68:373–382. [DOI] [PMC free article] [PubMed] [Google Scholar]
- Koutalos, Y., and K.-W. Yau. 1996. Regulation of sensitivity in vertebrate rod photoreceptors by calcium. Trends Neurosci. 19:73–81. [DOI] [PubMed] [Google Scholar]
- Ladyzhenskaya, O. A., V. A. Solonnikov, and N. N. Ural'tzeva. 1968. Linear and Quasilinear Equations of Parabolic Type. Translations of Math. Monographs 23, American Mathematical Society, Providence RI.
- Lamb, T. D., P. A. McNaughton, and K.-W. Yau. 1981. Spatial spread of activation and background desensitization in toad rod outer segment. J. Physiol. 319:463–496. [DOI] [PMC free article] [PubMed] [Google Scholar]
- Lamb, T. D., and E. N. Pugh, Jr. 1992. A quantitative account of the activation steps involved in phototransduction in amphibian photoreceptors. J. Physiol. 449:719–758. [DOI] [PMC free article] [PubMed] [Google Scholar]
- Lamb, T. D., and E. N. Pugh, Jr. 1993. Amplification and kinetics of the activation steps in phototransduction. Biochim. Biophys. Acta. 1141:111–149. [DOI] [PubMed] [Google Scholar]
- Leskov, I. B., V. A. Klenchin, J. W. Handy, G. G. Whitlock, V. I. Govardovskii, M. D. Bownds, T. D. Lamb, E. N. Pugh, Jr., and V. Y. Arshavsky. 2000. The gain of rod phototransduction: reconciliation of biochemical and electrophysiological measurements. Neuron. 27:525–537. [DOI] [PubMed] [Google Scholar]
- Liebman, P. A., K. R. Parker, and E. A. Dratz. 1987. The molecular mechanism of visual excitation and its relation to the structure and composition of the rod outer segment. Annu. Rev. Physiol. 49:765–791. [DOI] [PubMed] [Google Scholar]
- Magenes, E. 1998. Stefan problems with a concentrated capacity. Boll. Unione Mat. Ital. Sez. B Artic. Ric. Mat. 1:71–81. [Google Scholar]
- Matthews, G. 1986. Spread of the light response along the rod outer segments: an estimate of the patch-clamp recordings. Vision Res. 26:535–541. [DOI] [PubMed] [Google Scholar]
- Motygin, O. V., and S. A. Nazarov. 2000. Justification of the Kirchhoff hypotheses and error estimation for two-dimensional models of anisotropic and inhomogeneous plates, including laminated plates. IMA J. Math. Appl. 65:1–28. [Google Scholar]
- Nakatani, K., C. Chen, and Y. Koutalos. 2002. Calcium diffusion coefficient in rod photoreceptor outer segments. Biophys. J. 82:728–739. [DOI] [PMC free article] [PubMed] [Google Scholar]
- Nikonov, S., T. D. Lamb, and E. N. Pugh, Jr. 2000. The role of steady phosphodiesterase activity in the kinetics and sensitivity of the light-adapted salamander rod photoresponse. J. Gen. Physiol. 116:795–824. [DOI] [PMC free article] [PubMed] [Google Scholar]
- Oleinik, O. A., A. S. Shamaev, and G. A. Yosifian. 1992. Mathematical Problems in Elasticity and Homogenization. Studies in Mathematics and its Applications 26. North-Holland, Amsterdam.
- Olson, A., and E. N. Pugh, Jr. 1993. Diffusion coefficient of cyclic GMP in salamander rod outer segments estimated with two fluorescent probes. Biophys. J. 65:1335–1352. [DOI] [PMC free article] [PubMed] [Google Scholar]
- Pawson, T., and J. D. Scott. 1997. Signaling through scaffold, anchoring, and adaptor proteins. Science. 278:2075–2080. [DOI] [PubMed] [Google Scholar]
- Poetsch, A., L. L. Molday, and R. S. Molday. 2001. The cGMP-gated channel and related glutamic acid-rich proteins interact with peripherin-2 at the rim region of rod photoreceptor disc membranes. J. Biol. Chem. 276:48009–48016. [DOI] [PubMed] [Google Scholar]
- Pugh, E. N., Jr., and T. D. Lamb. 1993. Amplification and kinetics of the activation steps in phototrasduction. Biochim. Biophys. Acta. 1141:111–149. [DOI] [PubMed] [Google Scholar]
- Pugh, E. N., Jr., and T. D. Lamb. 2000. Phototransduction in vertebrate rods and cones: molecular mechanisms of amplification, recovery and light adaptation. In Handbook of Biological Physics, Vol. 3, Chap. 5. Elsevier Science, St. Louis.
- Schnapf, J. L., and D. A. Baylor. 1987. How photoreceptor cells respond to light. Sci. Am. 256:40–47. [DOI] [PubMed] [Google Scholar]
- Schwarzer, A., H. Schauf, and P. J. Bauer. 2000. Binding of the cGMP-gated channel to the Na/Ca-K exchanger in rod photoreceptors. J. Biol. Chem. 275:13448–13454. [DOI] [PubMed] [Google Scholar]
- Shieh, B. H., and B. Niemeyer. 1995. A novel protein encoded by the InaD gene regulates recovery of visual transduction in Drosophila. Neuron. 14:201–210. [DOI] [PubMed] [Google Scholar]
- Stryer, L. 1987. The molecules of visual excitation. Sci. Am. 257:42–50. [DOI] [PubMed] [Google Scholar]
- Stryer, L. 1991. Visual excitation and recovery. J. Biol. Chem. 266:10711–10714. [PubMed] [Google Scholar]
- Vu, T. Q., S. T. McCarthy, and W. G. Owen. 1997. Linear transduction of natural stimuli by dark-adapted and light-adapted rods of the salamander Ambystoma tigrinum. J. Physiol. 505:193–204. [DOI] [PMC free article] [PubMed] [Google Scholar]
- Wald, G. 1968. The molecular basis of visual excitation. Nature. 219:800–807. [DOI] [PubMed] [Google Scholar]
Associated Data
This section collects any data citations, data availability statements, or supplementary materials included in this article.