Abstract
The vibrational energy relaxation of a selected vibrational mode in cytochrome c—a C-D stretch in the terminal methyl group of Met80—has been studied using equilibrium molecular dynamics simulation and normal mode analysis methods. As demonstrated in the pioneering work of Romesberg and co-workers, isotopic labeling of the C-H (to C-D) stretch in alkyl side chains shifts the stretching frequency to the transparent region of the protein's density of states, making it an effective and versatile probe of protein structure and dynamics. Molecular dynamics trajectories of solvated cytochrome c were run at 300 K, and vibrational population relaxation times were estimated using the classical Landau-Teller-Zwanzig model and a number of semiclassical theories of resonant and two-phonon vibrational relaxation processes. The C-D stretch vibrational population relaxation time is estimated to be T1 = 14–40 ps; the relatively close agreement between various semiclassical estimates of T1 lends support to the applicability of those expressions. Normal mode calculations were used to identify the dominant coupling between the protein and C-D oscillator. All bath modes strongly coupled to the C-D stretch are in close proximity. Angle bending modes in the terminal methyl group of Met80 appear to be the most likely acceptor modes defining the mechanism of population relaxation of the C-D vibration.
INTRODUCTION
Following fundamental events such as ligand binding or electron transfer, heme proteins may be vibrationally excited. Understanding the timescales and mechanisms of vibrational energy relaxation (VER) is an essential component of an understanding of the ultrafast conformational changes and the reorganization of protein structures that follow such fundamental events (Zewail, 1996). Much experimental and theoretical work has been done to investigate the rate of vibrational energy relaxation for small diatomic ligands (Hill et al., 1996; Ma et al., 1997; Park et al., 2000; Okazaki et al., 2001), particularly CO in the heme protein myoglobin. Metal carbonyls have high oscillator strength, large absorption coefficients, and strong electronic resonance in the visible and ultraviolet regimes, making them excellent spectroscopic probes. Moreover, the stretching frequency of carbon monoxide, when bound to iron (∼1960 cm−1) or free (∼2140 cm−1), falls in a transparent region of the vibrational density of states of most proteins. In myoglobin, ligand dissociation can occur when the ligand-heme complex absorbs a visible or UV photon, which can cause vibrational excitation of the ligand, heme, and surrounding residues (Kholodenko et al., 2000; Asplund et al., 2000) and a global conformational transformation of the protein. The detailed analysis of vibrational relaxation of heme proteins has provided important information about the cooperative nature of protein dynamics (Muench and Champion, 1975; Greene et al., 1978; Henry et al., 1986; Anfinrud et al., 1989; Genberg et al., 1989; Lim et al., 1995, 1996; Hill et al., 1996; Karplus, 2000; Frauenfelder and McMahon, 2001).
The relaxation kinetics and the structural evolution are typically monitored experimentally using techniques such as IR, Raman, or resonance Raman spectroscopy. By exciting the heme with a selected pulse, time domain experiments can monitor the decay of the excited vibrational modes. The advantage of these methods of spectroscopy is their extreme sensitivity to changes in molecular interaction and structure. The difficulties encountered in interpreting crowded vibrational spectra can be best overcome through the use of site specific isotopic labeling. As opposed to fluorescence methods that require the addition of a bulky probe, isotopic labeling has the great advantage that it does not alter the function of the protein and, therefore, is the method least prone to misinterpretation.
Recently, Romesberg and co-workers have demonstrated the ability to introduce selective deuterium labels on aliphatic carbons and to use the C-D stretch as a sensitive probe of the proteins' structure and dynamics (Chin et al., 2001, 2002). Their methodology holds the potential to dramatically improve the ability of pump/probe spectroscopy to probe the structure and dynamics of proteins during folding or in response to an excitation resulting from ligand binding or electron transfer events. Labeling sites of a large protein presents a greater synthetic challenge, although corresponding tools have been developed.
For a full exploitation of the information content of vibrational spectroscopy, quantum chemical calculations are necessary (Augspurger et al., 1991). Calculations treating the molecular group in a vacuum provide a basis for the interpretation. For a better understanding of the structure and interaction of molecular groups within the protein, however, the environment must be taken into account (Oxtoby, 1979, 1981; Whitnell et al., 1992; Rey and Hynes, 1996; Ma et al., 1997). The molecular group and the rest of the protein influence each other, and the challenge is to merge the accurate vibrational dynamics of the small group with the molecular mechanics of the surrounding protein (Vogel and Siebert, 2000).
In this work, we have studied the relaxation rate of a selected vibrational mode in the protein cytochrome c (cyt c). Cyt c is one of the most thoroughly physicochemically characterized metalloproteins (Sivakolundu and Mabrouk, 2000). It consists of a single polypeptide chain containing 104 amino acid residues and is organized into a series of five α-helices and six β-turns. The heme active site in cyt c consists of a 6-coordinate low-spin iron that binds His18 and Met80 as the axial ligands. In addition, two cysteines (Cys14 and Cys17) are covalently bonded through thioether bridges to the heme. Crystal structures of cyt c show that the heme group, which is located in a groove and almost completely buried inside the protein, is nonplanar and somewhat distorted into a saddle-shape geometry. The reduced protein, ferrocytochrome c (ferrocyt c), is relatively compact and very stable, due to the fact that the heme group is neutral.
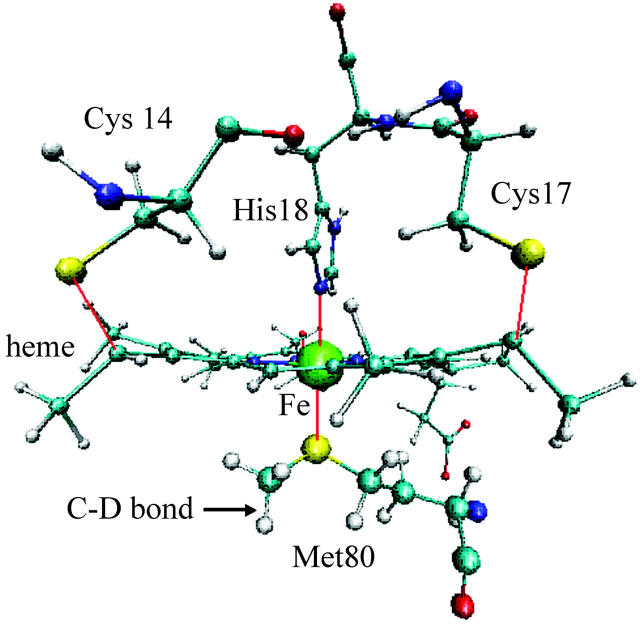
The vibrational mode we have chosen for study is the isotopically labeled C-D stretch in the terminal methyl group of the residue Met80, which is connected to Fe in the HEC plane (see Fig. 1). The C-H and C-D stretching bands are located near 3000 cm−1 and 2200 cm−1, respectively. In contrast with the modeling of photolyzed CO in myoglobin (Sagnella and Straub, 1999; Sagnella et al., 1999), essentially a diatomic molecule in a protein “solvent,” we are interested in the relaxation of a selected vibrational mode of a larger molecule. As a result, the modeling is more challenging. There is no clean separation between the system and bath modes. We demonstrate that the classical and semiclassical models provide a physically reasonable estimate of both the timescale of vibrational relaxation and the pathways of the energy flow. The methods employed in the detailed analysis of the vibrational energy relaxation process in cytochrome c provide an effective method for the analysis of vibrational energy relaxation in proteins.
FIGURE 1.
The active site of cytochrome c showing the heme group and residues His18 and Met80 which ligate the heme Fe atom. The heme is covalently attached to the apoprotein by two thio-ether linkages, formed by addition of the thiol groups of two cysteine residues, Cys14 and Cys17, to vinyl groups of the heme side chains.
COMPUTATIONAL MODEL AND METHODS
Molecular dynamics
The proposed computational protocol follows closely that of Sagnella and Straub (Sagnella and Straub, 1999; Sagnella et al., 1999). An x-ray structure of the horse heart cytochrome c molecule (Bushnell et al., 1990) was used as the initial configuration. (Please note that this structure, 1HRC, is an oxidized form of cyt c, but it is also the only high resolution x-ray crystallography structure for horse heart cyt c in the PDB. Since the difference between structures of the reduced and oxidized forms of cyt c is in the limit of resolution of x-ray and NMR instruments, we take 1HRC as our initial structure, then we use reduced heme, i.e., Fe(II) heme, parameters in CHARMM force field to equilibrate the structure.) That structure was then introduced into a 55.872 × 55.872 × 55.872 Å3 truncated octahedral box of equilibrated TIP3 water molecules and simulated using the CHARMM program (Brooks et al., 1983). The all-hydrogen parameter set (version 27) with CHARMM (MacKerell, Jr. et al., 1998) was used. Equilibrated water molecules lying within 2.5 Å of the protein molecule were removed, while the original water molecules of the x-ray structure were preserved. The excess potential energy due to bad contacts and strain was then reduced using the steepest descent energy minimization method.
Using classical molecular dynamics, the system was gradually heated to 300 K. One molecular dynamics trajectory was run for 20 ps at constant pressure and temperature. During equilibration, the velocities were resampled according to the Maxwell distribution to maintain a constant temperature. The molecular dynamics employed the Verlet algorithm, which is time-reversible and symplectic (Verlet, 1967; Tuckerman et al., 1992; Frenkel and Smit, 2001), with a time step of 1 fs. The van der Waals potential was truncated using a group switching function extending from 8.0 to 12.0 Å, and the electrostatics force was truncated using a switching function extending from 8.0 to 12.0 Å. During the equilibration run, the volume of the box was found to fluctuate around a well-defined average value. At that point, it was assumed that an equilibrium state had been reached and data could be collected from the constant energy dynamics with a fixed volume of 53.934 × 53.934 × 53.934 Å3. Molecular dynamics trajectories were run for 200 ps at constant energy and volume. Snapshot configurations were saved every 20 ps. From each of the 10 configurations obtained in this way, 40 ps trajectories were run at constant energy and volume during which the coordinates were saved every 200 fs for analysis.
Computational methods for computing T1
The process of vibrational relaxation involves the dissipation of excess vibrational energy into the surroundings. The time decay of the vibrational energy relaxation may be a single exponential (the Landau-Teller result) (Zwanzig, 1961)
 |
(1) |
where T1 is the vibrational relaxation time. (In general, 〈Eν(∞)〉 will be assumed to take the thermal value kBT.) By beginning with a specified value of 〈Eν(0)〉, we can, in principle, determine T1 through molecular dynamics simulations. In this article, we employ Eqs. 3 and 4 below to calculate T1 with use of equilibrium MD.
Semiclassical theories of VER rates
We have shown how direct computation of the classical force autocorrelation function on a selected vibrational mode can be used to compute the vibrational population relaxation time for a selected mode in a protein environment (Sagnella and Straub, 1999; Sagnella et al., 1999). Following Skinner, we employ a number of semiclassical theories to estimate the rate of energy relaxation (Skinner and Park, 2001). Through comparison with the results of the classical theory, we might estimate the importance of quantum corrections and the reliability of our classical models.
An estimate of the rate constant for the ν = 1 to ν = 0 vibrational transition, assuming the vibration to be harmonic for the ν = 0 to ν = 1 states, can be written
 |
(2) |
If we assume that the Fourier transform of a quantum time-correlation function can be replaced by its classical analog, multiplied by a quantum-correction factor (Skinner and Park, 2001), the rate becomes
 |
(3) |
where the rate constant
 |
(4) |
The force correlation function includes the effects of the density of states and coupling strength to the surrounding solvent. The scalar force along the bond is computed as
 |
(5) |
where  is the force felt by the atom i of the C-D mode due to the surrounding “bath” of protein and solvent atoms, V is the potential energy interaction between the C-D mode and the bath, and
  is the C-D bond unit vector. During the simulation, the C-D bond is constrained to its equilibrium length using the SHAKE algorithm (Ryckaert et al., 1977) and the force along the bond is determined. The fluctuating force autocorrelation function and its Fourier transform are then used to determine the vibrational relaxation time of the C-D stretch mode (Sagnella and Straub, 1999; Sagnella et al., 1999).
What Q(ω) should be depends on the mechanism of the vibrational relaxation (Skinner and Park, 2001). In the case of energy transfer from a vibrational mode of frequency ω to a resonant bath mode, the quantum correction factor may be Q = QH(ω) where the harmonic QCF is
 |
(6) |
In the case of nonresonant energy transfer, a vibrational mode of frequency ω may transfer vibrational energy to one dominant accepting mode of frequency ωi with the remainder, corresponding to w − ωi, being taken up by the nonvibrational energy bath. The quantum-correction factor, QCF, may then be either Q = QH(ωi)QH(ω − ωi) or Q = QH(ωi)QHS(ω − ωi), where the harmonic/Schofield QCF (Skinner and Park, 2001) is
 |
(7) |
Classical theory of VER rates
If we take a purely classical view and assume the C-D bond is a Brownian oscillator, the motion of the solute can be described by the Langevin equation
 |
(8) |
where r is the solute coordinate, γ the friction constant, and R(t) the fluctuating random force acting on the r coordinate. A more accurate microscopic model is to assume the motion is governed by the generalized Langevin equation,
 |
(9) |
where ζ(t) is the time-dependent friction and W(r) is the potential of mean force.
For a system that is well-described as an anharmonic oscillator bilinearly coupled to a bath of harmonic oscillators, the above-mentioned generalized Langevin equation model is accurate and the relaxation time can be approximated by a Landau-Teller result of the form (Oxtoby, 1979, 1981; Zwanzig, 1961),
 |
(10) |
where ω0 is the frequency of the oscillator as determined by the environment. A remarkable result of Bader and Berne (1994) is that this estimate of T1 for a classical solute in a classical solvent is, for the harmonic model, identical to the T1 for the quantum solute in the quantum bath. We will exploit this result to use classical simulations to derive quantum relaxation times.
By the second fluctuation-dissipation theorem, the time-dependent friction is proportional to the equilibrium time correlation function of the fluctuating random force, R = δF = F − 〈F〉, acting on the oscillator
 |
(11) |
where μ is the reduced mass of the oscillator.
Analysis of normal modes
To detect the mechanism of energy relaxation, it is important to identify the protein and solvent “bath” vibrational modes that are most strongly coupled to the C-D bond stretching mode. As the discussion in the previous section makes clear, this can be done through a normal mode analysis based on quenched normal modes (QNM) or instantaneous normal modes (INM). In each case, the normal mode spectrum is determined by taking “snap-shot” configurations from the dynamical trajectories. For the QNM spectrum, the configuration is optimized to the nearest local minimum of the potential energy, then the normal mode analysis is performed for the quenched states. QNM is a straightforward way to separate and examine the vibrational density of states of the system and bath modes. In the INM spectrum, the normal mode analysis is carried out on the snap-shot configuration itself. INM is suitable for short-time dynamics of simple solutes in liquids (Seeley and Keyes, 1989; Goodyear and Stratt, 1996, 1997) and has been applied to proteins (Sagnella et al., 2000). Using the vibrational frequency shifts for the C-D stretching mode derived from the normal mode analysis, we can detect the configuration transformation of the local environment of the C-D mode during the vibrational energy relaxation process.
When using a normal mode model to calculate the friction along a vibrational coordinate, we assume that the system can be described as an anharmonic oscillator bilinearly coupled to a bath of harmonic oscillators xi (atom positions) of the surrounding protein and solvent
 |
(12) |
where
 |
(13) |
This Hamiltonian can also be written as
 |
(14) |
where
 |
(15) |
and
 |
(16) |
It follows that
 |
(17) |
and the potential of mean force is
 |
(18) |
We use mass-weighted coordinates  and
and  . The Hamiltonian becomes
 |
(19) |
where pi are the conjugate momenta, and ωi are the frequencies of the normal modes. The time-dependent friction can then be written as a sum over the bath modes coupled to the oscillator coordinate (Zwanzig, 1973)
 |
(20) |
We can compare the results for ζ(t) with the molecular dynamics calculations. The coupling constant Ci between the bath coordinates and the oscillator (C-D) stretching coordinate is defined as
 |
(21) |
where Ui,j are the coefficients of the eigenvector matrix of the normal modes.
Normal mode calculation can also be used to determine the role of collective motions in the dynamics of the system. The density of states of a given system can provide insight into possible modes available for vibrational relaxation of the C-D bond, and is given by
 |
(22) |
We define the participation ratios as
 |
(23) |
and
 |
(24) |
where  is the number of degrees of freedom involved in the ith mode and
  is the number of protein residues and water molecules participating in that mode. The participation ratios provide a measure of the degree of localization of each mode. If a mode is completely localized, only one of the eigenvector coefficients will be nonzero, which means
  will be equal to unity. On the contrary, if a mode is completely delocalized, each degree of freedom will be equally involved in that mode and
  will be equal to 3N. Using the participation ratios together with the distribution of
  also called the “influence spectrum,” we can determine the identity and character of the principal modes responsible for the C-D bond vibrational relaxation.
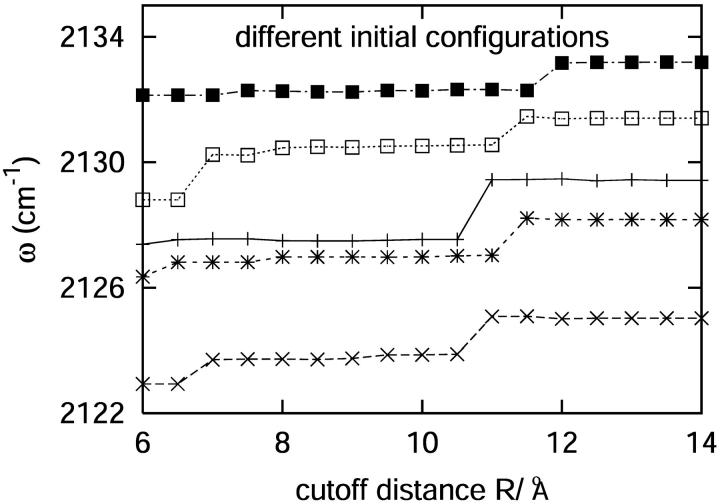
For normal mode calculations, 100 configurations were picked from 10 independent trajectories. For each of these configurations, any residue whose center of mass was outside a 12.0 Å radius from the center of mass of the C-D oscillator was removed. The cutoff distance of 12.0 Å was chosen based on Fig. 2, which shows the variation in the frequency of the C-D vibration as a function of the cutoff distance. Beyond a cutoff of 12.0 Å, the C-D stretch frequency has converged to the infinite or “no cutoff” value, justifying the use of a 12 Å cutoff in the computation of D(ω). For the QNM calculations, the system subset of atoms within 12.0 Å of the C-D bond was then energy-minimized using the adopted basis Newton-Raphson method (Brooks et al., 1983).
FIGURE 2.
The variation of the C-D vibrational frequency as a function of the cutoff distance for a number of different configurations.
RESULTS
In this section, the value of T1 is estimated, normal mode methods are used to determine important doorway modes for energy transfer from the C-D stretch to the protein and solvent bath, and the dominant contributions to the C-D bond vibrational relaxation process are identified.
C-D vibrational population relaxation times
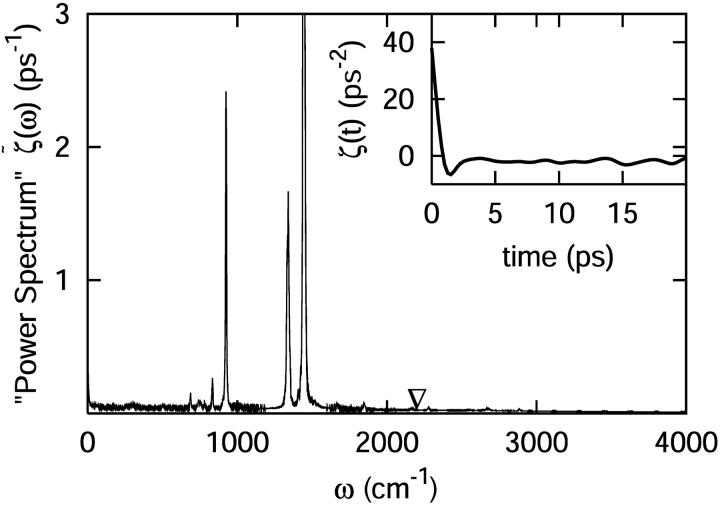
Relaxation times of high frequency oscillators can be directly related to the Fourier transform of the fluctuating force-force autocorrelation function 〈δF(0)δF(t)〉 of the force along a rigid bond. In determining the vibrational relaxation time, the value of the friction kernel at the frequency of the oscillator is used. The Fourier transform of the classical fluctuating force correlation function was computed as a function of frequency from our simulations. The result of the fluctuating force autocorrelation function 〈δF(0)δF(t)〉, averaged over 10 trajectories, is shown in Fig. 3. Using this method and
 |
(25) |
the relaxation time of the C-D oscillator was estimated using a variety of possible quantum correction factors.
FIGURE 3.
The classical fluctuating force correlation function for the C-D oscillator, proportional to ζ(t) and computed through the force acting on the C-D bond, after smoothing over nine points. The ∇ marks the C-D oscillator frequency at 2133 cm−1. The data have been smoothed for clarity. Displayed in the inlay is the fluctuating force autocorrelation function for the C-D bond stretch. This function was averaged over 10 independent trajectories.
The power spectrum was computed using a step in frequency of Δw = 0.67 cm−1. To remove noise, the spectrum was smoothed by locally averaging over nine data points. This provided an average value of the power spectrum at the frequency of the oscillator (see Fig. 3).
Observing the exponential decay of the power spectrum over the whole frequency region, we note that in the high frequency region above 600 cm−1, there is some structure coupled to the exponential decay. The peaks at the frequencies of ∼1340 and 1450 cm−1 correspond to the H-C-H or H-C-D angle bending of Met80, respectively. The peaks at the frequencies of ∼830 and 920 cm−1 are associated with the S-C bond stretch and angle bending of Met80, respectively. The peak at a frequency of ∼690 cm−1 is due to a torsional mode of the heme. We conclude that the vibrational modes strongly coupled to the C-D oscillator are in close proximity to the C-D bond.
Normal mode calculations—searching for mechanism
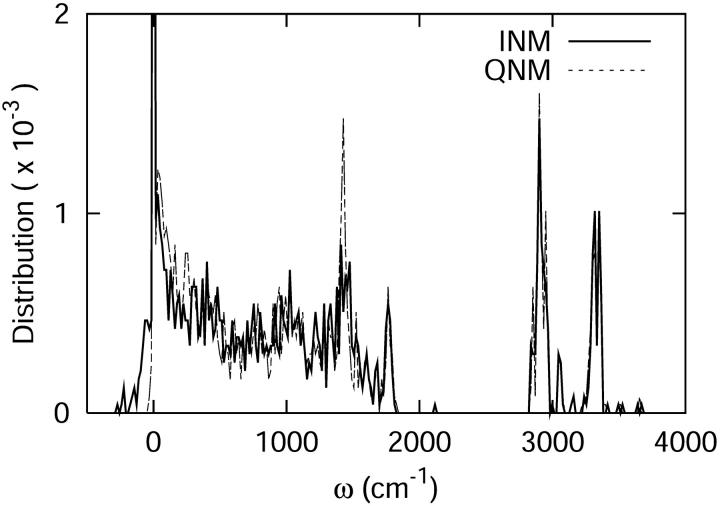
The densities of states determined using the QNM and INM formalisms are shown in Fig. 4. As expected, the INM spectrum possesses imaginary modes, plotted here in the standard way along the negative frequency axis. The imaginary modes make up ∼5% of D(ω). That fraction of imaginary modes is similar in magnitude to results for crystals or ordered liquids such as liquid water (Cho et al., 1994) and other proteins (Straub et al., 1994). In both spectra, there is an obvious separation of states—a transparent region—between 2000 and 2800 cm−1. That frequency separation effectively isolates the C-D vibration from the remainder of the system. As a result, the C-D vibrational coupling to the system is weak.
FIGURE 4.
The vibrational density of states of the cytochrome c protein, as defined by Eq. 22 derived from quenched normal mode, QNM, and instantaneous normal mode, INM, calculations.
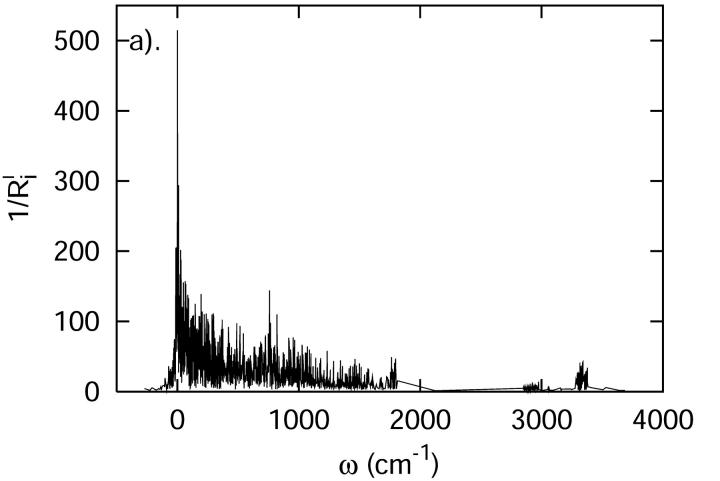
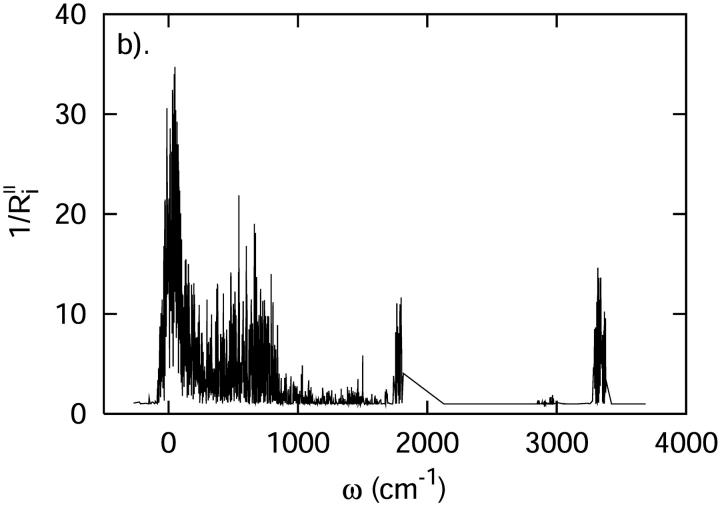
Fig. 5 displays the inverse participation ratios for the INM calculations. The low frequency modes are delocalized with the lowest frequency modes corresponding to translational and rotational motion. With increasing frequency, the modes become more localized. Modes from 2000 to 3000 cm−1 involve only 1–2 residues. At higher frequencies, we see a decrease in localization due to the numerous O-H and N-H stretching modes. However, the overall degree of localization is still considerable.
FIGURE 5.
The inverse participation ratios determined from the eigenvectors of the QNM and INM calculations. The results may be interpreted as, a, the number of degrees of freedom participating in a given mode, or b, the number of residues or water molecules participating in a given mode.
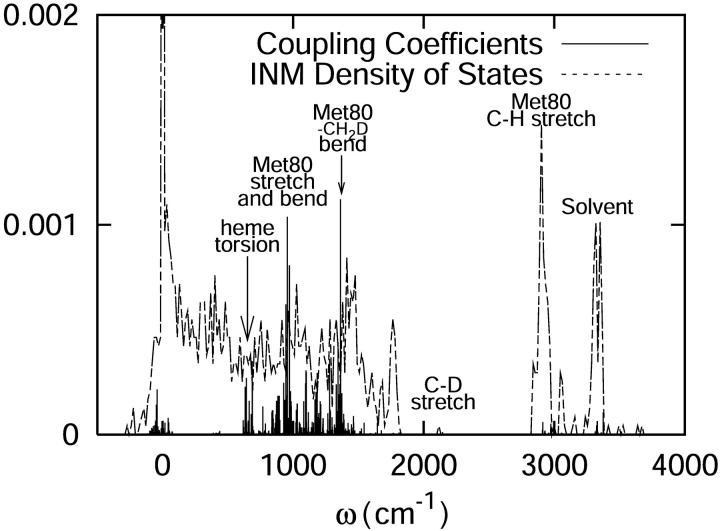
The distribution of the square of the coupling constants found in Eq. 22, also called the influence spectrum, is shown in Fig. 6. The most noticeable peak is at a frequency of ∼1400 cm−1 corresponding to the angle bending with Met80 playing a key role. The second most prominent peak can be seen in the region of ∼1000 cm−1. Those modes are associated with the bond stretching and angle bending motions still predominantly localized on the Met80. The region near ∼700 cm−1 contains torsional motion of the heme. The residues that affect the C-D stretch are those that have direct through-bond interaction with the S atom in Met80-Tyr67, the heme, and of course, Met80 itself. Other residues that are within a short distance of the C-D bond include Phe82 and a water molecule. Although some solvent coupling is evident between 3200 and 3300 cm−1, the effect appears to be minimal.
FIGURE 6.
The square of the vibrational coupling constants plotted against a backdrop of the INM density of states for cytochrome c at 300 K.
This information, combined with that from the participation ratios shown in Fig. 5, suggests that the principal modes responsible for C-D relaxation in cytochrome c are highly localized. Large-scale collective motions are relatively unimportant in the relaxation process. The residues most strongly involved in the relaxation tend to be those in close proximity to the C-D oscillator.
Estimates of quantum correction factors from semiclassical theory
Our analysis suggests that the dominant mechanism for the C-D vibrational relaxation is the transfer of one quantum from the C-D stretch to one quantum of a well-coupled angle bending mode of Met80, with the remainder being absorbed either by one quantum of a low-frequency harmonic vibration or by translations and/or rotations.
The semiclassical quantum corrections described in the subsection called Computational Methods for Computing T1 may be used to construct an overall quantum correction factor for these multiphonon relaxation mechanisms, as we show in Table 1. For a one-phonon resonant energy transfer from the C-D stretch ω = 2130 cm−1 to a harmonic bath mode, the quantum correction factor would be Q = QH(ω) = 10.23. If the quantum of C-D vibrational energy, ω = 2130 cm−1, is accepted by an angle bending mode ωi = 1450 cm−1 and a lower frequency bath vibration ω − ωi = 680 cm−1, the quantum correction would be QH(ωi)QH(ω − ωi) = 23.70. Alternatively, if the quantum of C-D vibrational energy is transferred to an angle bending mode of Met80 at ωi = 1450 cm−1 with the remaining energy being accepted by translation/rotation modes of the bath, the hybrid harmonic/Schofield correction predicts Q = QH(ωi)QHS(ω − ωi) = 29.15. It is very encouraging that there is relatively little variation in the magnitude of the various quantum correction factors. It should be noted that it is unlikely that vibrational relaxation occurs via a 1:1 Fermi resonance within a bath vibration, as the use of the QH(ω) quantum correction factor implies. However, that value is included as it is equivalent to the estimate of the classical theory derived from the generalized Langevin equation. Therefore, we interpret the value of T1 derived using Q = QH(ω) to be the standard, uncorrected classical estimate of the relaxation time.
TABLE 1.
Quantum-correction factor for vibrational relaxation of a C-D stretch in the terminal methyl group of Met80 in cyt c based on different mechanism
| QH(ω) | QH(ωi)QH(ω − ωi) | QH(ωi)QHS(ω−ωi) | |
|---|---|---|---|
| QCF | 10.23 | 23.70 | 29.15 |
| QCF/QH(ω) | 1 | 2.3 | 2.8 |
It is helpful to compare our predicted timescales for the vibrational population relaxation of the C-D stretch with observed timescales for vibrational relaxation of selected modes in other proteins. This predicted timescale for C-D relaxation is similar to that for CO relaxation in the A-states of myoglobin (17 ± 2 ps) (Owrutsky et al., 1995) and rests between the generic fast relaxation of the amide I vibration (roughly 1.2 ps) (Mizutani and Kitagawa, 2002) and the far slower relaxation of CO in the B-states of myoglobin (600 ± 150 ps) (Sagnella et al., 1999).
Testing the assumption of a harmonic bath
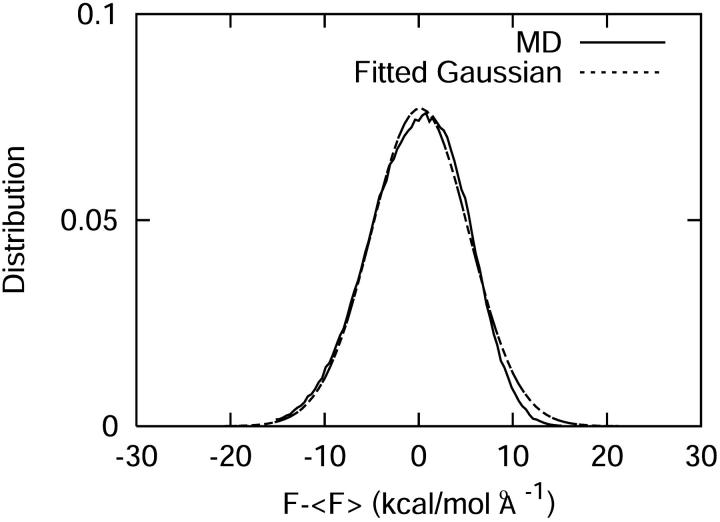
A simple test to probe the validity of the harmonic approximation in treating the bath is to analyze the distribution of the fluctuating force along the bond. If the harmonic approach is appropriate, the distribution should be Gaussian. The result of this test is shown in Fig. 7, in which a Gaussian fit to the data has been overlayed. As can be seen, the data do exhibit a strict Gaussian character and are reasonably approximated by a Gaussian distribution shifted to the right by only 0.15 kcal/(mol Å).
FIGURE 7.
Comparison of the distribution of the fluctuating force with a Gaussian fitting function. The Gaussian fit was performed about the center of the original distribution and not about the zero.
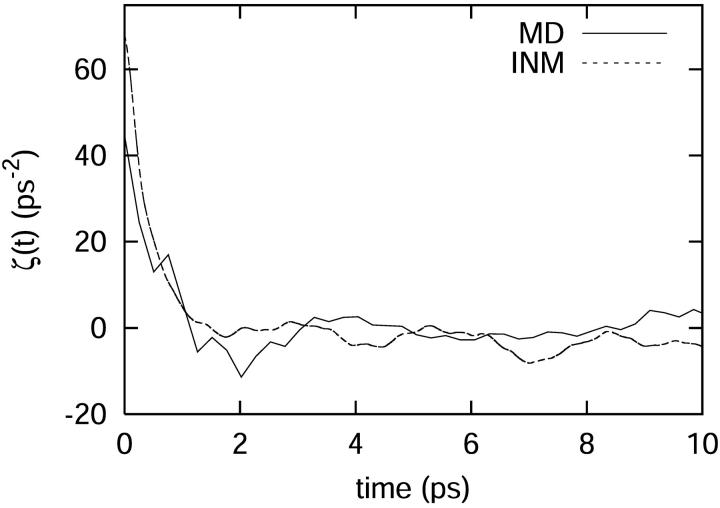
Another test of the harmonic approximation is to use INM theory to calculate a force correlation function for our system through Eq. 20. The result is pictured in Fig. 8 and compared with the results from the MD simulation. The computed density of states shows little variation when compared between different configurations, but the influence spectra and fluctuating force autocorrelation functions vary considerably. This is in agreement with the work of Goodyear and Stratt (1996), who have demonstrated that INM friction spectra can differ significantly from configuration to configuration. This indicates that the frequencies of the bath modes are fairly constant, but the magnitude of coupling to the C-D stretch depends upon the specific configuration. To demonstrate convergence in the INM friction kernel, the INM calculations were performed for 100 different configurations from 10 independent trajectories. Considering the underlying approximations, we conclude that the INM friction kernel approximates the time dependence of the full MD trajectory average reasonably well on the picosecond timescale for the high frequency motion of the C-D stretch.
FIGURE 8.
The fluctuating force correlation function, proportional to ζ(t), derived independently from the INM and molecular dynamics calculations at 300 K.
Based on the molecular dynamics simulation, we can calculate the potential of mean force felt by the C-D bond as
 |
(26) |
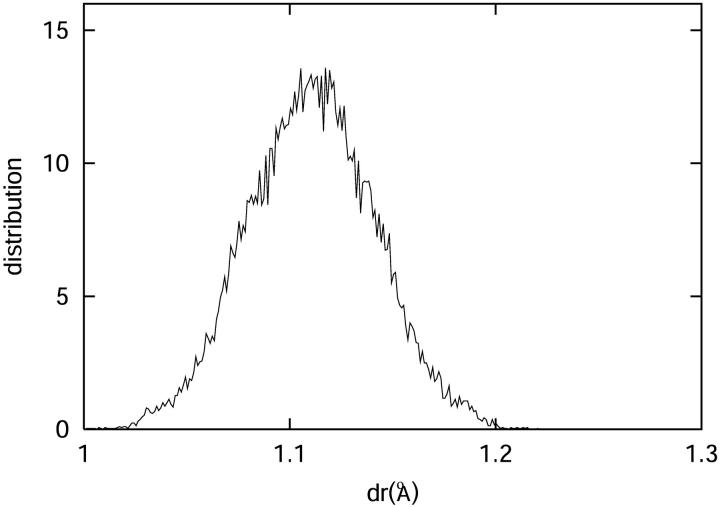
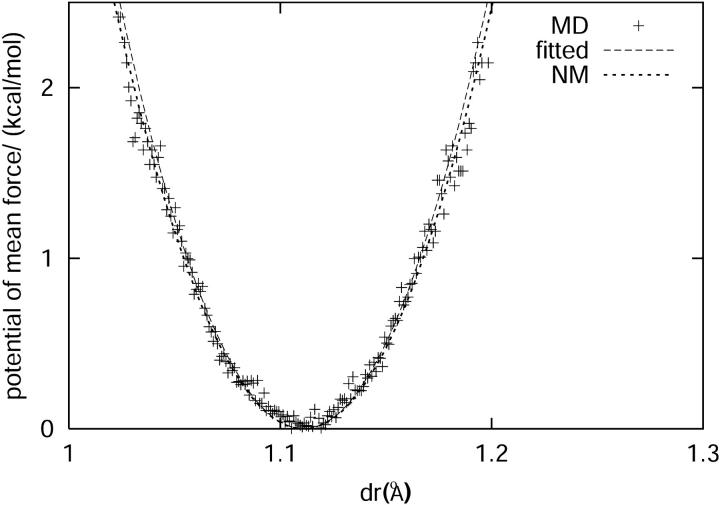
where p(r) is the probability for the C-D bond to have a bond length r. The potential of mean force can also be derived from Eq. 18 based on the harmonic approximation. VOSC(r) is the CHARMM potential energy of the C-D bond with force constant κ = 322 kcal/(mol Å2). The force constant for the coupling terms between the C-D bond and the bath modes is 10 kcal/(mol Å2). Therefore, the total force constant from the harmonic approximation is ∼312 kcal/(mol Å2) by Eq. 18. Fig. 9 shows the potential of mean force derived from molecular dynamics simulation and normal mode analysis. The force constant derived from the molecular dynamics simulation, based on a fitted function, is roughly 331 kcal/(mol Å2), which is in excellent agreement with the result of the normal mode analysis.
FIGURE 9.
(Top) The distance between the C and D atoms in the C-D oscillator during the molecular dynamics simulation. (Bottom) The potential of mean force along the C-D oscillator is depicted as crosses. A fitted function is found to be in close agreement with the predictions derived from the harmonic approximation potential function calculated from normal mode analysis (see Eq. 18).
The decomposition of the fluctuating force autocorrelation function
Further insight into the relaxation mechanism of the C-D oscillator can be gained via the decomposition of the fluctuating force autocorrelation function into contributions from the protein, heme, and solvent as
 |
(27) |
where Fprot, Fheme, and Fsolv indicate the force acting along the C-D bond due to the protein, the heme, and the solvent, respectively. The independent binary collision model (IBC) (Litovitz, 1957) has been used successfully to describe vibrational relaxation in solution. The IBC dynamical model views the events contributing to the force acting on the vibration as resulting from the separate independent collisions. In other words, the IBC model assumes that the cross correlations, although contributing to the overall fluctuating force in the time domain, have little influence on the power spectrum in the vicinity of the C-D vibrational frequency.
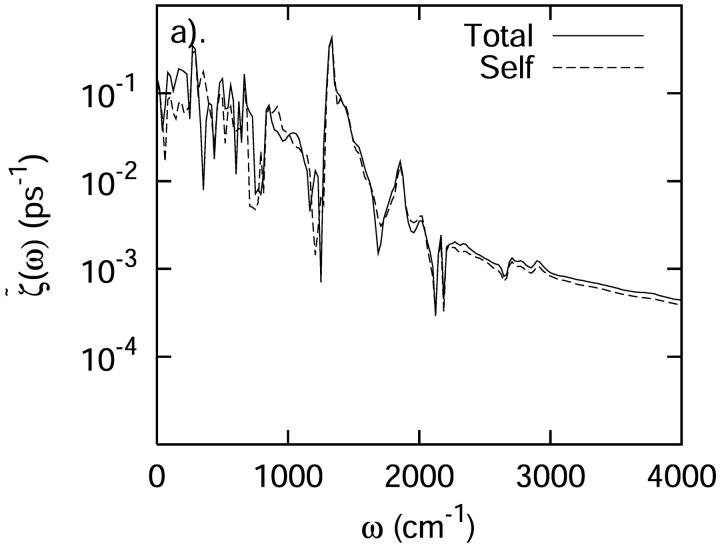
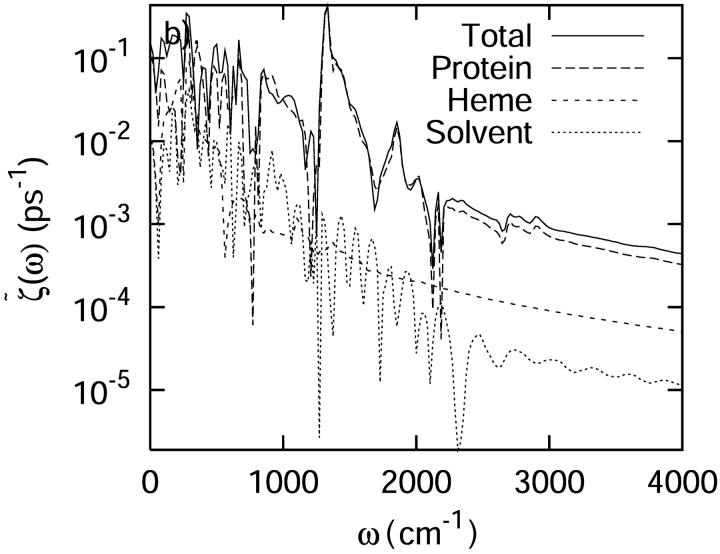
Several decompositions of the fluctuating force autocorrelation function were examined. The first involved separating the system into three segments—the protein, the heme, and the solvent. From Fig. 10, it is obvious that the “self” terms of the protein, heme, and solvent closely reproduce the total spectrum. Any cooperative interactions between these groups is negligible, with the exception of contributions due to modes in the very low frequency region <500 cm−1. In the low frequency region, interactions between these three different segments may influence the vibrational relaxation rate and mechanism of C-D oscillator.
FIGURE 10.
A separate analysis of the protein, heme, and solvent contributions to the total power spectrum of the autocorrelation function of the force acting on the C-D bond at 300 K. (a) The total spectrum and the spectrum obtained by decomposing the force autocorrelation function into separate protein, heme, and solvent contributions and ignoring cross correlation. (b) The spectrum of the separate components of the protein, heme and solvent. All spectra have been smoothed for visual clarity.
The second decomposition in terms of the contributions of individual residues was performed to aid in defining the mechanism of the vibrational relaxation. Based on the fluctuating random force acting on the C-D bond contributed by each residue, it was found that residues Met80, Phe82, Tyr67, and the heme play dominant roles in the relaxation of the C-D stretch. Solvent effects cannot be ignored.
Romesberg and co-workers have studied the vibrational frequency of the −CD3 group in cytochrome c (Chin et al., 2001). They have argued that these vibrations are sensitive to hyperconjugative interactions with S-based orbitals. Such interactions depend on electronic properties of the S atom, not on the overall electrostatic field at Met80. The short-range interactions are fixed by through-bond interactions, such as the strength of the Fe-S bond or the strength and number of hydrogen bonds to other protein residues, rather than by through-space interaction.
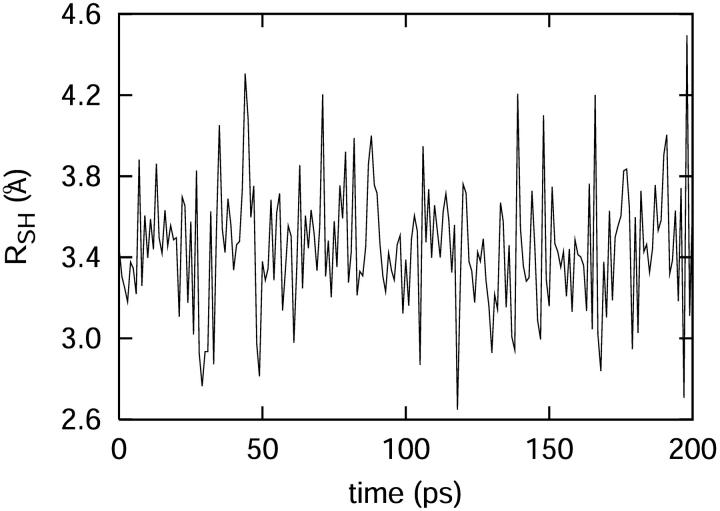
For Tyr67, there exists a hydrogen bond between the S atom and the H atom in the hydroxide group in Tyr67. As shown in Fig. 11, we can see the distance between the S atom and the H atom in the hydroxide group is usually <4 Å, which demonstrates the existence of the hydrogen bond. However, we find the distance dependence is also important. The Phe82 is the closest residue to the C-D bond besides Met80 itself. The average distance between the center of the C-D bond and that of Phe82 is only 4.1 Å. The high electronic density at the phenyl group in Phe82 may also influence the vibration of the C-D bond.
FIGURE 11.
The distance between S in Met80 and H of the hydroxyl group of Tyr67, demonstrating that there is a hydrogen bond between those key groups throughout the simulation.
Finally, interaction with solvent may also play an important role. The average distance between the center of the C-D bond and that of the closest water molecule is only 3.2 Å. Therefore, we argue that both through-bond and through-space interactions are important for the vibrational energy relaxation of the C-D bond.
The fluctuating frequency autocorrelation function calculated from INM theory
 |
(28) |
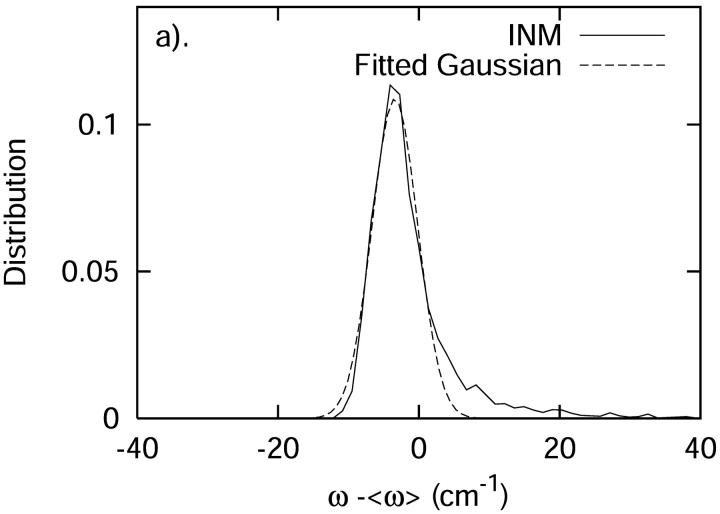
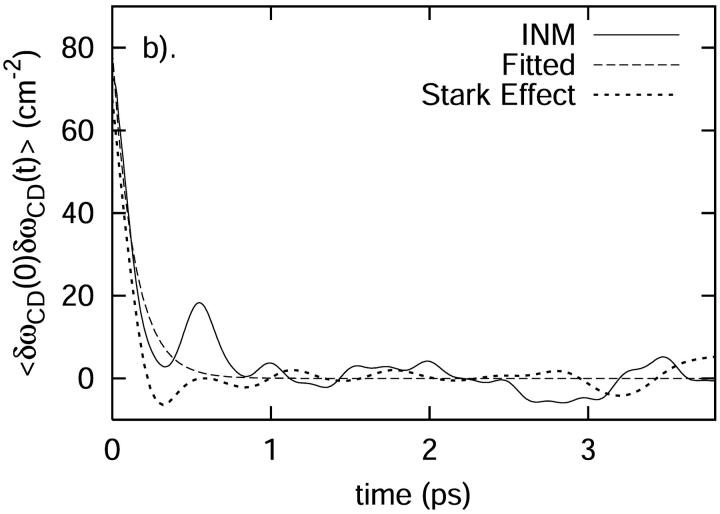
where δωCD(t) = ωCD(t) − 〈ωCD〉, is shown in Fig. 12 b. Based on the fitted exponential decay function, the time constant T is 0.14 ps. The distribution of δωCD is shown in Fig. 12 a. As we can see from this figure, the frequency is slightly blue-shifted. Using Kubo's theory (Kubo, 1963, 1969), the correlation time τc is defined by
 |
(29) |
where Δω is the variance characterized by
 |
(30) |
From Fig. 12 a, Δω is found to be 3.40 cm−1 through the fitted Gaussian. From Fig. 12 b, τc is calculated as 0.06 ps through Eq. 29. Therefore,  . In such a fast modulation case, the spectrum will show the phenomena of motional narrowing and the associated line shapes should be sharp with a Lorentzian form (Kubo, 1963, 1969).
FIGURE 12.
(a) The distribution of the fluctuating frequency δωCD plotted against the fit to a Gaussian function of frequency. (b) The fluctuating frequency autocorrelation function plotted against the fit to an exponential function of time. Plotted for comparison is the prediction based solely on the modulation in the C-D frequency through a Stark effect.
Both van der Waals interaction and external electric field will induce the vibrational frequency shift on the C-D bond. The van der Waals interaction results in a frequency shift of the center of the frequency distribution, while the electric field leads to the detailed inhomogeneity in the spectrum (Ma et al., 1997). If we assume that the frequency shift is primarily induced by a Stark shift due to the electric field in the protein, then
 |
(31) |
where h is Planck's constant and  is the difference in the dipole of the ground and first excited vibrational states. Therefore, the frequency autocorrelation function can be rewritten as
 |
(32) |
where  is the unit vector along the C-D bond. To aid in comparison, the frequency autocorrelation function, C(t) from Eq. 32, is calculated without the pre-factor Δμ2/h2 and is then scaled by a factor 0.003. The result is shown in Fig. 12 b. The frequency autocorrelation function calculated from the Stark effect approximates that from the normal mode analysis based on Eq. 28 reasonably well. The relaxation of the INM frequency modulation is on the same time scale as the modulation due to the Stark shift.
SUMMARY AND CONCLUSIONS
This work has investigated several aspects of vibrational relaxation of a C-D bond in the terminal methyl group of residue Met80 in cytochrome c. Inspired by the innovative studies of Romesberg and co-workers (Chin et al., 2001), who have demonstrated the ability to use selective deuterium labels of aliphatic carbons in combination with femtosecond spectroscopy to probe protein structure and dynamics, we have demonstrated how molecular dynamics simulation may be used to model and interpret vibrational relaxation from such C-D stretching modes. The data suggest that a harmonic treatment of the surrounding protein and solvent is a reasonable approximation for protein dynamics on the timescale of the C-D stretch vibrational relaxation. Using classical and semiclassical theories, we find that the vibrational population relaxation time should occur on a timescale of 14–40 ps. Considering the underlying approximations, the INM friction kernel provides a reasonable approximation to the time dependence of the full MD trajectory. A detailed analysis led to the identification of key residues in the relaxation process—residues that have direct through-bond interaction with the S atom in Met80—Tyr67, the heme, and of course, Met80 itself, or those groups within a short distance of the C-D bond, Phe82, and water molecule. These results demonstrate that our modeling of the relaxation dynamics of selected vibrational modes may be analyzed using a combination of molecular dynamics calculations, semiclassical theory for timescales, and normal mode analysis for energy pathways.
An important conclusion of this work is that our results suggest that the semiclassical quantum corrections to the estimates of T1 fall within a factor of 3. This close agreement was also noted previously by Skinner and co-workers in their analysis of vibrational relaxation of photolyzed CO in the heme pocket of myoglobin (Skinner and Park, 2001). They found that quantum corrections led to a variation in estimates of T1 by a factor of 2–4, consistent with our results in this study. In contrast, applications of such theories to liquid state systems has often led to substantial differences between various semiclassical estimates (Skinner et al., 2001; Egorov et al., 1999). These results suggest that vibrational relaxation of selected modes in proteins are well-suited for analysis by semiclassical theories. This success may be due to the response of the protein bath which is well-approximated as harmonic on the timescales of interest. It is also possible that the consistency in these predictions is due to the fact that the broad density of vibrational states of the protein guarantees that there will be a bath vibrational mode, in close proximity, to serve as a principal doorway mode and accept a majority of energy from the relaxing oscillator.
Acknowledgments
We thank the referee for helpful comments.
We are thankful for the generous support of this research by the National Science Foundation (CHE-9975494).
References
- Anfinrud, P. A., C. Han, and R. M. Hochstrasser. 1989. Direct observations of ligand dynamics in hemoglobin by subpicosecond infrared spectroscopy. Proc. Natl. Acad. Sci. USA. 86:8387–8391. [DOI] [PMC free article] [PubMed] [Google Scholar]
- Asplund, M. C., M. T. Zanni, and R. M. Hochstrasser. 2000. Two-dimensional infrared spectroscopy of peptides by phase-controlled femtosecond vibrational photon echoes. Proc. Natl. Acad. Sci. USA. 97:8219–8224. [DOI] [PMC free article] [PubMed] [Google Scholar]
- Augspurger, J. D., C. E. Dykstra, and E. Oldfield. 1991. Correlation of carbon-13 and oxygen-17 chemical shifts and the vibrational frequency of electrically perturbed carbon monoxide: a possible model for distal ligand effects in carbonmonoxyheme proteins. J. Am. Chem. Soc. 113:2447–2451. [Google Scholar]
- Bader, J. S., and B. J. Berne. 1994. Quantum and classical relaxation rates from classical simulations. J. Chem. Phys. 100:8359–8366. [Google Scholar]
- Brooks, B. R., R. Bruccoleri, B. Olafson, D. States, S. Swaninathan, and M. Karplus. 1983. CHARMM: a program for macromolecular energy, minimization and dynamics calculations. J. Comp. Phys. 4:187–217. [Google Scholar]
- Bushnell, G. W., G. V. Louie, and G. D. Brayer. 1990. High-resolution three-dimensional structure of horse heart cytochrome c. J. Mol. Biol. 214:585–595. [DOI] [PubMed] [Google Scholar]
- Chin, J. K., R. Jimenez, and F. E. Romesberg. 2001. Direct observations of protein vibrations by selective incorporation of spectroscopically observable carbon-deuterium bonds in cytochrome c. J. Am. Chem. Soc. 123:2426–2427. [DOI] [PubMed] [Google Scholar]
- Chin, J. K., R. Jimenez, and F. E. Romesberg. 2002. Protein dynamics and cytochrome c: correlations between ligand vibration and redox activity. J. Am. Chem. Soc. 124:1846–1847. [DOI] [PubMed] [Google Scholar]
- Cho, M., G. R. Fleming, S. Saito, I. Ohmine, and R. M. Stratt. 1994. Instantaneous normal mode analysis of liquid water. J. Chem. Phys. 100:6672–6683. [Google Scholar]
- Egorov, S. A., K. F. Everitt, and J. L. Skinner. 1999. Quantum dynamics and vibrational relaxation. J. Phys. Chem. A. 103:9494–9499. [Google Scholar]
- Frauenfelder, H., and B. H. McMahon. 2001. Relaxations and fluctuations in myoglobin. Biosystems. 62:3–8. [DOI] [PubMed] [Google Scholar]
- Frenkel, D., and B. Smit. 2001. Understanding Molecular Simulation: From Algorithms to Applications, 2nd Ed. Academic Press, San Diego.
- Genberg, L., Q. Bao, S. Gracewski, and R. J. D. Miller. 1989. Picosecond transient thermal phase grating spectroscopy: a new approach to the study of vibrational energy relaxation processes in proteins. Chem. Phys. 131:81–97. [Google Scholar]
- Goodyear, G., and R. M. Stratt. 1996. The short-time intramolecular dynamics of solutes in liquids. I. An instantaneous-normal-mode theory for friction. J. Chem. Phys. 105:10050–10071. [Google Scholar]
- Goodyear, G., and R. M. Stratt. 1997. The short-time intramolecular dynamics of solutes in liquids. II. Vibrational population relaxation. J. Chem. Phys. 107:3098–3120. [Google Scholar]
- Greene, B. I., R. M. Hochstrasser, R. B. Weisman, and W. A. Eaton. 1978. Spectroscopic studies of oxy- and carbonmonoxyhemoglobin after pulsed optical excitation. Proc. Natl. Acad. Sci. USA. 75:5255–5259. [DOI] [PMC free article] [PubMed] [Google Scholar]
- Henry, E. R., W. A. Eaton, and R. M. Hochstrasser. 1986. Molecular dynamics simulation of cooling in laser-excited heme proteins. Proc. Natl. Acad. Sci. USA. 83:8982–8986. [DOI] [PMC free article] [PubMed] [Google Scholar]
- Hill, J. R., D. D. Dlott, C. W. Rella, K. A. Peterson, S. M. Decatur, S. G. Boxer, and M. D. Fayer. 1996. Vibrational dynamics of carbon monoxide at the active sites of mutant heme proteins. J. Phys. Chem. 100:12100–12107. [Google Scholar]
- Karplus, M. 2000. Aspects of protein reaction dynamics: deviations from simple behavior. J. Phys. Chem. B. 104:11–27. [Google Scholar]
- Kholodenko, Y., M. Volk, E. Gooding, and R. M. Hochstrasser. 2000. Energy dissipation and relaxation processes in deoxymyoglobin after photoexcitation in the Soret region. Chem. Phys. 259:71–87. [Google Scholar]
- Kubo, R. 1963. Stochastic Liouville equations. J. Math. Phys. 4:147–183. [Google Scholar]
- Kubo, R. 1969. A stochastic theory of line shape. Adv. Chem. Phys. 14:101–127. [Google Scholar]
- Lim, M., T. A. Jackson, and P. A. Anfinrud. 1995. Binding of CO to myoglobin from a heme pocket docking site to form nearly linear Fe-C-O. Science. 269:962–966. [DOI] [PubMed] [Google Scholar]
- Lim, M., T. A. Jackson, and P. A. Anfinrud. 1996. Femtosecond near-IR absorbance study of photoexcited myoglobin—dynamics of electronic and thermal relaxation. J. Phys. Chem. 100:12043–12051. [Google Scholar]
- Litovitz, T. A. 1957. Theory of ultrasonic thermal relaxation times in liquids. J. Chem. Phys. 26:469–473. [Google Scholar]
- Ma, J., S. Huo, and J. E. Straub. 1997. Molecular dynamics simulation study of the B-states of solvated carbon monoxymyoglobin. J. Am. Chem. Soc. 119:2541–2551. [Google Scholar]
- MacKerell, A. D., Jr., D. Bashford, M. Bellott, R. L. Dunbrack, Jr., J. D. Evanseck, M. J. Field, S. Fischer, J. Gao, H. Guo, S. Ha, D. Joseph-McCarthy, L. Kuchnir, K. Kuczera, F. T. K. Lau, C. Mattos, S. Michnick, T. Ngo, D. T. Nguyen, B. Prodhom, W. E. Reiher, III, B. Roux, M. Schlenkrich, J. C. Smith, R. Stote, J. E. Straub, M. Watanabe, J. Wiorkiewicz-Kuczera, D. Yin, and M. Karplus. 1998. All-atom empirical potential for molecular modeling and dynamics studies of proteins. J. Phys. Chem. B. 102:3586–3616. [DOI] [PubMed] [Google Scholar]
- Mizutani, Y., and T. Kitagawa. 2002. Vibrational energy relaxation of metalloporphyrins in a condensed phase probed by time-resolved resonance Raman spectroscopy. Bull. Chem. Soc. Japan. 75:623–639. [Google Scholar]
- Muench, E., and P. M. Champion. 1975. Heme proteins and model compounds. Mossbauer absorption and emission spectroscopy. Ann. NY Acad Sci. 24:142–162. [DOI] [PubMed] [Google Scholar]
- Okazaki, I., Y. Hara, and M. Nagaoka. 2001. On vibrational cooling upon photodissociation of carbonmonoxymyoglobin and its microscopic mechanism from the viewpoint of vibrational modes of heme. Chem. Phys. Lett. 337:151–157. [Google Scholar]
- Owrutsky, J. C., M. Li, B. Locke, and R. M. Hochstrasser. 1995. Vibrational relaxation of the CO stretch vibration in hemoglobin-CO, myoglobin-CO, and protoheme-CO. J. Phys. Chem. 99:4842–4846. [Google Scholar]
- Oxtoby, D. W. 1979. Hydrodynamic theory for vibrational dephasing in liquids. J. Chem. Phys. 70:2605–2610. [Google Scholar]
- Oxtoby, D. W. 1981. Vibrational population relaxation in liquids. Adv. Chem. Phys. 47:487–519. [Google Scholar]
- Park, E. S., M. R. Thomas, and S. G. Boxer. 2000. Vibrational Stark spectroscopy of NO bound to heme: effects of protein electrostatic fields on the NO stretch frequency. J. Am. Chem. Soc. 122:12297–12303. [Google Scholar]
- Rey, R., and J. T. Hynes. 1996. Energy relaxation time and pathway for HOD in liquid D2O. J. Chem. Phys. 104:2356–2368. [Google Scholar]
- Ryckaert, J. P., G. Ciccotti, and H. J. C. Berendsen. 1977. Numerical integration of the Cartesian equations of motion of a system with constraints: molecular dynamics of n-alkanes. J. Comput. Phys. 23:327–341. [Google Scholar]
- Sagnella, D. E., and J. E. Straub. 1999. A study of vibrational relaxation of B-state carbon monoxide in the heme pocket of photolyzed carboxymyoglobin. Biophys. J. 108:70–84. [DOI] [PMC free article] [PubMed] [Google Scholar]
- Sagnella, D. E., J. E. Straub, T. A. Jackson, M. Lim, and P. A. Anfinrud. 1999. Vibrational population relaxation of carbon monoxide in the heme pocket of photolyzed carbonmonoxymyoglobin: comparison of time-resolved mid-IR absorbance experiments and molecular dynamics simulations. Proc. Natl. Acad. Sci. USA. 96:14324–14329. [DOI] [PMC free article] [PubMed] [Google Scholar]
- Sagnella, D. E., J. E. Straub, and D. Thirumalai. 2000. Timescales and pathways for kinetic energy relaxation in solvated proteins: application to carbonmonoxymyoglobin. J. Chem. Phys. 113:7702–7711. [Google Scholar]
- Seeley, G., and T. Keyes. 1989. Normal mode analysis of liquid state dynamics. J. Chem. Phys. 91:5581–5586. [Google Scholar]
- Sivakolundu, S. G., and P. A. Mabrouk. 2000. Cytochrome c structure and function in mixed solvents are determined by the dielectric constant. J. Am. Chem. Soc. 122:1513–1521. [Google Scholar]
- Skinner, J. L., and K. Park. 2001. Calculating vibrational energy relaxation rates from classical molecular dynamics simulations: quantum correction factors for processes involving vibration-vibration energy transfer. J. Phys. Chem. B. 105:6716–6721. [Google Scholar]
- Skinner, J. L., K. F. Everitt, and S. A. Egorov. 2001. Vibrational energy relaxation in liquids and supercritical fluids. Prac. Spec. 26:675–694. [Google Scholar]
- Straub, J. E., A. Rashkin, and D. Thirumalai. 1994. Dynamics in rugged energy landscapes with applications to the S-peptide and ribonuclease A. J. Am. Chem. Soc. 116:2049–2063. [Google Scholar]
- Tuckerman, M., B. J. Berne, and G. J. Martyna. 1992. Reversible multiple timescale molecular dynamics. J. Chem. Phys. 97:1990–2001. [Google Scholar]
- Verlet, L. 1967. Computer “experiments” on classical fluids. I. Thermodynamical properties of Lennard-Jones molecules. Phys. Rev. 159:98–103. [Google Scholar]
- Vogel, R., and F. Siebert. 2000. Vibrational spectroscopy as a tool for probing protein function. Cur. Op. Chem. Bio. 4:518–523. [DOI] [PubMed] [Google Scholar]
- Whitnell, R. M., K. R. Wilson, and J. T. Hynes. 1992. Vibrational relaxation of a dipolar molecule in water. J. Chem. Phys. 96:5354–5369. [Google Scholar]
- Zewail, A. H. 1996. Recent progress in studies of dynamics and control reactions and their transition states. J. Phys. Chem. 100:12701–12712. [Google Scholar]
- Zwanzig, R. 1961. Theory of vibrational relaxation in liquids. J. Chem. Phys. 34:1931–1935. [Google Scholar]
- Zwanzig, R. 1973. Nonlinear generalized Langevin equation. J. Stat. Phys. 9:215–220. [Google Scholar]


