Abstract
Microchannels (40-μm wide, 10-μm high, 10-mm long, 70-μm pitch) were patterned in the silicone elastomer, polydimethylsiloxane on a microscope coverslip base. Integrated within each microchamber were individually addressable stimulation electrodes (40-μm wide, 20-μm long, 100-nm thick) and a common central pseudo-reference electrode (60-μm wide, 500-μm long, 100-nm thick). Isolated rabbit ventricular myocytes were introduced into the chamber by micropipetting and subsequently capped with a layer of mineral oil, thus creating limited volumes of saline around individual myocytes that could be varied from 5 nL to 100 pL. Excitation contraction coupling was studied by monitoring myocyte shortening and intracellular Ca2+ transients (using Fluo-3 fluorescence) . The amplitude of stimulated myocyte shortening and Ca2+ transients remained constant for 90 min in the larger volume (5 nL) configuration, although the shortening (but not the Ca2+ transient) amplitude gradually decreased to 20% of control within 60 min in the low volume (100 pL) arrangement. These studies indicate a lower limit for the extracellular volume required to stimulate isolated adult cardiac myocytes. Whereas this arrangement could be used to create a screening assay for drugs, individual microchannels (100 pL) can also be used to study the effects of limited extracellular volume on the contractility of single cardiac myocytes.
INTRODUCTION
Cell-based assays are powerful tools used to screen libraries of chemical compounds for new drug candidates (McConnell et al., 1992, Taylor and Walt, 2000, Taylor et al., 2001). In general, although the use of such assays to screen functional properties of new drugs has a number of technical advantages, it is time-consuming and often requires specialized training (Dixon et al., 2000). These arguments are particularly pertinent to the study of adult mammalian heart cells, where the screening for new inotropic compounds or the identification of harmful side effects of existing drugs would benefit enormously from a simplified assay system.
A number of investigators have focused on the development and use of microsystems to provide a simplified format for single cell assays (Cooper, 1999; Hosokawa et al., 1999; Cannon et al., 2000; Li et al., 2001; LaVan et al., 2002; Bratten et al., 1998; Cai et al., 2001) including the development of methods for the extracellular detection of the membrane potential on microelectrode arrays (Israel et al., 1984; Connolly et al., 1990; Gilchrist et al., 2001), or transistor arrays (Sprössler et al., 1999; Parak et al., 2000; Ingebrandt et al., 2001). However, the monitoring of excitation-contraction coupling of adult mammalian ventricular myocytes requires regular electrical stimulation. Currently, a noninvasive method of field stimulation involves the use of large extracellular electrodes made of noble metals, such as platinum. Under these circumstances, the effect of the extracellular electrical field on the excitation contraction coupling has been extensively studied in a number of cell models (Tung and Borderies, 1992; Fishler et al., 1996) as well as in isolated cardiomyocytes (Tung et al., 1991; Knisley et al., 1993; Cheng et al., 1999; Gomes et al., 2001).
In this article the properties of the design and manufacture of a microchamber array are described that allows single adult cardiac myocytes to be continuously field stimulated via planar electrodes within small volumes. Details of the optimal electrode arrangement, stimulus characteristics, and minimum bath volume are given to allow the development of an array of 2 × 6 microchannels, each containing individually addressable cardiac myocytes. This design can also be used to study the effects of stimulating single cardiac myocytes within a limited extracellular volume, a situation that simulates the metabolic conditions during myocardial ischemia. Importantly, and as a direct consequence of the process of miniaturization, it is possible to control the potentials required to promote field stimulation, and thereby limit the electrogeneration of potentially toxic by-products.
MATERIALS AND METHODS
Device fabrication
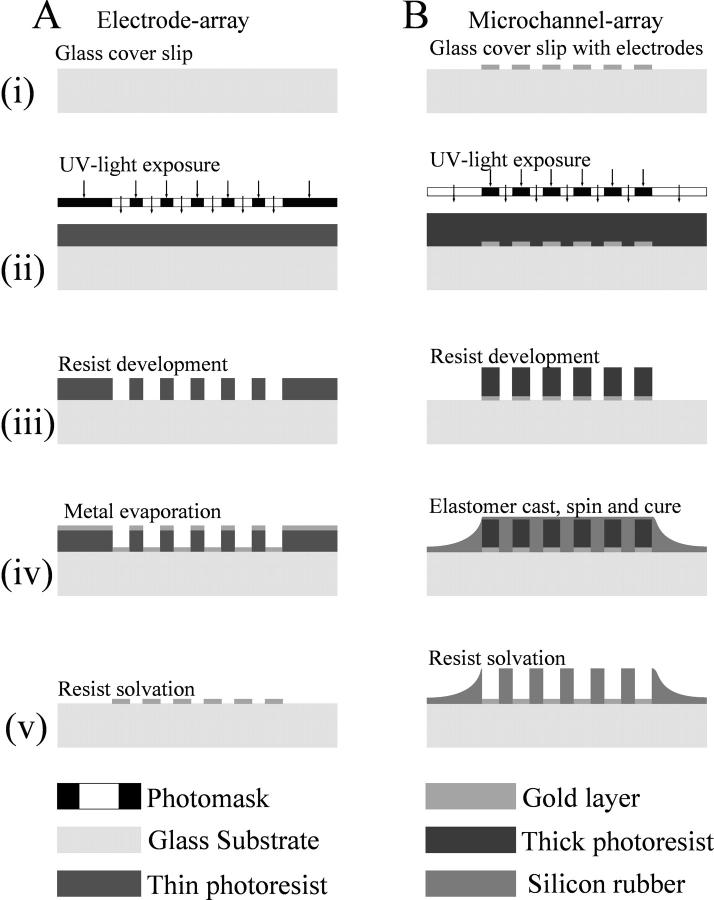
Microscope glass coverslips (No. 1, 0.13–0.17-mm thickness) were used as the substrate to allow the recording of the intra- and extracellular fluorescence as well as cellular morphology with oil and water immersion lenses (thereby enabling the use of lenses with a high numerical aperture and a low working distance of ∼300 μm). The microfabrication processes, outlined in Fig. 1, were based on adapting new protocols from standard photolithography, metal deposition, liftoff, and polymer-molding techniques.
FIGURE 1.
Schematic diagram outlining the fabrication processes of the array of the electrodes (A) and the array of the microchannels (B). The height of the channels was defined by the thickness of the patterned photoresist film used as a master for replica molding of PDMS (B, iii). PDMS was cast against the master and the cured polymer was thoroughly washed in acetone to remove all residual resist and to clear the surface of the microelectrodes (B, v). Without the support of the photoresist, the thin film of PDMS covering the microchannels collapsed and was easily washed off. The PDMS film covering the bulk electrodes served as an insulating layer to avoid short circuits of the leads through buffer spill.
The pattern for the microelectrodes and that for the microchannels were both designed using AutoCAD and were produced as two chrome-coated maskplates, using a Philips electron beam writer (Philips Electronics UK, London). To photolithographically pattern the microelectrode array, the coverslips (24 × 40 mm, Fig. 1 A, ix) were first spin-coated with the thin positive photoresist S1818 at 4000 rpm, baked in the oven at 90°C for 30 min with an intermediate 15-min soak in chlorobenzene, and were then exposed to ultraviolet light, through the appropriate photomask (Fig. 1 A, ii). The microelectrode array was then formed by the sequential electron beam-assisted deposition of an adhesive under-layer of 10 nm titanium and an electrochemically stable overlayer of 100 nm gold (Fig. 1 A, iv). The microelectrode structures were realized by lifting off unexposed metal-coated photopolymer (Fig. 1 A, v). Visual inspection of the quality of the metal pattern was carried out using a 20× lens on an upright light microscope.
The microelectrode arrays were subsequently modified with a lithographically-formed polydimethylsiloxane (PDMS) suprastructure, which defined the micron-scale chambers, and which was produced accordingly (Fig. 1 B): a thick positive resist (AZ 4562) was first spun at 1300 rpm to produce an ∼10-μm-thick photoresist layer, which was baked in the oven at 90°C for 30 min. The appropriate (microchannel) photomask was aligned to the microelectrodes on a mask aligner and the pattern was transferred into the photoresist (Fig. 1 B, ii). After development, the arrays were spin-coated at 10,000 rpm with a 1:4 dilution of PDMS in toluene and baked in the oven at 120°C for ∼2 min to cure the PDMS (Fig. 1 B, iv). The PDMS was thereby molded against a photoresist master and the whole assembly was thoroughly washed in acetone. This latter step removed all residual resist from the microchannels and from the surface of the microelectrodes. Without the support of the photoresist, the thin film of PDMS covering the microchannels collapsed and was easily washed off. The PDMS film covering the bulk electrodes served as an insulating layer to avoid short circuits of the connecting leads through buffer spill.
To fill the channels with the aqueous buffer solution, the hydrophobic surface of PDMS was wetted with ethanol, which was gradually replaced by water. After washing the microchannels with an appropriate buffer solution, they were then covered with a layer of mineral oil to avoid evaporation. The PDMS film not only served as an insulating layer to electrically separate the leads between the bonding pads and the microelectrodes but also helped to direct the cells into their chambers (see later). The bonding pads on the microelectrode array were wire-bonded to the pads on the PCB board with gold wires (200-μm thick and ∼10-mm long). A rectangular cutout hole in the PCB board allowed for microscopic imaging using transillumination. The assembled device was mounted on the x,y stage of an inverted microscope and the electrodes connected to the multiplexed stimulator with a 30-lead ribbon cable.
Cell isolation
Hearts were removed from terminally anaesthetized rabbits (1 mg kg−1 Euthatol). Myocytes were isolated from the left ventricle by perfusion with collagenase solution (Eisner et al., 1989) and kept in Base Krebs Solution, containing 120 mM NaCl, 20 mM sodium n-hydroxyethylpiperazine-n′-2-ethane sulphonic acid, 5.4 mM KCl, 0.52 mM NaH2PO4, 3.5 mM MgCl2, 6H2O, 20 mM taurine, 10 mM creatine, 11.1 mM glucose, 0.1% BSA, and 0.1 mM CaCl2, pH-adjusted to 7.4 with 100 mM NaOH. Calcium-tolerant ventricular myocytes were field-stimulated with macroscale platinum electrodes at 0.5 Hz (isolated stimulator, Digitimer, Welwyn Garden City, UK). Unless otherwise stated, all chemicals were obtained from Sigma-Aldrich (Dorset, UK).
Myocyte selection
Individual shortening adult ventricular myocytes were identified in a cell suspension stimulated with macroelectrodes, and were transferred to the microarray on the basis of several criteria—namely, that they responded faithfully to the low amplitude stimulus (5 V/cm) with regular and uniform shortening; that they had regular and clearly defined striation patterns with no obvious signs of damage in the intercalated disc regions; and were 20–30-μm wide and 140–180-μm long. Cells were initially pipetted into a microdroplet on top of the microarray by means of a capillary connected to a syringe pump. Removing the excess of fluid from the hydrophobic PDMS-surface guided the myocytes into the cavity of the microchannel between the electrodes (Fig. 2).
FIGURE 2.
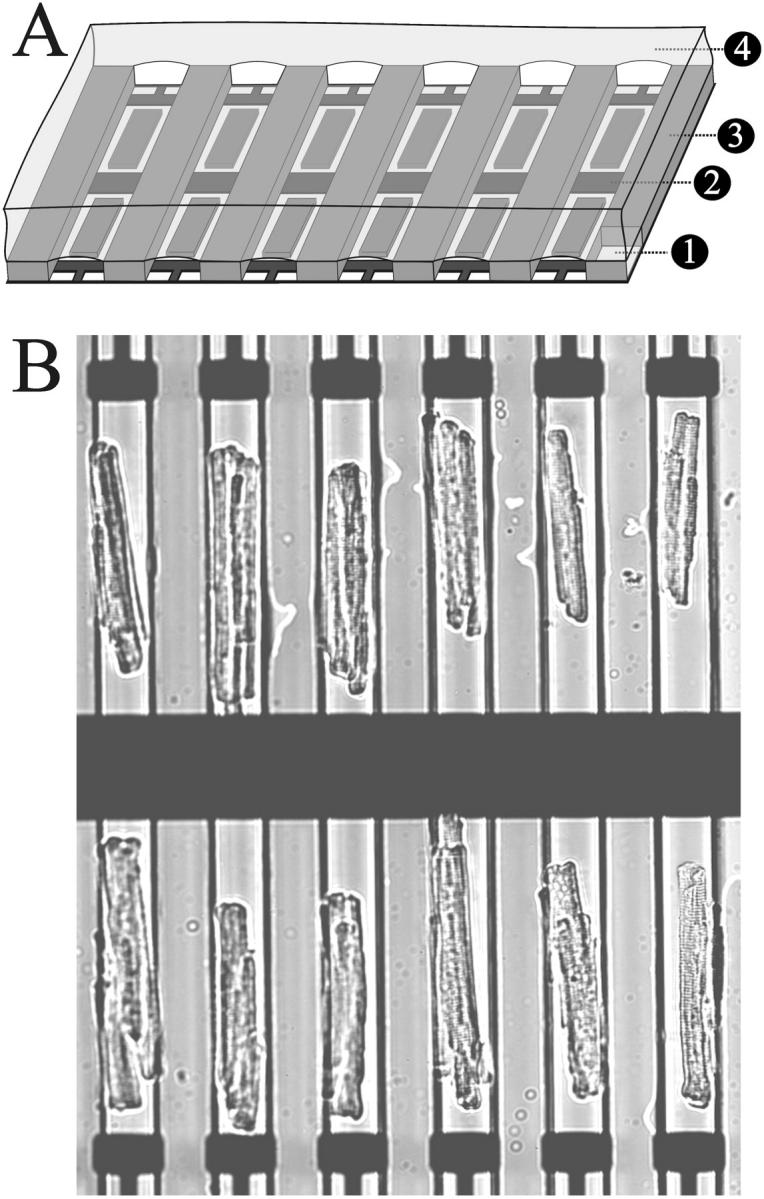
(A) Schematic diagram illustrating the different layers of the microfabricated array: glass coverslip (1), gold electrodes (2), PDMS microchannel (3), and mineral oil (4). (B) A micrograph of an array of adult ventricular myocytes aligned to the microelectrodes by means of the PDMS microchannels. The field of view shown could be illuminated with a light source for fluorophore excitation and imaged with a fast low light camera through a high NA (0.9) 20× lens. This format thus has the potential to record Ca2+ transients from all the cells in the array simultaneously.
Geometry of microelectrode arrays
The reported field strength required to electrically stimulate ventricular cardiomyocytes are in the range of 5–50 V/cm (Gomes et al., 2001). However the use of voltages >1 V leads to local electrolysis in proximity to the electrode resulting in the generation of ionic species that can change the pH of the bathing solution. (Fig. 4 A). By using a microsystems approach, fields of the order of 25 V/cm can be readily achieved across a cardiac myocyte by applying a voltage of 0.5 V across two microelectrodes, placed 200 μm apart (Fig. 4 B). Using standard photolithography, metal deposition, and liftoff techniques described elsewhere (Bratten et al., 1998, Cai et al., 2001) a variety of devices were produced in which the distance between the electrodes was precisely controlled. The geometry of the electrodes was always such that it enabled an average sized ventricular myocyte (∼160 μm in length, 25 μm in width), to be placed between the two stimulating electrodes.
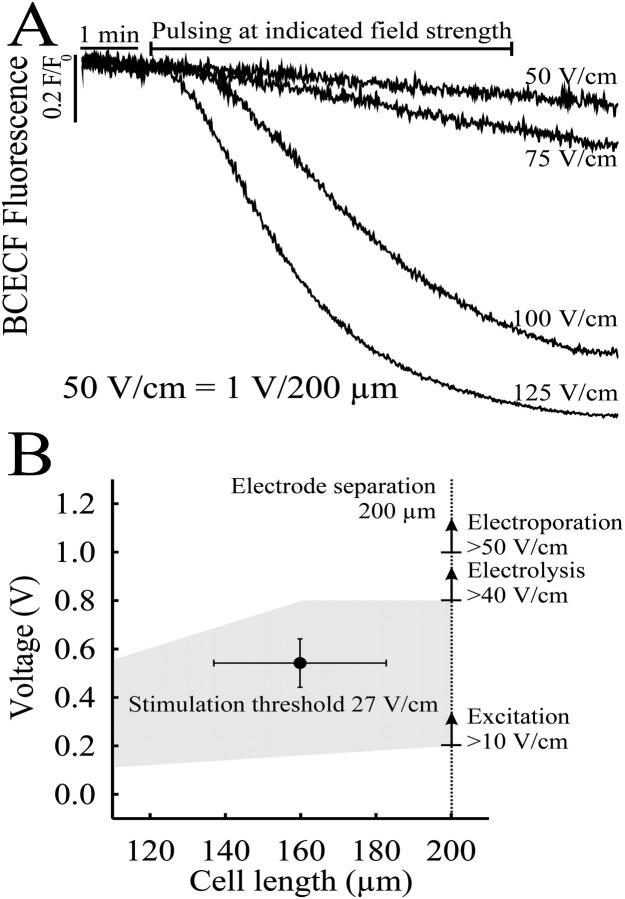
FIGURE 4.
(A) Time course of the pH change in the 100-pL bath during a 10-min pulse train at field strength above the threshold for electrical stimulation of adult ventricular myocytes. The pH-sensitive fluorochrome BCECF was added to the saline buffered with 1 mM HEPES and excited every 200 ms for 5 ms to avoid bleaching. The change in emission was related to the initial emission and plotted against time. Pulses of 1-V amplitude applied to the stimulating electrode which was separated from the reference electrode by a 200-μm gap resulted in 50-V/cm field strength. Due to the limited diffusion in the pL volume, the pH did not recover from the drop caused by electrolysis at higher field strength (>75 V/cm). (B) The average field strength for suprathreshold stimulation was calculated to 27 V/cm ± 10 V/cm (n = 6). The shaded area indicates the range of field strengths which could possibly be used to continually pace myocytes of different length without impairment through electrolysis/electroporation.
Previous reports suggest that an electric field will be more effective in inducing contraction when oriented parallel rather than orthogonal to the length of the myocyte (Tung et al., 1991; Knisley and Grant, 1995). Thus, to generate a field oriented parallel to the microchannel, electrodes were designed to run across the microchannel array (see Fig. 2). A 60-μm-wide central gold electrode crossing the middle of the array was used as the common pseudo-reference electrode. The stimulating electrodes were fabricated such that they crossed the microchambers on both sides of the reference electrode, allowing the placement of two single myocytes either side of the central electrode (Fig. 2). This arrangement could be repeated to create an array of myocytes. Whereas the reference electrode was common to all the chambers, the peripheral stimulating electrodes were each individually addressable, to permit the sequential stimulation of individual cells with different field strengths and/or frequencies of stimulation.
The gap between each stimulating electrode and the reference electrode was constrained to a maximum of 200 μm (Fig. 3 B, i.e., large enough to provide an arena for single cell analysis while minimizing the applied potential for field stimulation). Stimulating electrodes had dimensions of 40-μm width, 20-μm length, and 100-nm height. The connecting wires to the stimulating electrodes were also deposited by photolithographic methods and were aligned such that they extended parallel to the end of the titer chambers, underneath the PDMS side-wall partitions, so as to avoid unwanted electrical crosstalk between individual chambers (and not to provide an additional electrode surface for stimulation). The active surface area of the stimulation electrode was thus 800 μm2. Conditions for field stimulation were further optimized by minimizing the conducting volume between the electrodes. For this purpose, the height of the chamber was limited to 10 μm and the width to 40 μm—dimensions only slightly larger than those of an isolated adult cardiac myocyte.
FIGURE 3.
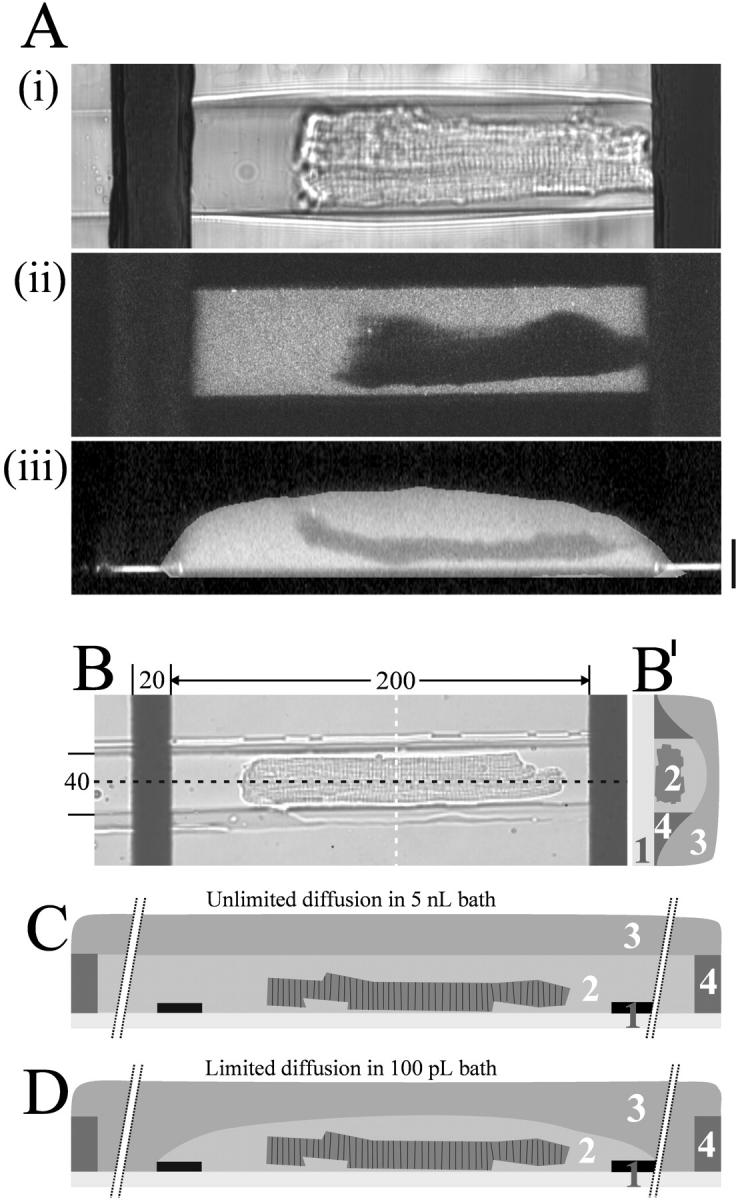
Visualization of the picoliter volume of a microchamber holding a single ventricular myocyte. The extracellular dye (Ca2+ bound Fluo-3) was excited with a two-photon laser and series of optical sections along the z-axis were recorded. (A) Transmitted light picture (i), fluorescent picture (ii), and vertical cross-section (iii) through the long axis of the cell after reconstructing the z-stack to generate a three-dimensional view (z-spacing is 0.5 μm; scale bar is 20 μm). (B) Micrograph of a cardiomyocyte in microchannel oriented parallel to the electric field between the microelectrodes; distances indicated as μm. (B′) illustration of an orthogonal cross-section (white line in Fig. 3 B). (C) Sketch illustrating a longitudinal cross-section (black line in Fig. 3 B) through the center of a microchannel. Unlimited diffusion in bath comprising the entire length of the microchannel with the ends of the channel extending ∼5 mm beyond each electrode (breaks indicated), thus comprising a volume of >5 nL. (D) Limited diffusion in bath comprising solely the area between the electrodes (40-μm wide, 250-μm long, and 10-μm high, ∼100 pL volume). Coverslip with microelectrodes (1), bath with cardiomyocyte (2), mineral oil (3), and microchannel in PDMS (4).
Electrical stimulation
Symmetric biphasic rectangular pulses were generated with a custom-built electric field stimulator. Each phase was individually controllable according to amplitude, duration, polarity, frequency, and delay between the two phases. A custom-built voltage-current converter was used to read the current response of one electrode together with the corresponding voltage into a 20-MHz, 4-channel acquisition card (PCI-9812, Adlink, Taipei, Taiwan). A transfer transistor logic signal synchronous to the biphasic pulses was fed into the reader of the photomultiplier tube (PMT)-current to mark each pulse arrival on the fluorescence trace for off-line event averaging. After filling the microchambers with the electrolyte (buffer), the current evoked on the individual stimulation electrodes was monitored to assure the ionic connection between the microelectrodes in each chamber, before the addition of cardiac muscle cells. The measured current was integrated to give a measure of the total amount of net charge added to the microchamber, and the polarization of the electrode surface.
Light microscopy
Sarcomere length and intracellular Ca2+ concentration ([Ca2+]i) were monitored simultaneous using the fluorescence-contractility system of Ionoptix (Milton, MA). Ventricular myocytes were loaded with Fluo-3 by incubation for 30 min in 20 μM Fluo-3 AM solution (Molecular Probes, Eugene, OR). The internal dye was excited at 505 nm with a TILL monochromator (T.I.L.L. Photonics, Martinsried, Germany) mounted on a Zeiss Axiovert 200 (Zeiss, Göttingen, Germany) equipped with a ×63 C-Apochromat water immersion lens, NA 1.2. The emission of Fluo-3 was directed to the PMT-tube through a 510 dichroic mirror and a 515 bandpass filter (Omega Optical, Brattleboro, VT). The light of the halogen lamp was passed through a 680-nm bandpass filter and was directed to a charge-coupled device camera to record the sarcomere length. PMT and camera signals were displayed online with the IonWizard Version 5.0 software and stored for further evaluation. To measure the possible change in extracellular pH during field stimulation, 10 μM BCECF (Molecular Probes) was added to the bath and the emission was recorded using the same filter set as for Fluo-3. To avoid bleaching BCECF was excited at 505 nm for a 5-ms period every 200 ms. The intensity of the excitation light for both dyes was adjusted by a neutral density filter (OD = 2).
Confocal microscopy
Confocal line scan images of intracellular Fluo-3 were recorded on a BioRad Radiance 2000 confocal scanner mounted to a Nikon inverted microscope (Eclipse) using a 60× Fluor water immersion objective (NA 1.2). The scan line was oriented parallel to the longitudinal axis of the myocytes and the emission recorded at 500 Hz. To mark the pulse arrival on the line scan image, a LED-flash of 2-ms duration aligned to the optical path of the microscope was triggered 25 ms before the stimulus pulse.
Separate confocal imaging measurements were made to examine the volume of ventricular myocytes in microchambers. Z-stacks (0.5-μm spacing) were recorded on the same microscope. Ca2+-saturated Fluo-3 was added to the bath and the extracellular dye was excited at 810 nm using a 700-mW Mira laser system (Coherent, Santa Clara, CA, USA). Z-stacks were used to construct three-dimensional views of the myocytes and to calculate the extracellular volume in the microchamber using the Huygens software (Bitplane, Zurich, Switzerland).
RESULTS
Design and fabrication of microchannel array
After several iterations of design and prototyping, the three dimensions of the microchamber were finalized to give an array of structures 200 μm in length, 40 μm in width, and 10 μm in height with a volume of ∼100 pL (Fig. 2). An average-sized adult ventricular myocyte of 150-μm length, 25-μm width, 5-μm height, and volume of 36 pL would thus occupy 20% of the microchannel space (Fig. 3). The gap between the individual channels in an array was 30-μm wide, thus allowing two rows of six channels each to be imaged onto the fast intensified charge-coupled device camera using a 20× lens (Fig. 2). In common with previous reports (Tung et al., 1991; Knisley and Grant, 1995), it was found that stimulating the myocyte along the length of the cell, as opposed to across its width, greatly reduced the potential at which stimulation could be achieved.
Preselected cells were placed into the open microchambers through a 300-μm-thick layer of mineral oil and roughly aligned with their long axis parallel to the microchambers. The hydrophobic surface of the silicon rubber repelled the excess buffer on top of the 30-μm-wide partition separating the chambers, thus forcing the cells into the grooves. All excess buffer was removed. Imaging in the presence of a fluorescent dye (100 μM fluorescein) showed that no crosstalk between individual chambers occurred (Fig. 3).
Electrolytic limit to stimulus field strength
Given the extremely small volumes, any electrolysis products (e.g., Au+, H+) generated on the electrode surface will accumulate rapidly over time. To check for accumulation of H+ ions, the microchannels were filled with 100 pL of the electrolyte buffered with 1 mM HEPES containing the pH-sensitive dye BCECF (20 μM). Unipolar rectangle pulses of 2-ms duration and amplitudes between 0.5 V (50 V/cm) and 2.5 V (125 V/cm) were applied at 1.5 Hz to the integrated electrodes. As shown in Fig. 4 A, the pH did not change using stimulus voltages close to the theoretical threshold for electrolysis (0.8 V, 40 V/cm), although the pH was seen to drop rapidly at voltages above the theoretically predicted thresholds. When pulsed with amplitudes of >2.0 V (>100 V/cm) across the 200-μm distance between the electrodes, the pH reached a steady state within 10 min of continual pulsing at 1.5 Hz and did not recover after the pulses were stopped. No gassing or signs of pH-dependent dissolution of the gold were observed during the experiment. Fig. 4 B shows the average field strength for excitation of single cardiac myocytes of an average length of ∼160 μm in relation to the field strengths necessary for electrolysis (>40 V/cm). The upper line represents the field strength necessary to electroporate cardiac myocyte membranes. Above this field strength (established by separate experiments), stimuli caused the irreversible breakdown of the sarcolemma, inward Ca2+ leakage, and the development of a hypercontracture. The average field strength required to elicit stable Ca2+ transients (27 V/cm) was well below that of both the electroporation and electrolysis thresholds.
Synchronous activation of cardiomyocyte by field stimulation
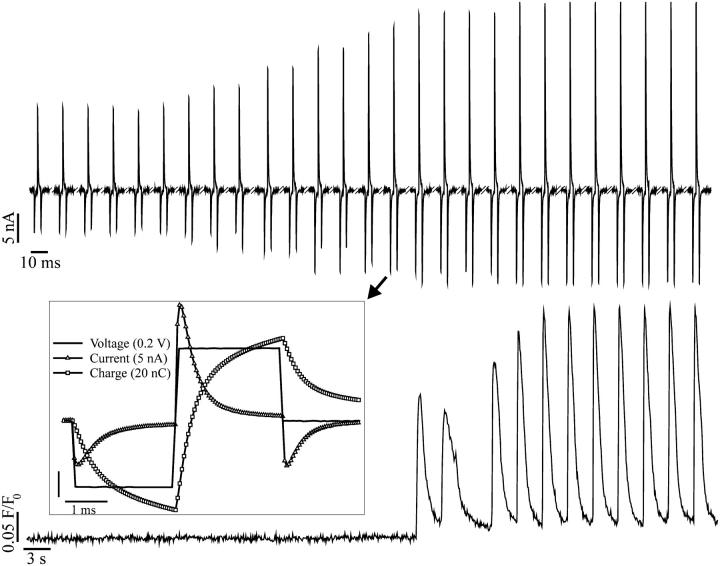
The pulsing regime was optimized by comparing the threshold stimulation current at different stimulus profiles. The overall geometry of the electrodes and microchamber was as shown in Fig. 3. The all-or-none response of the action potential helped to identify the limit for a supra-threshold stimulus, by gradually increasing the amplitude of the pulse. The action potential was measured either directly with the voltage-sensitive dye Di-8-ANNEPPS or indirectly, by recording Ca2+ transients or cell shortening (Fig. 5). The optimized pulse profile comprised a symmetric biphasic rectangular stimulus with 2-ms duration and 0.5 V amplitude per phase. The steady-state current passed between the electrodes was <2 nA and polarization of the electrodes was negligible.
FIGURE 5.
All-or-none excitatory response to biphasic stimuli. The top trace shows the train of current spikes recorded on one of the stimulating electrodes. The bottom trace shows the concurrent intracellular Ca2+ transients occurring only after suprathreshold stimulation. The amplitude of the stimulus was gradually increased until the first Ca2+ transient was triggered. The inset shows the last current spike before the onset of excitation on an expanded timescale together with the correspondent voltage and charge profile. The Ca2+ transients were recorded with the Ca2+-sensitive dye Fluo-3.
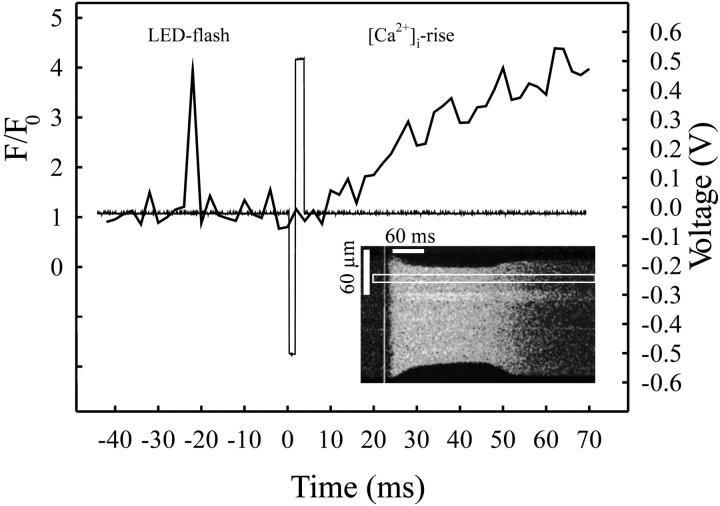
To further characterize the intracellular Ca2+ fluxes implicated in excitation-contraction coupling, the electrically stimulated Ca2+transients were recorded confocally with high spatial and temporal resolution. The Fluo-3 loaded cells were placed into microchambers with the integrated electrode as shown in Fig. 3. Cells were stimulated at 0.5 Hz and a representative transient is shown in Fig. 6. The instantaneous uniform rise of [Ca2+]i, as revealed on the scan along the longitudinal axis of the cell, evoked the shortening of both ends of the adult ventricular myocyte. The time resolution of 2 ms scan−1 did not enable the identification of the triggering phase of the stimulus (make or break stimulation). Given an intracellular resistivity of 500 Ω cm−1 (Weidmann, 1970) and a membrane capacitance of 1 μF cm−2, it is likely that charging of the cell membrane occurred in a few μs (see Discussion).
FIGURE 6.
Uniform rise of [Ca2+]i upon electrical stimulation with microelectrodes. The confocal scan line was aligned to the longitudinal axis of a Fluo-3 loaded cell (insert) paced with biphasic stimuli. The acquired line scan image shows the uniform rise in [Ca2+]i immediately after the excitation. A pulse triggering an LED flash was coupled 25 ms in advance to the stimulating pulse to mark the event on the confocal record. Note the cell shortening in response to the [Ca2+]i rise and relaxation after the Ca2+ clearance. The fluorescence profile in a 10-μm-wide band (indicated) is plotted against time (thick line) together with the voltage profile of the stimulator (thin line).
Effects of prolonged stimulation within a microchannel
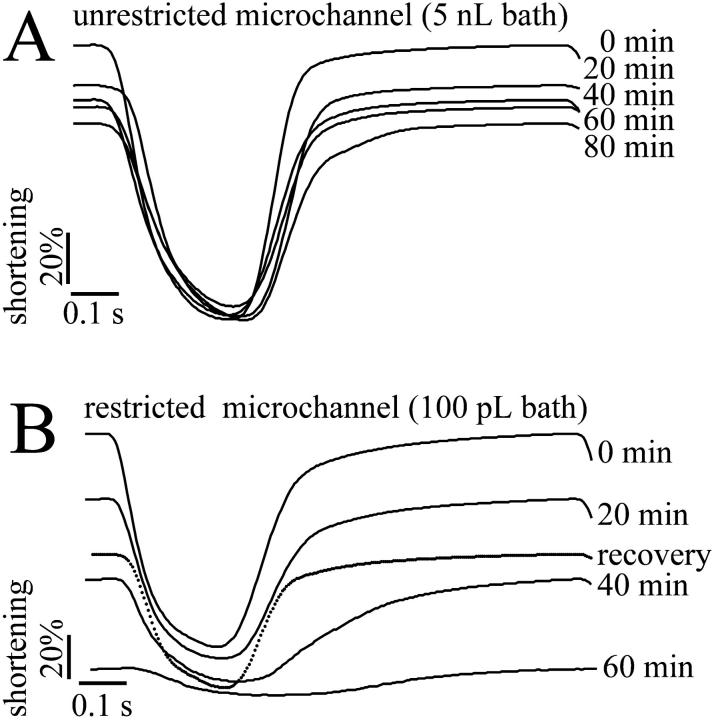
Adult ventricular myocytes were continually stimulated in microchannel of two standard volumes (5 nL and 100 pL) as illustrated in Fig. 3, C and D. In microchannel of 5 nL or above, the amplitude of the cell shortening decreased to a small extent during continual stimulation (Fig. 7 A). However, in the restricted extracellular space of 100 pL cell shortening ceased after 60-min of continual pacing and partially recovered after renewal of the buffer (Fig. 7 B). The average decline in cell shortening under these two conditions is shown in Table 1.
FIGURE 7.
The effect of continual pacing on contractility of single cardiomyocytes. Myocyte contractility was measured as the change of the sarcomere length from cardiomyocytes stimulated at 1 Hz (19–21°C). (A) Superimposed records of relative sarcomere length from an isolated rabbit cardiomyocyte stimulated in a 5-nL microchannel; single transients from a continuous record are shown. The values on the right-hand side represents period from development of steady-state shortening. (B) Relative mean sarcomere length records from an isolated rabbit cardiomyocyte stimulated in a restricted extracellular volume (∼100 pL) at 1 Hz (19–21°C). Contractility decayed within a 60-min period of continuous stimulation but partial recovery was observed after renewal of the buffer.
TABLE 1.
Shortening during continuous electrical stimulation of adult ventricular myocytes
| Percentage of cell shortening
|
||
|---|---|---|
| Min of pacing | Bath > 5 nL (n = 8) | Bath = 100 pL (n = 5) |
| 0 | 100 | 100 |
| 15 | 83 ± 12 | 79 ± 19 |
| 20 | 74 ± 6 | 73 ± 9 |
| 30 | 69 ± 11 | 39 ± 16 |
| 40 | 68 ± 13 | 30 ± 4 |
| 50 | 68 ± 25 | 13 |
| 60 | 61 ± 27 | – |
Cells were paced at an average field strength of 30 V/cm and the sarcomere length was continually recorded. The change in sarcomere spacing over time was related to the sarcomere length at rest (100%). Note the drop in cell shortening after 30 min of continuous stimulation in the limited extracellular space of 100 pL volume.
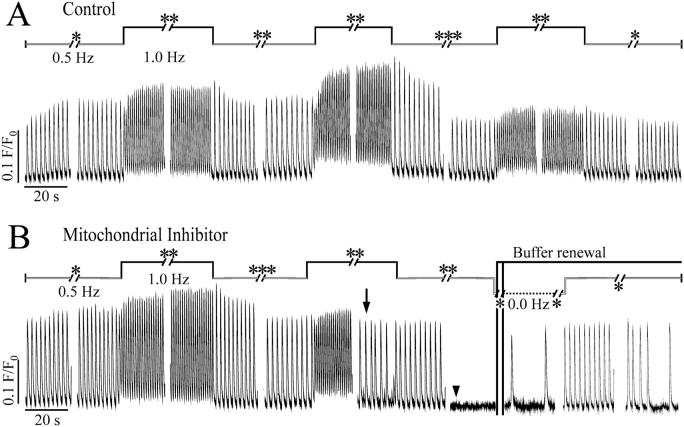
In separate experiments, the Ca2+ transients from continually paced adult ventricular myocytes were also recorded in cells kept in the restricted volume (100 pL, Fig. 8, A and B) using Fluo-3 fluorescence. The diastolic Fluo-3 fluorescence signal adapted almost instantaneously to higher levels at higher frequencies whereas the peak of the fluorescence transient reached steady state after the first five beats at the higher frequency. Returning to lower frequencies returned the diastolic level to the lower value. The amplitude of the Fluo-3 fluorescence signal decreased slowly over ∼60 min of stimulation. This decrease was less than the attenuation of the shortening signal (Fig. 7 A, Table 1). Although this may represent a decrease of the intracellular Ca2+, dye bleaching or dye loss/sequestration may also contribute.
FIGURE 8.
[Ca2+] transients during continual pacing. Fluo-3 loaded cardiomyocytes were electrically stimulated in the restricted extracellular space of ∼100 pL at alternating frequencies of 0.5 Hz (white bar) and 1.0 Hz (black bar) for periods of 5 (*), 10 (**), or (20 (***) min either with or without FCCP, a mitochondrial uncoupler. The fluorescence was recorded at 50 Hz with an intensified charge-coupled device camera. The amplitude of the Ca2+ transient of the control attenuated after 70 min of continual pacing in the picoliter volume in the absence of FCCP (Fig. 8 A). No cell shortening was detectable after 70 min of continual stimulation in the restrained extracellular space (see also Fig. 7 B). In the presence of 1 μM FCCP, the cell no longer responded to the electrical stimulation at the higher frequency after 50-min pacing (Fig. 8 B, arrow), and 10 min later the Ca2+ transients evoked at 0.5 Hz ceased almost completely (Fig. 8 B, arrowhead). Immediately after the renewal of buffer, the cell started Ca2+ waves at low frequency in the absence of electrical stimulation. The cell partially recovered from its unresponsiveness to the electrical stimulation.
A similar response was observed in cells paced in the presence of 1 μM FCCP, a mitochondrial uncoupler which induces intracellular ATP depletion (Babcock and Hille, 1998). After 50-min continual stimulation at alternating frequencies of 0.5 and 1.0 Hz the cell no longer responded to every single stimulus with a Fluo-3 fluorescence transient of normal amplitude. Some transients were of lower amplitude and some were missing altogether, until after 60 min, only small changes of the fluorescence signal were detectable (Fig. 8 B).
Ca2+ waves with low frequency were observed as slow changes in Fluo-3 signal after washing out FCCP and changing the buffer (Fig. 8 B). The cell regained its excitability after a 5-min rest interval between the continuous stimulation indicating the integrity of the sarcolemma.
DISCUSSION
Conditions for stimulation of myocytes in microchannels
This article describes the fabrication of an array of microchannels designed to hold adult ventricular myocytes in individual microchambers of pL volume with integrated electrodes for field stimulation. The geometry of microelectrodes, micron-scale chambers, and the stimulus regime for continual electrical stimulation of single ventricular myocytes was optimized for excitation of the myocytes while minimizing electrolysis. To enable electrical stimulation of adult ventricular myocytes within such a format there are a number of important criteria, namely: 1), the current density within the extracellular space should be sufficient for an action potential to be achieved with voltage amplitudes below the threshold for electrolysis of water; 2), the current pulse should be charge-balanced to avoid electrolysis and polarization of the electrodes; 3), the polarization of the cell membrane away from rest should not exceed 200 mV to prevent electropermeabilization (Tovar and Tung, 1992; Knisley and Grant, 1995; Song and Ochi, 2002); 4), the cardiomyocytes should be aligned parallel to the electrical field; and 5), be positioned between the microelectrodes by means of microchannels. As demonstrated in this study, the microelectrodes and microchannels can both be produced in an array-based format to allow for higher throughput tests, and microelectrodes within the array should be individually addressable to allow for comparison of cells paced with different pulse regimes.
Electrode and microarray geometry
The limited extracellular space in the shallow microchannel restricted ionic current flow in the solution between the stimulus electrodes and the reference electrode, ensuring sufficient current flow through the myocyte. The average field strength for excitation was 27 V/cm, well below the threshold for electrolysis (Fig. 4 B). No acidification was detectable in the restricted volume of 100 pL during 10 min of continual monophasic pulsing with 0.5 V (Fig. 4 A). Thus any loss of excitability during continual stimulation in the reduced extracellular space of 100 pL is expected to be caused by cellular by-products accumulating within the intra- and extracellular space (Figs. 7 and 8). Stimulation is evoked by shifting the resting potential toward the threshold for Na+ current activation. During field stimulation of isolated cardiac myocytes, depolarization is achieved either by charge displacement or by net ionic current flow between the two electrodes. Theoretically, the threshold could be achieved by charge displacement only. This does not appear to be the situation in this study, since as shown in Fig. 5, there is a small but significant ionic current flow during each stimulus (<1 nA). This current is not due to electrolysis but is simply due to the low conductance pathway provided by the saline solution (∼60 Ω cm−1). Preliminary work showed that polyphenol-coated gold electrodes (used to eliminate the small ionic component) did not stimulate cardiomyocytes using comparable stimulus strengths (results not shown). This indicated that the small ionic current component was necessary for stimulation. Our experience suggests that gold electrodes offer a series of advantages over other electrode materials for field stimulation due to the ease of fabrication, the high electrical capacitance, and the fact that gold does not dissolve in chloride containing solutions at low stimulus strengths.
Long-term stimulation in limited extracellular volumes
The length period of time over which contractility could be maintained was related to the volume of fluid bathing the myocytes. The two extremes available from this design are shown in Figs. 7 and 8. Stimulation of the myocytes bathed in the entire microchannel (volume >5 nL) caused little reduction in shortening amplitude over 60 min. Reducing the volume within the microchannel to the space between the electrodes creates a minimum volume of ∼100 pL and allows adult ventricular myocytes to contract for ∼50 min with gradually decreasing amplitude (Fig. 7 B, Table 1). However, the amplitude of the Ca2+ transients evoked in the restricted volume of 100 pL was maintained over the period, indicating reduced Ca2+ sensitivity of the myofilaments underlying the poor contractility. The cause of this fall in contractility is unknown, but one possible reason is the acidification of the intracellular space. However, previous studies have noted that intracellular acidification cause a decreased twitch/shortening and increased Ca2+ transient amplitude (Harrison et al., 1992). An alternative explanation is that falling contractility is due to the accumulation of external K+ concentration (Fiolet et al., 1993) due to the restricted extracellular space. The contribution of both possibilities need to be investigated in future studies.
Simulated ischemia
While myocytes shortening decreased progressively within the 100 pL volume, depolarization-induced Ca2+ transient was unaffected. Only inhibition of mitochondrial metabolism with FCCP stopped the Ca2+ transients, first only at the higher stimulation frequency but afterwards completely, at lower stimulation frequencies. Both the contraction and the Ca2+ transient partially recovered after removal of FCCP by renewal of the buffer. Immediately after the buffer was renewed, the adult ventricular myocytes displayed spontaneous SR Ca2+ release that stopped after ∼15 min and was replaced by electrically activated Ca2+ transients. Ca2+ oscillations have been observed after reoxygenation of adult ventricular myocytes and are thought to be part of the recovery process after reenergizing the cell (Ladilov et al., 1996).
This is the first study to show the feasibility of stimulating isolated cardiac myocytes within limited volumes in an array format. This technology has the potential to be used for the profiling of novel compounds to modulate excitation contraction coupling in adult cardiac myocytes. Alternatively, single 100 pL volume units can be used to model the limited extracellular space experienced by myocytes during ischemia.
Supplementary Material
References
- Babcock, D. F., and B. Hille. 1998. Mitochondrial oversight of cellular Ca2+ signalling. Curr. Opin. Neurobiol. 8:398–404. [DOI] [PubMed] [Google Scholar]
- Bratten, C. D. T., P. H. Cobbold, and J. M. Cooper. 1998. Single-cell measurements of purine release using a micromachined electroanalytical sensor. Anal. Chem. 70:1164–1170. [DOI] [PubMed] [Google Scholar]
- Cai, X., N. Klauke, A. Glidle, P. Cobbold, G. Smith, and J. M. Cooper. 2001. Ultra-low-volume, real-time measurements of lactate from the single heart cell using microsystems technology. Anal. Chem. 74:908–914. [DOI] [PubMed] [Google Scholar]
- Cannon, D. M., Jr., N. Winograd, and A. G. Ewing. 2000. Quantitative chemical analysis of single cells. Annu. Rev. Biophys. Biomol. Struct. 29:239–263. [DOI] [PubMed] [Google Scholar]
- Cheng, D. K.-L., L. Tung, and E. A. Sobie. 1999. Nonuniform responses of transmembrane potential during electric field stimulation of single cardiac cells. Am. J. Physiol. 277:H351–H362. [DOI] [PubMed] [Google Scholar]
- Connolly, P., P. Clark, A. S. G. Curtis, J. A. T. Dow, and C. D. W. Wilkinson. 1990. An extracellular microelectrode array for monitoring electrogenic cells in culture. Biosens. Bioelectron. 5:223–234. [DOI] [PubMed] [Google Scholar]
- Cooper, J. M. 1999. Towards electronical Petri dishes. Trends Biotechnol. 17:226–230. [DOI] [PubMed] [Google Scholar]
- Dixon, A. K., P. J. Richardson, R. D. Pinnock, and K. Lee. 2000. Gene-expression analysis at the single-cell level. Trends Pharma. Sci. 21:65–70. [DOI] [PubMed] [Google Scholar]
- Eisner, D. A., and W. J. Lederer. 1989. The electrogenic sodium-calcium exchange. In Sodium-Calcium Exchange. T. J. A. Allen, D. Noble, and H. Reuter, editors. OUP, Oxford. 178–207.
- Fiolet, J. W., C. A. Schuhmacher, A. Baartscheer, and R. Coronel. 1993. Osmotic changes and transsarcolemmal ion transport during total ischaemia of isolated rat ventricular myocytes. Basic Res. Cardiol. 88:396–410. [DOI] [PubMed] [Google Scholar]
- Fishler, M. G., E. A. Sobie, N. V. Thakor, and L. Tung. 1996. Mechanisms of cardiac cell excitation with premature monophasic and biphasic field stimuli—a model study. Biophys. J. 70:1347–1362. [DOI] [PMC free article] [PubMed] [Google Scholar]
- Gilchrist, K., L. Giovangrandi, and G. T. A. Kovacs. 2001. Analysis of microelectrode-recorded signals from a cardiac cell line as a tool for pharmaceutical screening. Transduc. Eurosens. 1D3. 19P:390–393. [Google Scholar]
- Gomes, P. A., R. A. Bassani, and J. W. M. Bassani. 2001. Electric field stimulation of cardiac myocytes during postnatal development. IEEE Trans. Biomed. Eng. 48:630–636. [DOI] [PubMed] [Google Scholar]
- Harrison, S. M., J. E. Frampton, E. McCall, M. R. Boyett, and C. H. Orchard. 1992. Contraction and intracellular Ca2+, Na+, and H+ during acidosis in rat ventricular myocytes. Am. J. Physiol. Cell Physiol. 262:C348–C357. [DOI] [PubMed] [Google Scholar]
- Hosokawa, K., T. Fujii, and I. Endo. 1999. Handling of picoliter liquid samples in a poly(dimethylsiloxane)-based microfluidic device. Anal. Chem. 71:4781–4785. [Google Scholar]
- Ingebrandt, S., C. Yeung, M. Krause, and A. Offenhäuser. 2001. Cardiomyocyte-transistor-hybrids for sensor application. Biosens. Bioelectron. 16:565–570. [DOI] [PubMed] [Google Scholar]
- Israel, D. A., W. H. Barry, D. J. Edell, and R. G. Mark. 1984. An array of microelectrodes to stimulate and record from cardiac cells in culture. Am. J. Physiol. 247:H669–H674. [DOI] [PubMed] [Google Scholar]
- Knisley, S. B., T. F. Blitchington, B. C. Hill, A. O. Grant, W. M. Smith, T. C. Pilkington, and R. E. Ideker. 1993. Optical measurements of transmembrane potential changes during electric field stimulation of ventricular cells. Circ. Res. 72:255–270. [DOI] [PubMed] [Google Scholar]
- Knisley, S. B., and A. O. Grant. 1995. Asymmetrical electrically induced injury of rabbit ventricular myocytes. J. Mol. Cell. Cardiol. 27:1111–1122. [DOI] [PubMed] [Google Scholar]
- Ladilov, Y. V., B. Siegmund, and H. M. Piper. 1995. Protection of reoxygenated cardiomyocytes against hypercontracture by inhibition of Na+/H+ exchange. Am. J. Physiol. 37:H1531–H1539. [DOI] [PubMed] [Google Scholar]
- LaVan, D. A., D. M. Lynn, and R. Langer. 2002. Moving smaller in drug discovery and delivery. Nat. Rev. 1:77–84. [DOI] [PubMed] [Google Scholar]
- Li, H., C. E. Sims, H. Y. Wu, and N. L. Allbritton. 2001. Spatial control of cellular measurements with the laser micropipet. Anal. Chem. 73:4625–4631. [DOI] [PubMed] [Google Scholar]
- McConnell, H. M., J. C. Owicki, J. W. Parce, D. L. Miller, G. T. Baxter, H. G. Wada, and S. Pitchford. 1992. The cytosensor microphysiometer: biological applications of silicon technology. Science. 257:1906–1912. [DOI] [PubMed] [Google Scholar]
- Parak, W. J., M. George, J. Domke, M. Radmacher, J. C. Behrends, M. C. Denyer, and H. Gaub. 2000. Can light-addressable potentiometric sensor (LAPS) detect extracellular potentials of cardiac myocytes? IEEE Trans. Biomed. Eng. 47:1106–1113. [DOI] [PubMed] [Google Scholar]
- Song, Y. M., and R. Ochi. 2002. Hyperpolarisation and lysophosphatidylcholine induce inward currents and ethidium fluorescence in rabbit ventricular myocytes. J. Physiol. 545:463–473. [DOI] [PMC free article] [PubMed] [Google Scholar]
- Sprössler, C. H., M. Denyer, S. Britland, W. Knoll, and A. Offenhäuser. 1999. Electrical recordings from rat cardiac muscle cells using field-effect transistors. Phys. Rev. E. 60:2171–2176. [DOI] [PubMed] [Google Scholar]
- Taylor, D. L., E. S. Woo, and K. A. Giuliano. 2001. Real-time molecular and cellular analysis: the new frontier of drug discovery. Curr. Opin. Biotechnol. 12:75–81. [DOI] [PubMed] [Google Scholar]
- Taylor, L. C., and D. R. Walt. 2000. Application of high-density optical microwell arrays in a live-cell biosensing system. Anal. Biochem. 278:132–142. [DOI] [PubMed] [Google Scholar]
- Tovar, O., and L. Tung. 1992. Electroporation and recovery of cardiac cell membrane with rectangular voltage pulses. Am. J. Physiol. Heart Circ. Physiol. 263:H1128–H1136. [DOI] [PubMed] [Google Scholar]
- Tung, L., and J. R. Borderies. 1992. Analysis of electric field stimulation of single cardiac muscle cells. Biophys. J. 63:371–386. [DOI] [PMC free article] [PubMed] [Google Scholar]
- Tung, L., N. Sliz, and M. R. Mulligan. 1991. Influence of electrical axis of stimulation on excitation of cardiac muscle cells. Circ. Res. 69:722–730. [DOI] [PubMed] [Google Scholar]
- Weidmann, S. 1970. Electrical constants of trabecular muscle from mammalian heart. J. Physiol. 210:1041–1054. [DOI] [PMC free article] [PubMed] [Google Scholar]
Associated Data
This section collects any data citations, data availability statements, or supplementary materials included in this article.


