Abstract
Optical flow techniques are often used to estimate velocity fields to represent motion in successive video images. Usually the method is mathematically ill-posed, because the single scalar equation representing the conservation of local intensity contains more than one unknown velocity component. Instead of regularizing the problem using optimization techniques, we formulate a well-posed problem for the gerbil hemicochlea preparation by introducing an in-plane incompressibility constraint, and then show that local brightness is also conserved. We solve the resulting system using a Lagrangian description of the conservation equations. With this approach, the displacement of isointensity contours on sequential images determines the normal component of velocity of an area element, while the tangential component is computed from the local constant area constraint. We have validated our method using pairs of images generated from our calculations of the vibrational deformation in a cross section of the organ of Corti and tectorial membrane in the mammalian cochlea, and quantified the superior performance of our method when complex artificial motion is applied to a noisy image obtained from the hemicochlea preparation. The micromechanics of the organ of Corti and the tectorial membrane is then analyzed by our new method.
INTRODUCTION
The relative motions of cochlear structures remain unclear despite advances in imaging the vibrational patterns in the cochlea. Recently Hu et al. (1999) applied an optical flow technique to analyze low frequency motion in the hemicochlea preparation, in which the gerbil cochlea is sectioned into two halves along the midmodiolar plane. They used the gradient-based algorithm of Lucas and Kanade (1981) to compute the velocity fields that represent the motion in successive video images. The gradient-based methods estimate two-dimensional velocity fields by using spatiotemporal derivatives of the image intensity field. These methods are based on a gradient constraint equation that is derived from the assumption that local structures conserve their intensity when they move. However, this equation alone is not sufficient to unambiguously compute the two components of a velocity vector. Usually the problem is regularized by adding another constraint and using optimization techniques. Barron et al. (1994) reviewed and quantitatively evaluated different implementations of the method. The algorithm used by Hu et al. (1999) attempts to find the least square best fit for a two-dimensional velocity vector that is assumed to be constant in a small neighborhood (5 × 5 pixels) surrounding the field point. Large regions of the image are not assigned velocity vector because the method has built-in confidence measures that determine the velocity vector only when both the intensity gradients are large enough and the isointensity contours are curved enough. The method is therefore an edge detection algorithm that works best with well-defined curved edges. Here we formulate a mathematically well-posed problem by introducing an in-plane incompressibility constraint. We then show that brightness as well as intensity is conserved. Although an incompressibility constraint has been previously proposed as part of an optimization scheme (Li et al., 2000; Zhou et al., 1995), our Lagrangian solution method, which relies on optimization to a much smaller extent, is novel for optical flow. We validate the Lagrangian method using pairs of synthetic images generated from our calculations of the vibrational deformation in a cross section of the tectorial membrane (TM) and the organ of Corti (OC) in the mammalian cochlea. We also test that method using real images from the hemicochlea preparation with computer-generated artificial displacements, and then apply the Lagrangian method to images obtained from the hemicochlea preparation to analyze the vibrational patterns of the cellular structures of the cochlea.
LAGRANGIAN FORMULATION AND SOLUTION METHOD
The central assumption in optical flow analysis is that the local intensity of moving deformable image elements do not change with time. This implies the following intensity gradient constraint equation (Barron et al., 1994):
 |
(1) |
where I(x, y, t) is the image intensity at location (x, y) and at time t, and u and v are velocity components in x and y directions, respectively. It is impossible to uniquely recover velocity from Eq. 1 alone because there are two unknowns (u and v) in the equation. Therefore, an additional constraint has to be introduced. Instead of assuming that u and v are constants in a neighborhood of (x,y) as did Hu et al. (1999), we introduce an in-plane incompressibility constraint
 |
(2) |
which implies that infinitesimal elements conserve area as they move. In fact, we neglect the term ∂w/∂z in Eq. 2, where w is the out-of-plane component of velocity, and z is the out-of-plane coordinate. It seems to be agreed that w ≪ (u, v) for tissue motion both in the intact cochlea and the hemicochlea. This has been verified by three-dimensional measurements of organ of Corti motion in response to acoustic stimulation in a temporal bone preparation of the guinea pig cochlea (Hemmert et al., 2000). For fluid motion the situation is more complex. Axial fluid flow has been seen experimentally in the tunnel of Corti (Karavitaki and Mountain, 2003), and in the spiral sulcus in finite element simulations (Cai and Chadwick, 2003). However, in the open hemicochlea, fluid cannot develop an axial pressure gradient (Richter et al., 1998). This argues against significant out-of-plane fluid motion in the hemicochlea even though such motions cannot yet be quantified. In any case, we apply Eq. 2 to both tissue and fluid, because water itself is essentially incompressible and cannot flow across cell membranes at acoustic frequencies. Acellular structures such as the tectorial membrane are also essentially incompressible.
The basic idea of the Lagrangian formulation is to follow the same material points in a region of image area as the region moves and deforms. In fact Eqs. 1 and 2 imply that
 |
(3) |
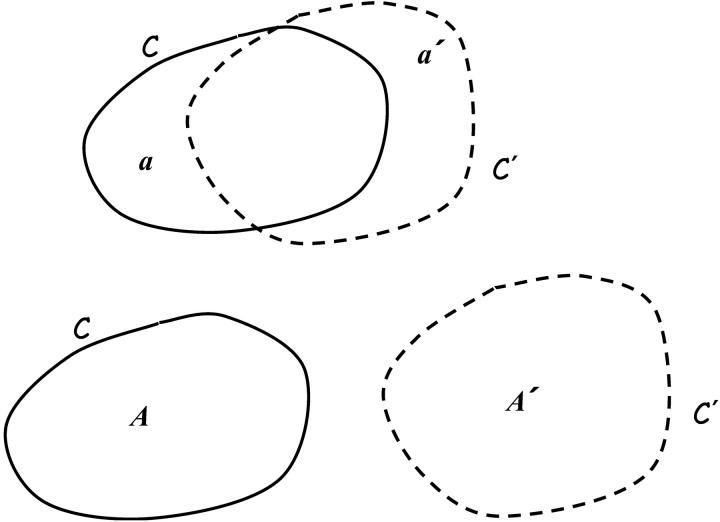
i.e., the total brightness B(A, t) inside a region having area A(t) remains constant as the element moves and deforms. To prove this we follow the arguments of Karamcheti (1966). Consider a closed curve C enclosing a local image area A at time t. Let C′ and A′ denote the closed curve and enclosed area at time t + δt. Also let a′ denote the area outside of C and inside of C′, while a denotes the area inside of C and outside of C′ (Fig. 1). Using the usual definition of a derivative we have
 |
(4) |
but notice from Fig. 1 that B(A′, t + δt) = B(A, t + δt) + B(a′, t + δt) − B(a, t + δt). The first term B(A, t + δt) = B(A, t) + δt∂B(A, t)/∂t + …, with A fixed, while the last two terms represent the net outflow of I during the time δt through the closed curve C fixed at time t, i.e.,  , where n is the unit normal to the curve C. Therefore
 |
(5) |
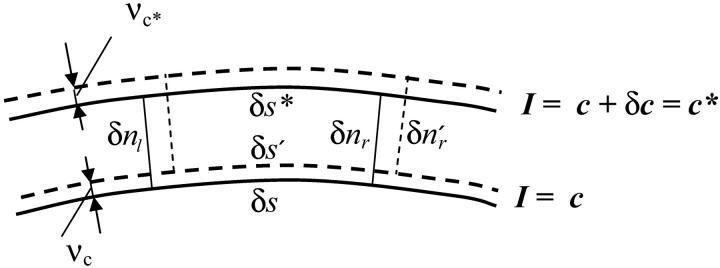
The first two terms of the integrand vanish by Eq. 1 whereas the last vanishes by Eq. 2. It therefore follows that the brightness of a moving incompressible region remains constant in time. Notice that if the motion is not incompressible then the brightness of a moving region changes with time. Now consider a special case of Eq. 5 when the closed curve C is a curvilinear quadrilateral comprised of two arcs δs and δs*, respectively on neighboring isointensity contours I(x, y, t) = c, I(x, y, t) = c* = c + δc, and two normals δnr and δnl, (Fig. 2). The brightness of this element of area at time t is B(t) = cδsδnr + higher order terms in δs, δn, and δc. Now let us compute the brightness of the same element at time  higher order terms in δs′, δn′, and δc. Because we are tracking the same element of area bounded by the same isointensity contours, the conservation of brightness Eq. 5 reduces simply to conservation of area:
  where the prime designates length evaluated at time t + δt. Let νc and νc* respectively denote the normal displacements of the isointensity curves c and c* in the time interval δt. The mean normal velocity vn of the element is then
 |
(6) |
which is to be evaluated at the centroid of the element. To calculate the mean tangential velocity vs of the element we first determine the tangential elongation of the element δs′ − δs using 
 |
(7) |
Notice from Fig. 2 that  The rate of elongation of the element can be expressed as the difference between the tangential velocities vr and vl of the right and left ends of the element. Therefore
 |
(8) |
where the mean tangential velocity vs (also to be evaluated at the centroid of the element) is
 |
(9) |
Substitution of Eq. 8 into Eq. 9 gives
 |
(10) |
Equation 10 must be used recursively, i.e., one must start with an element where vl (or vr) is known and then move right (or left) to the adjacent element and use: vl of the adjacent element must equal vr of the previous element, etc. Thus, this scheme allows the tangential velocity component to be calculated everywhere between two neighboring isointensity contours provided the tangential motion is known at one location inside the two contours.
FIGURE 1.
Construction used to show brightness of a moving element is conserved. A closed curve C enclosing an image area A at time t deforms to another closed curve C′, which encloses an image area A′ at time t + δt. Note that a′ denotes the area outside of C and inside of C′, whereas a denotes the area inside of C and outside of C′.
FIGURE 2.
Area element bounded by two neighboring isointensity contours. Solid contours are in image frame 1; dashed contours are in frame 2.
COMPUTATIONAL METHOD
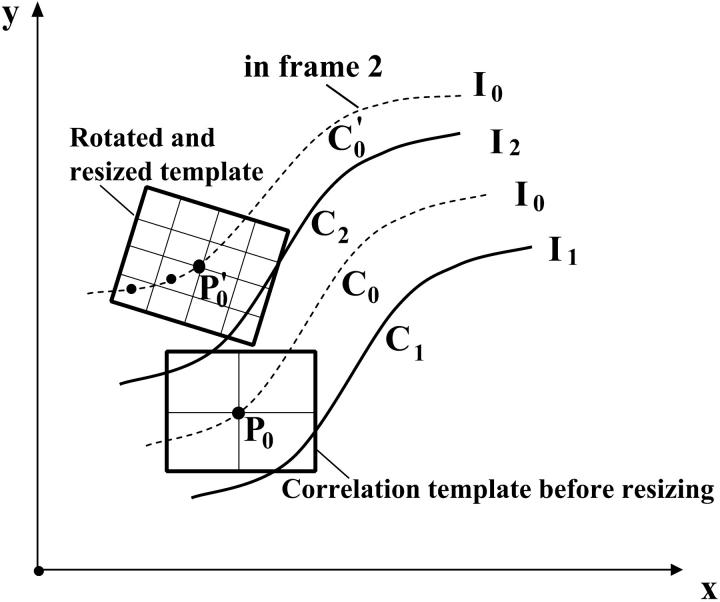
We use MATLAB Image Processing Toolbox (Mathworks, Natick, MA) to implement our Lagrangian algorithm. A key problem is to estimate the motion at one location between two neighboring isointensity contours. For this we use a rotated correlation along a limited portion of the isointensity contour rather than the traditional cross-correlation. In Fig. 3, the middle curve (C0) has the average intensity value of the two neighboring isointensity contours C1 and C2 having respectively intensity values I1 and I2: I0 = 0.5·(I1 + I2). Point P0 will move along the isointensity contour  having the intensity value I0 in frame 2. Because the motion in the hemicochlea is typically less than a pixel, we only need check the points of a limited portion of
  , which are nearest to P0, and we use MATLAB subroutine (imresize) to resize the operating blocks of the two images using bicubic interpolations. Thus we do not need to calculate the cross-correlation values of a larger rectangular matching area surrounding P0 in frame 2. However, complex rotational motion may be present in the cochlea. To allow for that, we rotate the correlation template and take the maximum correlation value as the matching number for each estimating point in frame 2 along the limited portion of the
  (Fig. 3). Finally, the best point is chosen as the point having the maximum matching number. Note that the correlation value for a given point in frame 2 is calculated as the weighted sum of neighboring pixels as the template from frame 1 is moved along the limited portion of the
  We found that applying a traditional cross-correlation method to the entire image is very time consuming and error prone. We limit the correlation calculation in a small neighborhood (4 × 4 pixels) surrounding the estimated point and resize the image block nine times using the bicubic interpolation method. We take a 9 × 9 correlation template from the resized image block of frame 1 and rotate the matching area in frame 2 to involve the arbitrary complex rotation motion in the cochlea. We try to choose initial points where the direction of motion might be known, e.g. near the probe. If the computed correlation value is less than 0.999 we reject the estimation and choose another point. Once we get the motion of an initial point between two neighboring isointensity contours we can estimate the velocity field everywhere along the isointensity contour using Eqs. 6 and 10. The algorithm seems to be quite robust with respect to which initial points are selected. Forward and backward computation from the two ends of isointensity contours give similar results. The difference in intensity values of two neighboring isointensity contours is taken as δI = 0.01 on a normalized intensity range of 0 ∼ 1. δI determines the height (H) of the area elements (2 ∼ 4 pixels). The length of the elements is taken to be about L = 1.5H (3 ∼ 6 pixels).
FIGURE 3.
Rotated-correlation method along a limited portion of the isointensity contours. C1 and C2 have the intensity values I1 and I2 respectively. C0 is the middle curve having the average intensity value of C1 and C2. The correlation template in frame 1 is rotated to match the points along isointensity contour  in frame 2, which has the same intensity value as C0 in frame 1. The displacement of
  relative to C0 has been exaggerated for clarity.
Note that when treating the video images from the hemicochlea preparation, the isointensity contours can be very noisy. To avoid noisy contours we first smooth the images with a Gaussian filter of size 9 × 9 pixels with a standard deviation σ = 3 pixels.
VALIDATION OF THE LAGRANGIAN METHOD
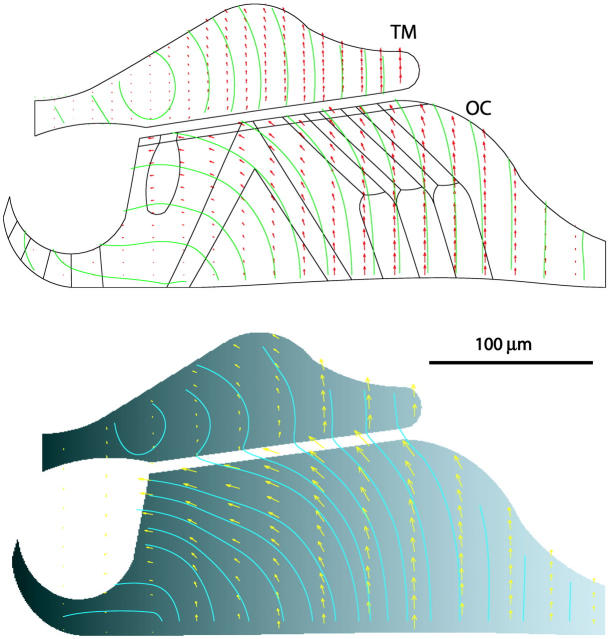
To qualitatively validate our method, we prepared two image frames from our calculations of the vibrational deformation in a cross section of the organ of Corti and tectorial membrane in the mammalian cochlea (Cai and Chadwick, 2003) as follows: frame 1 is obtained by defining intensity values at the node points of the finite element mesh I1(xi, yi) = ci. Each node point is considered as a moving particle that retains its intensity value when it moves. Thus we get frame 2, one-tenth of a cycle later, by applying the calculated displacement field (Ui and Vi) to every node point (I2(xi + Ui, yi + Vi) = ci). These intensity values at node points are interpolated to a rectangular grid and normalized to be between 0 and 1 to get two gray level images. For simplicity we let ci = xi to get a purely horizontal gradient image for frame 1. The optical flow between these two image frames satisfies the intensity conservation and incompressibility conditions because the motion was constrained to be incompressible in the finite element model. Fig. 4 (top) shows the known velocity field of our finite element model (Cai and Chadwick, 2003). The optical flow results using the Lagrangian approach are shown in Fig. 4 (bottom). They qualitatively agree quite well with the known velocity field in Fig. 4 (top). We also calculated optical flow fields using vertical and curved gradient images and obtain similar results. The Lucas and Kanade algorithm does poorly on these synthetic images because of the paucity of edges.
FIGURE 4.
(top) Known velocity field calculated from the vibrational deformation in a cross section of the organ of Corti (OC) and tectorial membrane (TM). The black line inside the organ of Corti (OC) are the boundary segments of the discrete cellular structures. (bottom) Optical flow field computed from two successive synthetic images using Lagrangian approach. Green lines are streamlines. Local velocity is tangent to these streamlines. The size and direction of the arrows indicate motion amplitude and direction respectively.
The above synthetic images are devoid of noise. To quantitatively validate our method for real images that are not noise free, we apply complex computer-generated artificial displacements to a real image from the hemicochlea preparation (Fig. 5 top). Fig. 5 (bottom) shows the comparison of calculated optical flow field (blue arrows) with the known computer-generated motion (red arrows). The known displacements are interpolated from rectangular grids to the mesh grids along the isointensity contours in the Lagrangian method.
FIGURE 5.
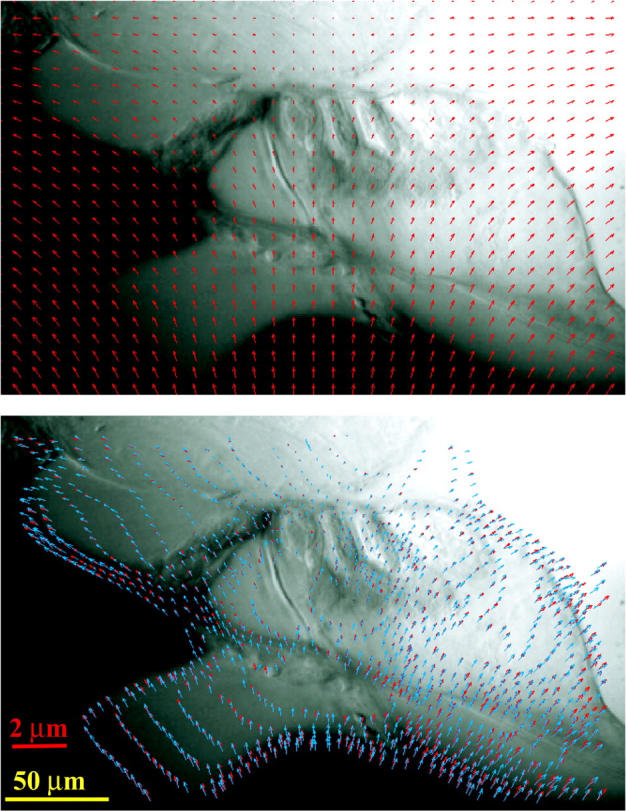
(top) Computer-generated motion field of a real image from the hemicochlear preparation. (bottom) Comparison of calculated optical flow field (blue arrows) with computer-generated artificial displacements (red arrows). The known motion fields are interpolated from rectangular grids to the mesh grids along the isointensity contours in the Lagrangian method, to generate a top-on-top plot. The yellow and red scale bars are for the image and the displacement arrows, respectively.
Barron et al. (1994) evaluated nine optical flow algorithms and concluded that the algorithm based on Lucas and Kanade (1981) had the best performance. Table 1 shows the performance comparison of our Lagrangian method with Lucas and Kanade algorithm. In terms of average absolute angular error (AAAE), average magnitude of vector difference (AMoVD) and average error normal to gradient (AENtG), our Lagrangian method has better performance than the Lucas and Kanade algorithm. Furthermore our Lagrangian method maintains better performance when the motion becomes smaller: the AAAE of Lucas and Kanade algorithm increases when the motion becomes smaller. In Table 1, LK(S) and LK(L) denote Lucas and Kanade algorithm applied to small and large motion, respectively, whereas Lag(S) and Lag(L) denote our Lagrangian method applying to small and large motion, respectively. Here small motion implies the maximum displacement is less than one pixel (0.75 pixel), whereas large motion implies that the maximum displacement is larger than one pixel (1.5 pixel). Our Lagrangian method provides reliable results (AAAE < 10°) for motions in the range 0.05–7.5 pixels.
TABLE 1.
Performance comparison of Lagrangian method with Lucas and Kanade algorithm
| LK(S) | Lag(S) | LK(L) | Lag(L) | |
|---|---|---|---|---|
| AAAE (°) | 21.3 | 7.3 | 14.9 | 7.9 |
| AMoVD (pixels) | 0.47 | 0.086 | 0.57 | 0.15 |
| AENtG (pixels) | 0.34 | 0.05 | 0.39 | 0.12 |
AAAE → Average absolute angular error.
AMoVD → Average magnitude of vector difference.
AENtG → Average error normal to gradient (sensitivity to “aperture problem”).
APPLICATION OF THE LAGRANGIAN METHOD TO THE HEMICOCHLEA
We applied our Lagrangian method to two pairs of video images from the hemicochlea preparation. The method of producing a hemicochlea and obtaining video images is described elsewhere (Richter and Dallos, 2001). Here we briefly describe the method. A hemicochlea is produced from a gerbil cochlea. After killing the animal, the bullae are removed and the cochleae are exposed. Next, one of the cochleae is mounted in a vibratome, and the cochlea is cut along its midmodiolar plane. One of the resulting halves (hemicochlea) is used for experiments. After mounting the cochlea on the stage of a microscope, pictures of the preparation are taken with a charge-coupled device camera, while a mechanical stimulus is applied to the tissue via a piezo-driven paddle placed below the basilar membrane in the fluids of scala tympani. Vibrations of the paddle are coupled via the fluids to the basilar membrane and 18 “snapshots” of the preparation are taken during one cycle of the vibration. Because the frequencies of the vibration are higher than the video frequency (30 Hz), strobed illumination of the hemicochlea preparation was used to acquire the images.
Light emitting diodes (LEDs) were placed under the microscope's condenser, such that oblique illumination of the hemicochlea preparation was achieved. The use of LEDs allowed also to strobe the light during data acquisition. Times to switch the diodes on and off were determined with custom written software (Hu, 1998) in conjunction with an electronic counter. In other words, the temporal relation of the light pulses from the LEDs relative to the mechanical stimulation of the preparation was kept steady for a number of cycles. During this time the shutter of the video camera was kept open. After a selected number of cycles a gating signal was sent to the video camera, the shutter was closed and the frozen video frame was transferred to the computer. Thereafter, the phase of the light pulse was increased by 20° and the integration and transfer process was repeated for this phase. Thus, 18 frames were captured during one stimulus cycle.
The duration of the light pulse was adjusted to 1/100 of the mechanical vibration period. Consequently, the integration time to capture the image decreases with increasing frequency. Therefore, the number of cycles used to capture one frame was adjusted between 30 and 300 cycles.
Limitations for the strobing system arise from the switching times of the electronic circuits and the LEDs. Run-of-the-mill transistor-transistor logic components have switching time of 20 ns, which translate to 10 MHz. Moreover, the LEDs have a nominal operating frequency of 50 MHz. Consequently, these values pose no difficulty to acquire frequencies in the range of 20 Hz–60 kHz, the hearing range of the gerbils.
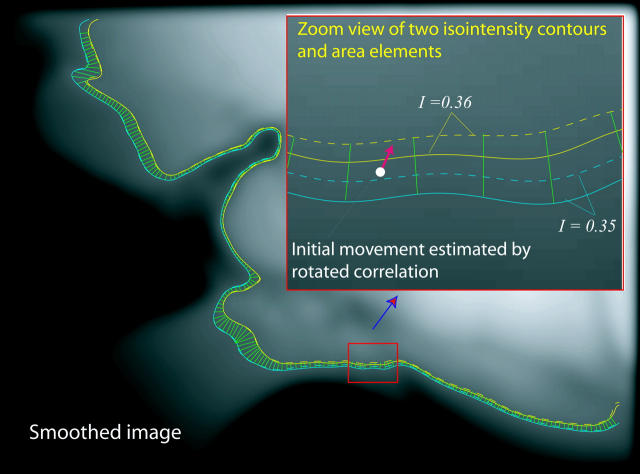
Fig. 6 illustrates the segmentation of isointensity contours and the single element whose motion is estimated as part of the Lagrangian method on a smoothed hemicochlea image. Fig. 7 shows the computed optical flow field for a hemicochlea stimulated at 1800 Hz from which we can analyze the detailed deformations within the tectorial membrane and the organ of Corti. A shear motion exists between the lower surface of the TM and reticular lamina (RL), which is crucial for the bending of the stereocilia of the outer hair cells (OHCs). The TM-RL shear motion is essentially induced by the radial movement of the RL. When the probe (P) moves upwards, the basilar membrane also moves upwards, and the tunnel of Corti (TC) rotates about the foot plate (FP) of the inner pillar cell, causing a counterclockwise rotation of the inner hair cells (IHCs), which could play a role in the bending of their stereocilia.
FIGURE 6.
Two neighboring isointensity contours and area elements in the image of the hemicochlea preparation. Solid contours are in image frame 1; dashed contours are in frame 2.
FIGURE 7.
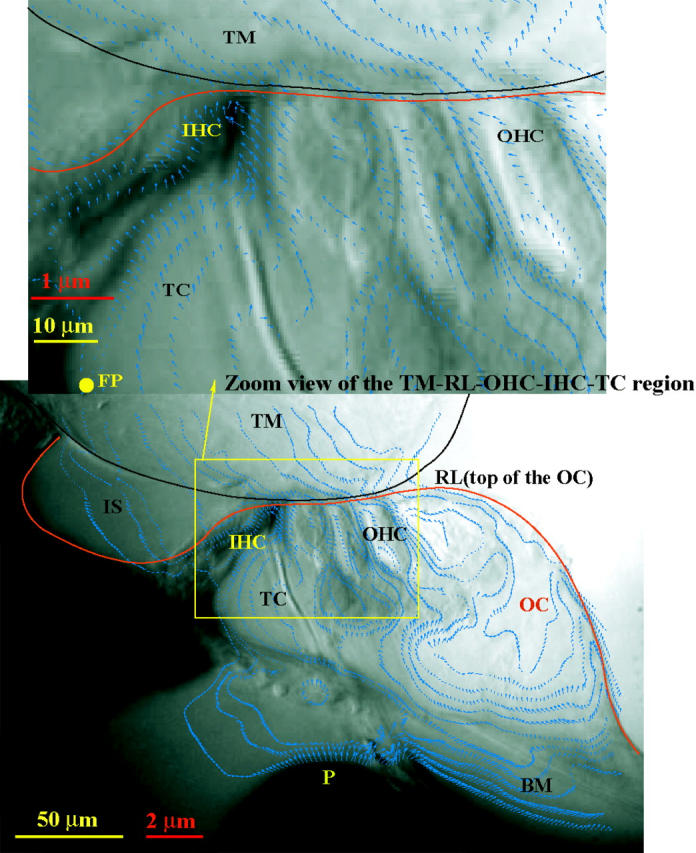
Optical flow field computed from two video images of the hemicochlea preparation excited at 1800 Hz by a piezo-driven probe (P). The yellow and red scale bars are for the image and the displacement arrows, respectively. Abbreviations are IHC: inner hair cell, OHC: outer hair cell, TM: tectorial membrane, OC: organ of Corti, RL: reticular lamina, BM: basilar membrane, TC: tunnel of Corti, IS: inner sulcus, FT: foot plate of the inner pillar cell.
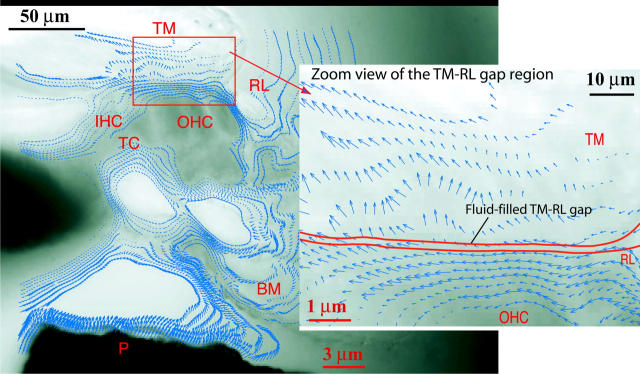
Fig. 8 shows the computed velocity field for a hemicochlea stimulated at 1 kHz. From the zoom view of the tectorial membrane-reticular lamina gap region on the right, we see once again that there is a relative shear displacement between the lower surface of the TM and RL (the top of the organ of Corti). The Lucas and Kanade algorithm produces far less velocity vectors on similar images (Hu et al., 1999).
FIGURE 8.
Optical flow field recovered from two video images of the hemicochlea preparation excited at 1 kHz by a piezo-driven probe (P). The zoom view of the TM-RL gap region shows that there is a shear movement between the tectorial membrane (TM) and the reticular lamina (RL), the top of the organ of Corti (OC). The black and red scale bars are for the image and the displacement arrows, respectively. Other abbreviations are: IHC: inner hair cell; OHC: outer hair cell; BM: basilar membrane; TC: tunnel of Corti.
DISCUSSION
Existing optical flow techniques can be classified as gradient-based (differential) methods (Horn and Schunck, 1981; Lucas and Kanade, 1981; Nagel, 1983; Uras et al., 1988), template-based (region matching) methods (Anandan, 1989; Singh, 1990), energy-based method (Heeger, 1987) and phase-based methods (Waxman et al., 1988; Fleet and Jepson, 1990). Barron et al. (1994) evaluated these methods and concluded that the Lucas and Kanade algorithm has the best performance. More recently (Miller et al., 1999), Lagrangian deformable template methods with continuum mechanical constraints have been developed for landmark and image matching. These methods differ from the present work in that they rely more extensively on optimization, and they have not been applied to optical flow. In this paper, we develop a new, fast, and efficient geometry-based approach for estimation of incompressible optical flow. Our Lagrangian method has a better performance than the Lucas and Kanade (LK) algorithm when it is applied to the image sequences from hemicochlea preparation, where motions are complex and extremely small (less than a pixel). In our approach, we take the incompressible nature of the motion into consideration and avoid the calculation of the spatiotemporal derivatives of the images, which are often nearly singular in large regions of the images. Furthermore our method also avoids both the well-known “aperture problem” (Marr, 1982) and the need for high-contrast edges. Consequently, more arrows can be calculated in the image field than using previous methods.
Because of the difficulty of visualization within the cochlear duct, our knowledge about the detailed deformations within the OC and at the TM-RL gap is incomplete. Hu et al. (1999) essentially calculated the motion arrows at the edges of structures and limited to very low frequencies (1–2 Hz). Similar to the observations of Hu et al. (1999), our optical flow results show that the organ of Corti transforms basilar membrane vibration into a shearing stimulus at the apices of outer hair cells. The relative shear movement is mainly induced by the radial motion of the reticular lamina, with a little contribution from the TM. Ulfendahl et al. (1995) found similar results. However, this doesn't support the idea of TM radial resonance, the “second filter” proposed originally by Zwislocki and Kletsky (1979) and Allen (1980) and observed experimentally by Gummer et al. (1996) and Hemmert et al. (2000). Furthermore, the deformations within the OC and TM are very complex, and we find a significant radial motion of the inner hair cell body, which is caused by the rotation of the tunnel of Corti about the lower end of the inner pillar cell.
Acknowledgments
The authors thank E. K. Dimitriadis, K. H. Iwasa, and B. Shoelson for their helpful comments.
Claus-Peter Richter was supported by the National Science Foundation (IBN-0077 476).
References
- Allen, J. B. 1980. Cochlear micromechanics: a physical model of transduction. J. Acoust. Soc. Am. 686:1660–1670. [DOI] [PubMed] [Google Scholar]
- Anandan, P. 1989. A computational framework and an algorithm for the measurement of visual motion. Int. J. Comp. Vision. 2:283–310. [Google Scholar]
- Barron, J. L., D. J. Fleet, and S. S. Beauchemin. 1994. Performance of optical flow techniques. Int. J. Comp. Vision. 12:43–77. [Google Scholar]
- Cai, H., and R. S. Chadwick. 2003. Radial structure of traveling waves in the inner ear. SIAM J. Appl. Math. 634:1105–1120. [Google Scholar]
- Fleet, D. J., and A. D. Jepson. 1990. Computation of component image velocity from local phase information. Int. J. Comp. Vision. 5:77–104. [Google Scholar]
- Gummer, A. W., W. Hemmert, and H. Zenner. 1996. Resonant tectorial membrane motion in the inner ear: its crucial role in frequency tuning. Proc. Natl. Acad. Sci. USA. 93:8727–8732. [DOI] [PMC free article] [PubMed] [Google Scholar]
- Heeger, D. J. 1987. Model for the extraction of image flow. J. Opt. Soc. Am. A4:1455–1471. [DOI] [PubMed] [Google Scholar]
- Hemmert, W., H. P. Zenner, and A. W. Gummer. 2000. Three-dimensional motion of the organ of Corti. Biophys. J. 78:2285–2297. [DOI] [PMC free article] [PubMed] [Google Scholar]
- Horn, B. K. P., and B. G. Schunck. 1981. Determining optical flow. Artif. Intell. 17:185–204. [Google Scholar]
- Hu, X. 1998. A computer vision study on cochlear micromechanics. Dissertation. Northwestern University, Evanston, IL.
- Hu, X., B. N. Evans, and P. Dallos. 1999. Direct visualization of organ of Corti kinematics in a hemicochlea. J. Neurophysiol. 82:2798–2807. [DOI] [PubMed] [Google Scholar]
- Karamcheti, K. 1966. Principles of Ideal-Fluid Aerodynamics. John Wiley & Sons, New York.
- Karavitaki, K. D., and D. C. Mountain. 2003. Is the cochlea amplifier a fluid pump? In Biophysics of the Cochlea: From Molecules to Models. A. W. Gummer, editor. World Scientific, Singapore. 310–311.
- Li, H., J. Liu, and W. Gu. 2000. A new and fast approach for DPIV using an incompressible affine flow model. Machine vision and applications. 11:252–256. [Google Scholar]
- Lucas, B. D., and T. Kanade. 1981. An iterative image registration technique with an application to stereo vision. Proc. DARPA IU Workshop. 121–130.
- Marr, D. 1982. Vision. W. H. Freeman and Co., New York. 165–167.
- Miller, M. I., S. C. Joshi, and G. E. Christensen. 1999. Large deformation fluid diffemorphisms for landmark and image matching. In Brain Warping. A. Toga, editor. Academic Press, San Diego. 115–132.
- Nagel, H.-H. 1987. Displacement vectors derived from second-order intensity variations in image sequences. CGIP. 21:85–117. [Google Scholar]
- Richter, C. P., B. N. Evans, R. Edge, and P. Dallos. 1998. Basilar membrane vibration in the gerbil hemicochlea. J. Neurophysiol. 79:2255–2264. [DOI] [PubMed] [Google Scholar]
- Richter, C. P., and P. Dallos. 2001. Physiological and Psychophysical Bases of Auditory Function. Shaker Publishing, Maastricht. 44–49.
- Singh, A. 1992. An estimation-theoretic frame work for imageflow computation. Proc. IEEE ICCV, Osaka. 168–177.
- Ulfendahl, M., S. M. Khanna, and C. Heneghan. 1995. Shearing motion in the hearing organ measured by confocal laser heterodyne interferometry. Neuroreport. 6:1157–1160. [DOI] [PubMed] [Google Scholar]
- Uras, S., F. Girosi, A. Verri, and V. Torre. 1998. A computational approach to motion perception. Biol. Cybern. 60:79–97. [Google Scholar]
- Waxman, A. M., J. Wu, and F. Bergholm. 1988. Convected activation profiles and receptive fields for real time measurement of short range visual motion. Proc. IEEE CVPR, Ann Arbor. 717–723.
- Zhou, Z., C. E. Synolakis, and R. M. Leahy. 1995. Calculation of 3D internal displacement fields from 3D X-ray computer tomographic images. Proc. R. Soc. Lond. A. 449:537–554. [Google Scholar]
- Zwislocki, J. J., and E. J. Kletsky. 1979. Tectorial membrane: a possible effect on frequency analysis in the cochlea. Science. 204:639–641. [DOI] [PubMed] [Google Scholar]


