

Abstract
We have developed a novel, spectroscopic technique for high-sensitivity, label-free DNA quantification. We demonstrate that an optical resonance (whispering gallery mode) excited in a micron-sized silica sphere can be used to detect and measure nucleic acids. The surface of the silica sphere is chemically modified with oligonucleotides. We show that hybridization to the target DNA leads to a red shift of the optical resonance wavelength. The sensitivity of this resonant technique is measured as 6 pg/mm2 mass loading, higher as compared to most optical single-pass devices such as surface plasmon resonance biosensors. Furthermore, we show that each microsphere can be identified by its unique resonance wavelength. Specific, multiplexed DNA detection is demonstrated by using two microspheres. The multiplexed signal from two microspheres allows us to discriminate a single nucleotide mismatch in an 11-mer oligonucleotide with a high signal-to-noise ratio of 54. This all-photonic whispering gallery mode biosensor can be integrated on a semiconductor chip that makes it an easy to manufacture, analytic component for a portable, robust lab-on-a-chip device.
INTRODUCTION
With genomes of many species completed, we are at the beginning of a revolution in genetic analysis. Technological advances of the recent years have made this revolution possible by replacing labor-intensive, traditional biochemical methods with automated nucleic acid analysis techniques (Jaklevic et al., 1999; Marshall and Hodgson, 1998). To exploit the vast amount of genetic information for medical diagnostic purposes, food testing, forensic sciences, and environmental monitoring (Anderson et al., 2000; Christopoulos, 1999; Fortina et al., 2002; Luong et al., 1997; Pearson et al., 2000), it is necessary to further miniaturize and integrate DNA/RNA analysis techniques into robust and easy to manufacture lab-on-a-chip and micro total analysis systems.
Gene chips provide a means for high-throughput DNA screening using oligonucleotide arrays. Although already commercialized, this new technology still faces important challenges. The need for target labeling can change the relative levels of targets originally present. Acquisition and analysis of the fluorescent image is technically involved and limits the use of the DNA chip technology as the analytic part of a small, portable, and robust lab-on-a-chip device.
Biosensors most frequently used for label-free DNA detection are based on optical methods (Baird and Myszka, 2001; Rich and Myszka, 2002) such as highly sensitive interferometric devices (Li et al., 2003; Lin et al., 1997) and surface plasmon resonance sensors (SPR) which are the most prominent ones (Bates et al., 2002; Bianchi et al., 1997; Jensen et al., 1997; Malmqvist, 1993; Minunni et al., 2001; Persson et al., 1997). The SPR technique with a detection limit >10 pg/mm2 mass loading is very sensitive (Karlsson and Stahlberg, 1995) and allows real-time detection of biomolecular interactions. The instrumentation, however, is of considerable size and the ability for multiplexed measurements is limited.
We present a novel, spectroscopic detection principle, which combines the advantages of label-free, high-sensitivity DNA quantification with the capability for multiplexed measurements on a simple platform. As compared to existing optical biosensors (such as SPR biosensors) where the light is passed through the sample only once, we demonstrate the use of optical resonances for quantitative DNA measurements. Optical resonances allow the light to interact with an analyte molecule several thousand times, thus increasing the ultimate detection limit by several orders of magnitude as compared to single-pass techniques. Indeed, we are able to demonstrate a sensitivity that is greater than that of commercially available SPR devices.
We excite optical resonances in dielectric microspheres, which are the ideal choice for an optical cavity because of their ability to confine light over longest time periods (high-Q) in a small volume (Collot et al., 1993; Gorodetsky et al., 1996). It has been estimated that a single macromolecule can lead to a detectable perturbation of such a high-Q cavity (Arnold et al., 2003). Recently it has been shown that such high-Q resonators can be integrated on a chip (Armani et al., 2003), which makes our sensing technique an interesting analytic component for a small and robust lab-on-a-chip device.
In this article we demonstrate that DNA hybridization on a silica microsphere surface can be quantified from the red shift of an optical resonance wavelength. Using a previously developed analytic theory (Arnold et al., 2003; Teraoka et al., 2003; Vollmer et al., 2002), we are able to determine the surface density of bound DNA target molecules. We furthermore show that each microsphere can be identified by its unique resonance wavelength. Using two microspheres, we demonstrate multiplexed DNA detection and the ability to discriminate a single nucleotide mismatch in an 11-mer oligonucleotide.
EXPERIMENTAL PROTOCOL
Experimental setup and data acquisition
Fig. 1 A shows the schematic of the experiment. Light from a tunable, distributed feedback laser diode (1312.8 nm nominal wavelength, 5 mW, ML776H11F, Mitsubishi, Hyogo, Japan) is coupled into a single-mode, smf-28 optical fiber (Canadian Instrumentation & Research, Burlington, Ontario, Canada) using a single-mode fiber coupler (F-1015LD, Newport, Irvine, CA). To reduce back-reflections into the laser cavity, the optical fiber ends in a glass capillary tube that is beveled at an angle of 8°. The laser diode is held at constant temperature (laser diode mount LDM-4407, ILX Lightwave, Bozeman, MT). An InGaAs photodetector (PDA400, Thorlabs, Newton, NJ) records the intensity of transmitted light for different wavelengths at the other fiber end. The wavelength of the infrared laser is scanned across a spectral width of only 0.14 nm by tuning the laser diode current (precision current source LDX-3525, ILX Lightwave) with the sawtooth-shaped output of a function generator at 100 Hz (Hewlett Packard 33120A). The tuning constant of the laser diode has been determined as 0.01 nm/mA using a wavemeter (WA-1150, Burleigh, Vanier, Quebec, Canada). The spectrum is digitally recorded (data acquisition card PCI-6036E, National Instruments, Austin, TX) at a resolution of 0.14 × 10⁻³ nm. A LabVIEW program (National Instruments) triggered by the TTL signal of the function generator controls and displays the data acquisition process. The LabVIEW program localizes the Lorentzian-shaped dips in the intensity spectrum by a parabolic minimum fit using typically 11 points (which cover a spectral width of 1.5 × 10⁻³ nm).
FIGURE 1.
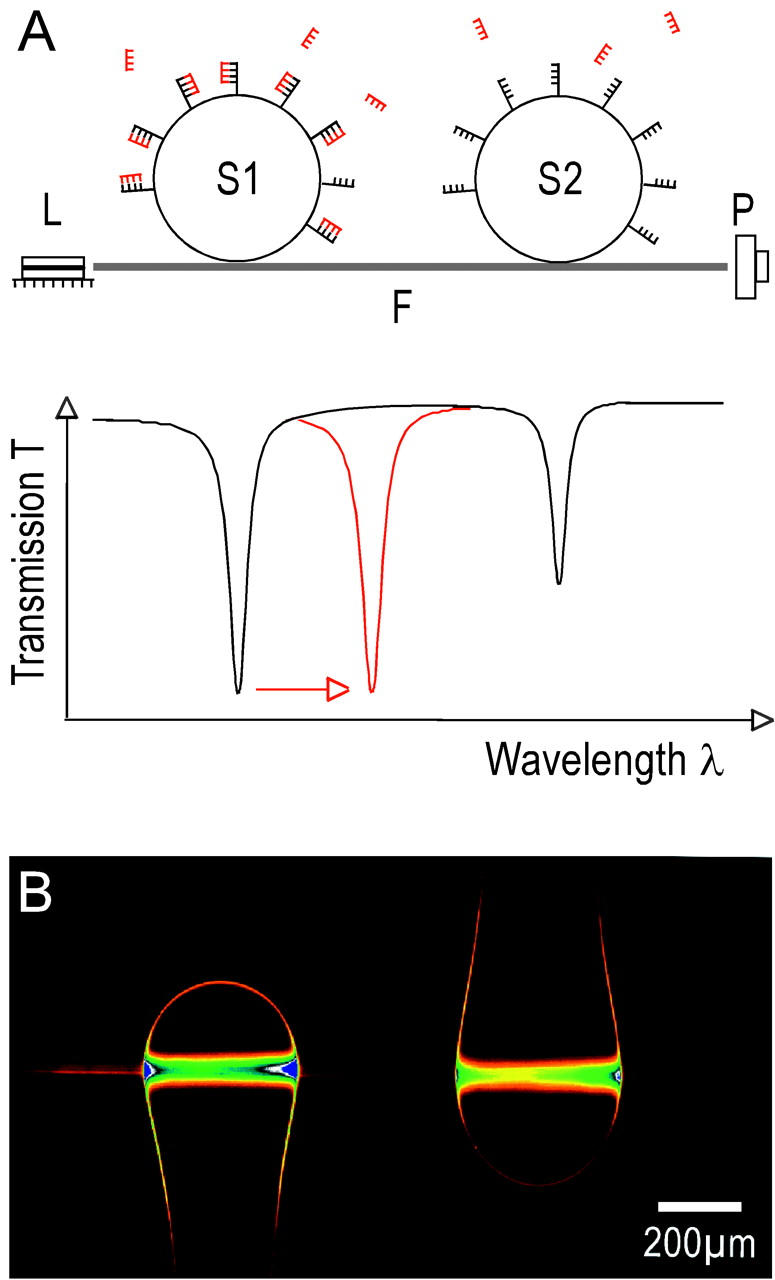
Experimental setup. (A) Light from a laser diode is transmitted through a single-mode optical fiber, F. Two silica microspheres, S1 and S2, are evanescently coupled to the fiber. A photodetector, P, records the intensity at the other fiber end. Optical resonances (WGMs) from each sphere are identified as Lorentzian-shaped dips in the transmission spectrum. Each sphere, S1 and S2, is modified with a different oligonucleotide of interest. The hybridization event of the complementary, label-free oligonucleotide on sphere S1 is detected in real time with millisecond time resolution by an increase of the S1-specific resonance wavelength. This leads to a shift of the S1-specific resonance position (red line). (B) Micrograph of two spheres coupled to the optical fiber running horizontally through the center of the image. The image shows two resonances of light orbiting inside each sphere.
Fiber-sphere coupling
The spheres are coupled evanescently to the optical fiber. To access the evanescent field of the light traveling down the optical fiber, the polymer sheet of the fiber is dissolved and removed using methylenechloride. The bare silica fiber is then cleaned with 70% ethanol before etching in 25% hydrofluoric acid for ∼4½ h. The etching process is monitored with a 20× microscope. The etching is stopped with NaHCO3 solution as soon as the fiber diameter reaches 4 μm (the fiber core diameter is 6.6 μm). The spheres are held in place with separate x-y-z stages that allows positioning them in contact with the etched part of the optical fiber. Coupling occurs as soon as the evanescent field of the fiber and sphere overlap on mechanical contact. (If not mentioned otherwise, all chemicals were purchased from Sigma-Aldrich, Milwaukee, WI.)
Sphere fabrication and surface modification
The spheres (∼200 μm radius) are fabricated by melting the tip of a stripped single-mode near-infrared optical fiber (125 μm diameter, FS-SC-6324, Thorlabs) in a butane/nitrous oxide microtorch flame (McMaster-Carr, Atlanta, GA). Surface tension forms the melted tip of the silica fiber into a spheroidal-shaped object (Fig. 1 B). The unmelted part of the fiber provides a useful stem for mounting the sphere on the x-y-z stage. After melting, the spheres are cleaned immediately by high-power oxygen plasma etching (plasma cleaner PDC-32G, Harrick, Ossining, NY) for 4 min. They are then immersed in a 4 μl hanging drop of a dextran-biotin solution (10 mg/ml, Sigma, St. Louis, MO) until dry, thus forming a dextran-biotin hydrogel on the sphere surface. After brief rinsing in water for ∼5 min, they are then incubated until dry in a hanging drop of 4 μl of a 7 μM solution of biotinylated oligonucleotides (Qiagen Operon, Alameda, CA), coupled to streptavidin (recombinant, E.coli, Sigma) at a molar ratio of 2:1. The spheres can be stored in the dry state for weeks. After brief dipping in water, the spheres are used immediately. Other oligonucleotides are also obtained from Qiagen Operon.
Fluorescent imaging of whispering gallery modes
In this case, the light from a 635 nm red laser diode (Sanyo DL3038-011, Thorlabs) is coupled into an SM-600 single-mode fiber (Canadian Instrumentation & Research). Evanescent coupling to the fiber is achieved as described before except that the SM-600 fiber is etched down to a final diameter of 2 μm. The spheres are immersed in a fluorophore solution (Cy5, Molecular Probes, Eugene, OR) diluted 1:100 from the stock in phosphate-buffered saline (PBS). The spheres are imaged on a cooled charge-coupled device camera (SensiCam, Cooke, Auburn Hills, MI) using an emission filter (D680/30M, Chroma Technology, Brattleboro, VT) and a standard 6× objective.
Analytic theory
An analytic theory had been developed that describes the shift of a whispering gallery mode (WGM) due to binding of polarizable molecules to the surface of the microsphere (Arnold et al., 2003). For the binding of DNA to the sphere surface, we find the fractional shift of a resonance wavelength δλ/λ = αexσs/[ɛ0(ns2 − nb2)R], where ɛ0 is the vacuum permittivity, R is the microsphere radius (200 μm), and ns (1.467) and nb (1.332) are the refractive indices of the sphere and the buffer solution, respectively. αex is the excess polarizability (the polarizability in excess of an equal volume of water) and σs is the surface density of the bound DNA.
The fractional shift in wavelength for a single DNA molecule (Arnold et al., 2003) binding on the surface of the sphere directly above the resonant light orbit (Fig. 1 B) is calculated as (δλ/λ)s = αex|Y|2/[ɛ0(ns2 − nb2)R3], where Y is the spherical harmonic function describing the light orbit.
RESULTS
Setup for multiplexed DNA detection
Experiments were performed in a liquid sample cell (Vollmer et al., 2002) containing two silica spheres immersed in a buffer solution and evanescently coupled (Griffel et al., 1996; Laine et al., 1999; Serpenguezel et al., 1995) to the same single-mode, near-infrared optical fiber (Fig. 1 A). Infrared light from a tunable laser source was coupled into one end of the fiber. A photodetector recorded the intensity of transmitted light for different wavelengths at the other fiber end. The resonances from each sphere are separated by several linewidths, which makes it possible to identify them independently as Lorentzian-shaped dips in the spectrum of the transmitted light. Oligonucleotides of different sequences were immobilized to the surface of each sphere (Gregorius et al., 1995). The binding of the unlabeled complementary oligonucleotide to its surface-immobilized counterpart was measured in real time from a red shift of the sphere-specific WGM resonance (Fig. 1 A). The single-strand DNA diffuses to the sphere surface where it hybridizes to its complement. Close to the sphere surface, the oligonucleotide interacts with the evanescent field of the WGM, which extends about a wavelength into the buffer solution. This interaction polarizes the molecule and thus increases the resonance wavelength of the mode (Arnold et al., 2003; Teraoka et al., 2003; Vollmer et al., 2002). Fig. 1 B is a fluorescent image that illustrates light orbits in two microspheres. In this case, the WGMs of the spheres were excited by a red laser. The spheres were immersed in a fluorophore solution. The fluorescent intensity emitted due to the microsphere resonance compared to the intensity emitted due to the evanescent field of the eroded optical fiber shows the enhancement of the fluorescent excitation with the high-Q spherical microcavity (Krioukov et al., 2002b).
Two-sphere multiplexing
First, we coupled one then both spheres to the fiber. The spheres were held in place by separate x-y-z stages that allowed independent coupling to the optical fiber. We observed no cross coupling between the WGMs of the two spheres that were located on the fiber several micrometers apart. Each sphere essentially removes energy independently from the optical fiber at its resonant wavelength (Fig. 2 A). Coupling strengths vary 30–70% resulting in different amplitudes of the resonance dips. The sequential coupling of two spheres to the fiber allows one to unambiguously identify resonances corresponding to each individual sphere. A parabolic minimum fit allowed us to determine the resonance position at the minimum in the transmission signal. With this detection scheme, we could determine the position of a resonance with a precision of almost two orders of magnitude higher than given by the linewidth.
FIGURE 2.
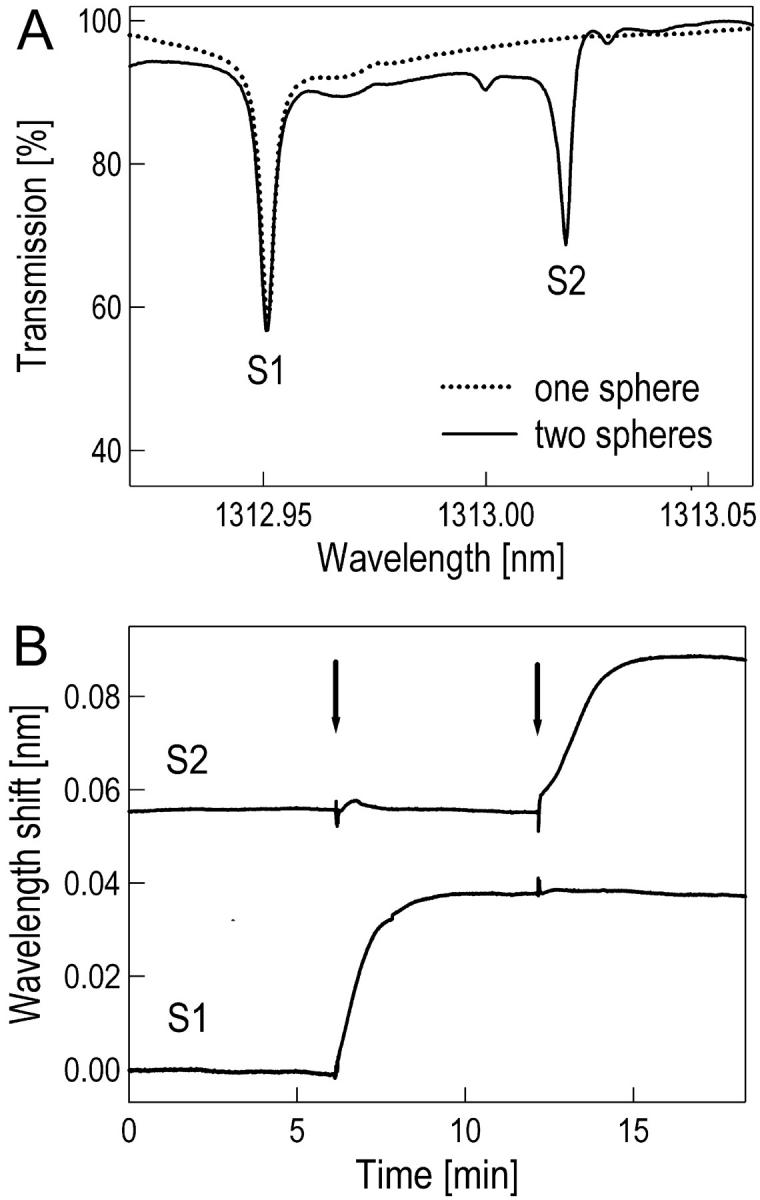
Multiplexed DNA detection. (A) Transmission spectrum for one (dotted line) and two (solid line) spheres coupled to the same optical fiber, immersed in a PBS solution at room temperature. Both spheres are ∼200 μm in radius. The narrow infrared spectrum ranging from 1312.92 to 1313.06 nm is recorded every 10 ms. The position of the resonance wavelengths from each of the spheres, S1 and S2, is located by a parabolic minimum fit in a resolution of ∼1/50 of the linewidth, allowing detection of a fractional wavelength change δλ/λ as small as ∼3 × 10⁻⁷. Both spheres were modified with unrelated, 27-mer oligonucleotides: S1 with 5′-biotin-TATGAATTCAATCCGTCGAGCAGAGTT, S2 with 5′-biotin-ATTAATACGACTCACTATAGGGCGATG. (B) Shows the time trace of the two resonance positions from S1 and S2. The arrows indicate when the two complementary DNA oligonucleotides are injected into the sample solution to a final concentration of 1 μM each. Hybridization saturates within minutes and the resonance wavelength of the corresponding sphere increased ∼0.038 nm each. The noise before adding the complementary DNA was only ∼0.04 × 10⁻³ nm.
High-sensitivity DNA detection
We demonstrate transduction of a specific hybridization event into an increase of a corresponding resonance wavelength in a measurement with two spheres, S1 and S2, each modified with a different 27-mer oligonucleotide. In the sample cell, the two spheres were equilibrated at room temperature in PBS (pH 7.4) until the resonance positions became stable and displayed no drifts (Fig. 2 B). Then, the oligonucleotide complementary to the one immobilized on sphere S1 was injected into the sample cell. This was followed minutes later by the injection of the oligonucleotide complementary to the DNA strand immobilized on sphere S2. The injected oligonucleotides diffused to the respective sphere surfaces and hybridized to their surface-bound target strands. A time trace of the two sphere-specific resonance positions allowed us to follow the two independent hybridization events (Fig. 2 B): after injection of the complementary oligonucleotide, the resonance wavelength of the corresponding sphere showed a large increase. There was no detectable unspecific hybridization in this experiment: one injected oligonucleotide increased only the resonance wavelength of the corresponding sphere whereas the resonance wavelength of the other sphere remained unchanged. The oligonucleotides were injected to a final concentration of 1 μM. Despite the rather large background concentration, the sequential injection of the second oligonucleotide produced a similar resonance wavelength shift as compared to the first injected oligonucleotide. The spikes shortly after the injections are due to temperature and refractive index fluctuations caused by turbulences after mixing with a hypodermic needle.
For the hybridization of the complementary 27-mer oligonucleotide, we measured a wavelength shift of ∼0.038 nm. An analytic theory that relates the wavelength shift of a WGM in a microsphere to the surface density of bound molecules had been developed previously (Arnold et al., 2003). For the 27-mer oligonucleotide with the excess polarizability (Nicolai et al., 1987) of 4πɛ0 × 4.8 × 10−22 cm3, we calculated the surface density of hybridized oligonucleotides as 3.6 × 10¹³ oligonucleotide targets/cm2.
Although the sphere surfaces were modified with a dextran hydrogel, the Q-factors of the WGMs were still on the order of 5 × 10⁵ and largely limited by overtone vibrational absorption of water near 1.3 μm. Given this high Q-factor, a sphere diameter of 200 μm, and the noise level that allows determining a wavelength shift with a precision of 1/50 of the linewidth, we calculate the limit of our measurement technique as ∼6 pg/mm2 nucleic acid mass loading (the analytic theory is described in the Experimental section).
The spheres were modified with a dextran hydrogel. The biotinylated dextran forms a three-dimensional matrix on the sphere surface. Every dextran molecule is modified with ∼7 biotin groups, thus increasing the surface density by several layers of streptavidin binding sites. We immobilized the 27-mer oligonucleotide probes on the biotin-dextran hydrogel as a streptavidin-DNA complex. Each streptavidin molecule was bound to two biotinylated 27-mer oligonucleotides. We measured a wavelength shift of 0.255 nm for the binding of the streptavidin-DNA complex to the surface immobilized, biotinylated dextran-hydrogel. With the excess polarizability of 4πɛ0 × 4.3 × 10−21 cm3 for the streptavidin-DNA complex, we estimated the density of immobilized oligonucleotide probes as 4.6 × 10¹³ oligonucleotide probes/cm2. By taking the ratio of the measured surface densities for the hybridized target strands and for the immobilized DNA probes, we find that 78% of the immobilized single-stranded DNA is accessible for hybridization.
Single nucleotide mismatch detection
Discrimination of a single nucleotide mismatch is an important analytic ability of any DNA biosensor. Detection of the mismatch is optimal at a specific temperature and salt concentration, which depends on the length of the oligonucleotide. We varied the salt concentration and determined with our setup the melting curves for match and mismatch hybridization of an 11-mer oligonucleotide on a single microsphere (Fig. 3). We found the hybridization signal from the matching sequence can be nearly 10 times as large as the one from the mismatching sequence if the experiments were performed in a 20 mM Tris buffer (pH 7.8) containing 30 mM NaCl at room temperature (∼23°C). We used these optimized conditions in a measurement with two spheres. Sphere S1 was modified with the perfectly matching 11-mer oligonucleotide sequence; S2 carried the single nucleotide mismatch sequence.
FIGURE 3.

Optimal monovalent salt concentration for mismatch discrimination. Microspheres were modified with an 11-mer oligonucleotide (5′-biotin-CTATCTCAGTC). Equilibrium resonance wavelength shifts were recorded after hybridization to the perfect match and to the 1 bp mismatch sequence (3′-GATATAGTCAG) at different NaCl concentrations. The fractional wavelength shift (normalized to the maximum shift at high salt concentrations) for the matching sequence is ∼10 times larger as compared to the mismatch sequence for an optimal NaCl concentration of ∼30 mM. Experiments were performed at room temperature in a 20 mM Tris buffer pH 7.4.
We traced two resonances from S1 and S2 over time (Fig. 4 A). As soon as temperature equilibration stabilized the traces, we injected an 11-mer DNA strand in the sample with a sequence that was complementary to the oligonucleotide immobilized on S1. Hybridization to the perfect match oligonucleotide on S1 produced a much larger increase in resonance wavelength compared to the signal from S2. Hybridization to the single mismatched sequence on S2 produced 1/10 of the increase, consistent with the hybridization data we obtained earlier in single-sphere experiments using the same experimental conditions. A plot of the difference signal shows unambiguous identification of a single nucleotide mismatch with a high signal-to-noise ratio of 54 (Fig. 4 B, signal-to-noise ratio is calculated by dividing the wavelength shift of the difference signal after hybridization by the noise before hybridization). Note that the initial disturbances in the single traces are largely removed in the difference plot.
FIGURE 4.

Single nucleotide mismatch detection. (A) Time traces of resonance wavelengths in two spheres, S1 and S2. S1 was modified with a biotinylated 11-mer oligonucleotide (5′-biotin-CTATCTCAGTC). The oligonucleotide immobilized on S2 differed by a single nucleotide (5′-biotin-CTATATCAGTC). The arrow indicates when the oligonucleotide complementary to the sequence immobilized on sphere S1 is injected to a final concentration of 1 μM. In equilibrium, the wavelength shift for the perfect match sequence is ∼10 times as large as the shift for mismatch sequence. (B) The difference signal allows one to identify a single nucleotide mismatch with a high signal-to-noise ratio of 54. Spikes due to transient temperature and refractive index fluctuations after injection and mixing are eliminated in the difference signal compared to the individual wavelength trace from each sphere.
DISCUSSION
In our measurements, we demonstrate that the perturbation of an optical microsphere resonator can be used for high-sensitivity, label-free DNA quantification. A mass loading of only ∼6 pg/mm2 of polarizable DNA material on the microsphere surface leads to a detectable spectroscopic shift of the resonance. The sensitivity is higher as compared to that of commercial available SPR biosensing devices (>10 pg/mm2, corresponding to 10 response units in a Biacore instrument (Biacore, Uppsala, Sweden)). There is no need for a label, which makes our analytic system more accurate and widely applicable as compared to fluorescent techniques.
We demonstrate the multiplexed detection of specific DNA sequences with two microspheres coupled to a common waveguide. The use of smaller microspheres or toroidal-shaped particles will increase the distance between adjacent resonance wavelengths (Ilchenko et al., 2001) and therefore coupling many microspheres to one waveguide in an array-type sensor can be realized. The silica microspheres can be replaced by silicon (Krioukov et al., 2002a), InP microdisks (Djordjev et al., 2002), or ultrahigh-Q toroid microcavities (Armani et al., 2003), thus allowing miniaturization into an integrated semiconductor device. This could lead to a compact, portable biosensor with spot dimensions on the order of a few micrometers, which makes our platform an ideal analytic component for a lab-on-a-chip system.
As demonstrated for a single nucleotide mismatch detection, difference measurements with the two spheres allow one to remove common mode noise in experiments. The increase of resonance wavelength in one of the spheres can be compared to the other sphere interacting with the same sample analyte but lacking a specific biological factor of interest. For molecular interaction studies, the first sphere could be modified with the recognition element, whereas the second sphere is not modified. The difference signal eliminates most of the noise due to unspecific binding, temperature, and refractive index fluctuations that may occur, e.g., after injection. Thermal drifts are intrinsically eliminated because the change in resonance wavelength due to thermal expansion/contraction is independent of the microsphere size.
Several of our measurement platforms could be connected to a network by end-to-end coupling of the optical fiber. Such a distributed sensor could easily cover a large sensing area such as the circumference of a lake.
Acknowledgments
We thank Mayumi Noto for useful discussions.
F.V. was supported by a fellowship of the Boehringer Ingelheim Fonds. D.B. was supported by a fellowship of the Deutsche Forschungsgemeinschaft. Research at Polytechnic University was supported by a National Science Foundation grant.
References
- Anderson, R. C., X. Su, G. J. Bogdan, and J. Fenton. 2000. A miniature integrated device for automated multistep genetic assays. Nucleic Acids Res. 28:E60. [DOI] [PMC free article] [PubMed] [Google Scholar]
- Armani, D. K., T. J. Kippenberg, S. M. Spillane, and K. J. Vahala. 2003. Ultra-high-Q toroid microcavity on a chip. Nature. 421:925–928. [DOI] [PubMed] [Google Scholar]
- Arnold, S., M. Khoshsima, I. Teraoka, S. Holler, and F. Vollmer. 2003. Shift of whispering gallery modes in microspheres by protein adsorption. Opt. Lett. 28:272–274. [DOI] [PubMed] [Google Scholar]
- Baird, C. L., and D. G. Myszka. 2001. Current and emerging commercial optical biosensors. J. Mol. Recognit. 14:261–268. [DOI] [PubMed] [Google Scholar]
- Bates, P. J., J. F. Reddoch, P. Hansakul, A. Arrow, R. Dale, and D. M. Miller. 2002. Biosensor detection of triplex formation by modified oligonucleotides. Anal. Biochem. 307:235–243. [DOI] [PubMed] [Google Scholar]
- Bianchi, N., C. Rutigliano, M. Tomassetti, G. Feriotto, F. Zorzato, and R. Gambari. 1997. Biosensor technology and surface plasmon resonance for real-time detection of HIV-1 genomic sequences amplified by polymerase chain reaction. Clin. Diagn. Virol. 8:199–208. [DOI] [PubMed] [Google Scholar]
- Christopoulos, T. K. 1999. Nucleic acid analysis. Anal. Chem. 71:425R–438R. [Google Scholar]
- Collot, L., V. Lefevre-Seguin, M. Brune, J. M. Raimond, and S. Haroche. 1993. Very high Q whispering-gallery mode resonances observed on fused silica microspheres. Europhys. Lett. 23:327–334. [Google Scholar]
- Djordjev, K., S. J. Choi, and P. D. Dapkus. 2002. CH4-based dry etching of high Q InP microdisks. J. Vac. Sci. Tech. B. 20:301–305. [Google Scholar]
- Fortina, P., S. Surrey, and L. J. Kricka. 2002. Molecular diagnostics: hurdles for clinical implementation. Trends Mol. Med. 8:264–266. [DOI] [PubMed] [Google Scholar]
- Gorodetsky, M. L., A. A. Savchenkov, and V. S. Ilchenko. 1996. Ultimate Q of optical microsphere resonators. Opt. Lett. 21:453–455. [DOI] [PubMed] [Google Scholar]
- Gregorius, K., S. Mouritsen, and H. I. Elsner. 1995. Hydrocoating: a new method for coupling biomolecules to solid phases. J. Immunol. Methods. 181:65–73. [DOI] [PubMed] [Google Scholar]
- Griffel, G., S. Arnold, D. Taskent, A. Serpenguezel, J. Connolly, and D. G. Morris. 1996. Morphology-dependent resonances of a microsphere-optical fiber system. Opt. Lett. 21:695–697. [DOI] [PubMed] [Google Scholar]
- Ilchenko, V. S., M. L. Gorodetsky, X. S. Yao, and L. Maleki. 2001. Microtorus: a high-finesse microcavity with whispering-gallery modes. Opt. Lett. 26:256–258. [DOI] [PubMed] [Google Scholar]
- Jaklevic, J. M., H. R. Garner, and G. A. Miller. 1999. Instrumentation for the genome project. Annu. Rev. Biomed. Eng. 1:649–678. [DOI] [PubMed] [Google Scholar]
- Jensen, K. K., H. Orum, P. E. Nielsen, and B. Norden. 1997. Kinetics for hybridization of peptide nucleic acids (PNA) with DNA and RNA studied with the BIAcore technique. Biochemistry. 36:5072–5077. [DOI] [PubMed] [Google Scholar]
- Karlsson, R., and R. Stahlberg. 1995. Surface plasmon resonance detection and multispot sensing for direct monitoring of interactions involving low-molecular-weight analytes and for determination of low affinities. Anal. Biochem. 228:274–280. [DOI] [PubMed] [Google Scholar]
- Krioukov, E., D. J. W. Klunder, A. Driessen, J. Greve, and C. Otto. 2002a. Sensor based on an integrated optical microcavity. Opt. Lett. 27:512–514. [DOI] [PubMed] [Google Scholar]
- Krioukov, E., D. J. W. Klunder, A. Driessen, J. Greve, and C. Otto. 2002b. Integrated optical microcavities for enhanced evanescent-wave spectroscopy. Opt. Lett. 27:1504–1506. [DOI] [PubMed] [Google Scholar]
- Laine, J. P., B. E. Little, and H. A. Haus. 1999. Etch-eroded fiber coupler for whispering-gallery-mode excitation in high-Q silica microspheres. IEEE Photon. Tech. Lett. 11:1429–1430. [Google Scholar]
- Li, Y. Y., F. Cunin, J. R. Link, T. Gao, R. E. Betts, S. H. Reiver, V. Chin, S. N. Bhatia, and M. J. Sailor. 2003. Polymer replicas of photonic porous silicon for sensing and drug delivery applications. Science. 299:2045–2047. [DOI] [PubMed] [Google Scholar]
- Lin, V. S.-Y., K. Motesharei, K.-P. S. Dancil, M. J. Sailor, and M. R. Ghadiri. 1997. A porous silicon-based optical interferometric biosensor. Science. 278:840–843. [DOI] [PubMed] [Google Scholar]
- Luong, J. H. T., P. Bouvrette, and B. M. Keith. 1997. Development and applications of biosensors in food analysis. Trends Biotechnol. 15:369–377. [DOI] [PubMed] [Google Scholar]
- Malmqvist, M. 1993. Biospecific interaction analysis using biosensor technology. Nature. 361:186–187. [DOI] [PubMed] [Google Scholar]
- Marshall, A., and J. Hodgson. 1998. DNA chips: an array of possibilities. Nat. Biotechnol. 16:27–31. [DOI] [PubMed] [Google Scholar]
- Minunni, M., S. Tombelli, E. Mariottie, and M. Mascini. 2001. Biosensors as new analytic tool to detect Genetically Modified Organisms (GMOs). Fresenius J. Anal. Chem. 369:589–593. [DOI] [PubMed] [Google Scholar]
- Nicolai, T., L. Van Dijk, J. A. P. P. Van Dijk, and J. A. M. Smit. 1987. Molecular mass characterization of DNA fragments by gel permeation chromatography using a low-angle laser light scattering detector. J. Chromatogr. A. 389:286–292. [DOI] [PubMed] [Google Scholar]
- Pearson, J. E., A. Gill, and P. Vadgama. 2000. Analytical aspects of biosensors. Ann. Clin. Biochem. 37:119–145. [DOI] [PubMed] [Google Scholar]
- Persson, B., K. Stenhag, P. Nilsson, A. Larsson, M. Uhlen, and P. Nygren. 1997. Analysis of oligonucleotide probe affinities using surface plasmon resonance: a means for mutational scanning. Anal. Biochem. 246:34–44. [DOI] [PubMed] [Google Scholar]
- Rich, R. L., and D. G. Myszka. 2002. Survey of the year 2001 commercial optical biosensor literature. J. Mol. Recognit. 15:352–376. [DOI] [PubMed] [Google Scholar]
- Serpenguezel, A., S. Arnold, and G. Griffel. 1995. Excitation of resonances of microspheres on an optical-fiber. Opt. Lett. 20:654–656. [DOI] [PubMed] [Google Scholar]
- Teraoka, I., S. Arnold, and F. Vollmer. Perturbation approach to resonance shift of whispering gallery modes in dielectric microspheres as a probe of a surrounding medium. J. Opt. Soc. Am. B. In press.
- Vollmer, F., D. Braun, A. Libchaber, M. Khoshsima, I. Teraoka, and S. Arnold. 2002. Protein detection by optical shift of a resonant microcavity. Appl. Phys. Lett. 80:4057–4059. [Google Scholar]