

Abstract
Transient electrical currents generated by the Na+-transporting FoF1-ATPase of Ilyobacter tartaricus were observed in the hydrolytic and synthetic mode of the enzyme. Two techniques were applied: a photochemical ATP concentration jump on a planar lipid membrane and a rapid solution exchange on a solid supported membrane. We have identified an electrogenic reaction in the reaction cycle of the FoF1-ATPase that is related to the translocation of the cation through the membrane bound Fo subcomplex of the ATPase. In addition, we have determined rate constants for the process: For ATP hydrolysis this reaction has a rate constant of 15–30 s−1 if H+ is transported and 30–60 s−1 if Na+ is transported. For ATP synthesis the rate constant is 50–70 s−1.
INTRODUCTION
Driven by a transmembrane electrochemical proton gradient, FoF1-ATPases catalyze ATP synthesis in bacteria, mitochondria, or chloroplasts. The ATP synthases of a few anaerobic bacteria-like Propionigenium modestum (Laubinger and Dimroth, 1988) and Ilyobacter tartaricus (Neumann et al., 1998) have acquired the ability to use the energy stored in a Na+ electrochemical gradient for the synthesis of ATP. These Na+-FoF1-ATPases are close relatives of the H+ driven FoF1-ATPases in structure and properties. Like the latter they consist of a water soluble F1 part (subunit stoichiometry α3β3γδɛ) that harbors the catalytic sites for ATP synthesis and hydrolysis and the membrane-embedded Fo component (subunit stoichiometry ab2c11), that is responsible for ion translocation (Stahlberg et al., 2001).
The high-resolution crystal structure from bovine mitochondrial F1 (Abrahams et al., 1994) was in remarkable agreement with the binding change mechanism (Boyer, 1997) suggesting a rotary catalytic mechanism, which was proven experimentally (Noji et al., 1997). Subunits-γ, -ɛ, and the c11 oligomer could be cross-linked without loss of function (Tsunoda et al., 2001) and were shown to represent the rotor of FoF1 complexes by direct visualization of rotation with an attached actin filament (Pänke et al., 2000; Sambongi et al., 1999). More recently, coupled ATP-driven rotation of the γɛc11 subassembly and rotation during ATP synthesis has been demonstrated for the first time with single FoF1 molecules (Börsch et al., 2002; Kaim et al., 2002). The a-subunit is connected laterally with the c11 oligomer (Birkenhager et al., 1995; Singh et al., 1996; Takeyasu et al., 1996), where it is held in place by the two b-subunits that form a peripheral stalk connecting subunit-a with an α-subunit of F1 with the help of subunit-δ (Dunn and Chandler, 1998; Rodgers and Capaldi, 1998).
Since the pioneering work of Drachev et al. (1974), current measurements on planar lipid membranes (black lipid membrane (BLM)) have been used to investigate electrogenic membrane proteins. With an appropriate activation system they were applied to detect ion transport reactions or conformational transitions in the reaction cycle of ion translocating ATPases (for a review see Bamberg et al. (1993)). Because in FoF1-ATPase hydrolysis and synthesis of ATP are associated with ion translocation in the membrane-embedded Fo part, an electrical signal is expected after activation of the enzyme with ATP or ADP + Pi. This has been demonstrated previously using the FoF1-ATPase from Rhodospirillum rubrum (Christensen et al., 1988). Activation was accomplished with a photolytic ATP- or ADP-concentration jump using caged ATP and caged ADP, respectively. We have now applied the same technique to the Na+-FoF1-ATPase from I. tartaricus. This enzyme has the advantage of additional possibilities to modulate its function due to its Na+ sensitivity. In contrast to previous work we have used a short laser flash for the release of ATP from caged ATP, which allowed millisecond time resolution. In addition, we have complemented the measurements with a method for a substrate concentration jump using a solid supported membrane (SSM) (Pintschovius et al., 1999). Using both techniques we have detected Na+-dependent transmembrane charge displacements. We propose that the charge displacements are associated with the rotary movements of the ringlike assembled c11 oligomer versus subunits ab2 in the membrane-imbedded Fo part of the protein.
MATERIAL AND METHODS
Protein purification and preparation of the proteoliposomes
The I. tartaricus cells (DSM 2382) were grown anaerobically at 30°C and collected as described (Neumann et al., 1998; Schink, 1984). Five grams of cells were broken by passing a suspension through a French pressure cell. The FoF1-ATPase was solubilized with Triton-X-100 (1%) and contaminating proteins were precipitated using polyethylene glycol PEG-6000. The protein activity was determined by a coupled spectrophotometric assay (Neumann et al., 1998). After further purification by gel chromatography an activity of 10–20 units mg−1 protein was achieved. The protein concentration was determined by the bicinchoninic acid test.
Proteoliposomes were prepared by the freeze-thaw-sonication procedure as described by (Neumann et al., 1998) with a concentration of phosphatidylcholine (Sigma, St. Louis, MO; type IIS) of 30 mg·ml−1 and a protein concentration of 1–2 mg·ml−1.
BLM measurements
The preparation of bilayers, the electrical recording instrumentation, photolysis of caged ATP, and measurements of membrane conductivity were performed as described (Fendler et al., 1996; Fendler et al., 1985). Briefly, a planar lipid membrane (area ≈ 1 mm2) was formed between the two compartments of a cuvette (volume 1.5 ml each compartment) filled with electrolyte. A solution of 1,5% phosphatidylcholine and 0,025% octadecylamine in n-decane was used to form the membrane. Proteoliposomes were added to one side of the membrane and allowed to adsorb to the planar membrane by stirring the solution for 2 h. They are capacitively coupled to the measuring system via the planar membrane. The FoF1-ATPase in the proteoliposomes was activated by photolytic release of ATP or ADP in the millisecond range (1mM MgCl2 and room temperature: 14 ms at pH 7.0 and 2.0 ms at pH 6.4) using a XeCl excimer laser at 308 nm. The irradiance at the membrane plane was 180–300 mJ/cm2 leading to a fraction of released ATP in solution of η ∼ 0.20–0.35. Transient pump currents could be observed that represent the electrical activity of the protein. The electrolyte contained buffer, salts, and various amounts of NPE-caged ATP (P3-1-(2-nitro)phenylethyladenosine-5′-triphosphate), Na+ salt, or caged ADP, K+ salt, purchased from Calbiochem. For experiments that required the absence of Na+ the (C2H5)3NH+ salt of NPE-caged ATP was kindly supplied by E. Grell, MPI für Biophysik, Germany. In all ATP hydrolysis measurements the electroneutral H+/Na+ exchanger monensin (10 μM) was present to facilitate equilibration of Na+ between the cuvette and the internal volume of the liposomes (Fendler et al., 1996).
SSM measurements
The SSM consisted of an alkanethiol monolayer covalently bound to a gold surface via the sulfur atom, with a phospholipid monolayer on top of it. For the preparation we followed the procedure described previously (Pintschovius et al., 1999; Seifert et al., 1993). As in the case of the BLM proteoliposomes were allowed to adsorb to the SSM and transient currents were measured via capacitive coupling. For the activation of the FoF1-ATPase concentration jumps of ATP and ADP were generated via a rapid solution exchange at the surface of the SSM (Pintschovius et al., 1999). The cuvette was connected to the outlet of an electromagnetic valve, which allowed fast switching between activating and nonactivating solutions. The usual procedure for a concentration jump consisted of three steps: 1), washing the cuvette with the nonactivating solution (1 s); 2), switching to the activating solution (1 s); and 3), removing the activating substrate from the cuvette with the nonactivating solution (1 s).
Determination of FoF1-ATPase activity in the presence and absence of caged ATP
The activity of the protein was determined by the coupled spectrophotometric assay (Neumann et al., 1998). The hydrolytic activity was measured in the presence of 1 mM MgCl2, 2 mM NaCl and an ATP regenerating system (phosphoenolpyruvate, pyruvate kinase, lactate dehydrogenase) in addition to various amounts of ATP and NPE-caged ATP. For experimental conditions, see Neumann et al. (1998).
RESULTS
Transient currents of the Na+-FoF1-ATPase on the BLM
Proteoliposomes containing the FoF1-ATPase were allowed to adsorb to the planar bilayer as described in Material and Methods. Then caged ATP was added and the ion pump was activated via the photolytic release of ATP (see Fig. 1). Transient currents were observed in the absence and presence of 2 mM Na+. A typical signal obtained in the presence of Na+ is shown in Fig. 2 A. The polarity of the current corresponds to the transport of positive charge into the proteoliposomes consistent with the hydrolytic activity and ion transport of the FoF1-ATPase. Although the ATPase molecules are randomly oriented in the liposome membrane (orientation was tested according to Laubinger and Dimroth (1988)) only the inside-out pumps are activated by released ATP and contribute to the signal. The signal could be inhibited by 80% using 1 mM NaN3 (F1 inhibitor) in the presence of Na+ (Fig. 2, B and C). Note that traces B and C are from a different experiment than A, which explains the slightly different kinetics. Inhibition of the FoF1-ATPase by NaN3 is also observed for the sodium translocating FoF1-ATPase from P. modestum (Laubinger and Dimroth, 1988). Similarly, DCCD (dicyclohexylcarbodiimide, an FO-specific inhibitor) abolished the transient current in the absence of Na+. Na+ stimulation, specific inhibition, and the polarity of the transient currents demonstrate that these signals are indeed correlated with hydrolytic activity and ion transport of the Na+ dependent FoF1-ATPase of I. tartaricus.
FIGURE 1.

BLM and adsorbed proteoliposomes. (A) ATPase in the hydrolytic mode. The ATPase is activated by caged ATP. The current I(t) is measured via the electrodes E. This circuit is omitted in B. (B) ATPase in the synthetic mode. “Background ATP” generates the driving force for ATP synthesis, which is activated by caged ADP.
FIGURE 2.

(A) Transient current after activation with caged ATP at the BLM. Conditions: 50 mM HEPES, pH 7,0 (TRIS); 100 mM KCl; 2 mM NaCl; 1 mM MgCl2;1 mM DTT (dithiothreitole); 10 μM monensin; 360 μM caged ATP (η = 0,22). The solid line is a fit using a triexponential function. (B and C) Transient current in the absence (B) and presence (C) of 1 mM NaN3. Conditions as in A. Traces B and C are from a separate experiment.
The transient currents consist of a rapid rise and a biphasic decay. The three phases are characterized by three reciprocal relaxation time constants (or relaxation rates): k1 ≈ 250–600 s−1, k2 ≈ 15–60 s−1, and k3 ≈ 2–10 s−1. The relative amplitude of the slow decay component (k3) was ∼10–20% of the fast one (k2). The rise of the signal (k1) is not limited by the detection electronics (electronic rise time ∼1 ms). As will be substantiated below, k1 has to be assigned to the release of ATP from caged ATP, k2 to a protein-related electrogenic process. The slowest phase of the signal characterized by k3 is due to the charging of the capacitances of the proteoliposomes and of the planar membrane by steady-state turnover of the enzyme as described previously (Fendler et al., 1996; Fendler et al., 1993). The relaxation rate k3 depends on the properties of the membranes only and will not be discussed further.
Caged ATP binding to the Na+-FoF1-ATPase
We investigated the possibility that caged ATP binds to the Na+-FoF1-ATPase acting as a competitive inhibitor. This has been demonstrated previously for NaK-ATPase (Forbush, 1984), HK-ATPase (Stengelin et al., 1992), and Kdp-ATPase (Fendler et al., 1996). The interaction of caged ATP with the FoF1-ATPase can be studied using two different procedures: variation of the concentration of released ATP by addition of different amounts of caged ATP at constant light intensity or by variation of the light intensity at constant caged ATP concentration. The data are plotted according to the concentration of released ATP as shown in Fig. 3. Released ATP was calculated from the energy of the laser flash and the concentration of caged ATP as described previously (Friedrich et al., 1996). If only ATP binds to the enzyme the two traces should superimpose. This is not the case demonstrating that the pumping activity of the FoF1-ATP ATPase depends on both, the concentration of ATP and that of caged ATP, which implies that caged ATP binds to the Na+-FoF1-ATP ATPase from I. tartaricus.
FIGURE 3.

Transient currents after activation with caged ATP at the BLM. (A) The peak currents are presented as a function of released ATP concentrations. (B) Relaxation rates of the transient currents as a function of released ATP concentrations. Conditions: 50 mM H3PO4/KOH, pH 7,0; 2 mM NaCl; 1 mM MgCl2; 1 mM DTT; 10 μM monensin. Filled circles: 0–2 mM caged ATP, η = 0.23. Open circles: 2 mM caged ATP, η = 0.23–0.
To test the inhibition by caged ATP, activity tests were performed at 120, 250, and 500 μM NPE-caged ATP and 83, 125, and 250 μM ATP. A Dixon plot yielded an inhibition constant of 350 ± 50 μM caged ATP.
Interestingly, the shape of the signal is independent from the concentration of released ATP whereas its magnitude changes. This becomes apparent in Fig. 3 B, where the relaxation rates k1, k2, and k3 are shown. They are virtually independent from the concentration of released ATP as well as the ratio of their amplitudes A2/A1 and A3/A1 (not shown). Such a behavior rules out a second order process (binding of ATP released in solution). In contrast it suggests that the ATP dependence of the signal reflects the different number of ATPase molecules activated.
Na+-, temperature-, and pH-dependence of the transient currents measured on the BLM
Transient currents were measured in the presence of Na+ and in its absence (<20 μM Na+) where protons are translocated. The magnitude of the peak current increases by a factor of two upon addition of Na+ (Fig. 4 A). Also the relaxation rate of the decaying phase (k2) increases by a factor of two (see Fig. 4 B). Consequently, the charge transported is the same in the absence and presence of Na+, but the charge translocation is faster in its presence. This observation is in line with a single turnover activity of the FoF1-ATPase. The Na+ sensitivity of k2 suggests that this relaxation rate is related to the transport of ions or a conformational change depending on the translocated ion with a rate constant of 30–60 s−1 in the presence of Na+ and 15–30 s−1 in its absence (H+ translocation).
FIGURE 4.

Transient currents after activation with caged ATP at the BLM at different Na+ concentrations. (A) Peak currents. (B) Relaxation rates. The curved solid lines in A and B represent fits using hyperbolic functions with an offset. Conditions: 50 mM HEPES, pH 7,0 (TRIS); 100 mM KCl; various concentrations of NaCl, 1 mM MgCl2; 1 mM DTT; 10 μM monensin; 500 μM caged ATP (η = 0,35).
As shown in Fig. 4, the rising phase (k1) and the slowly decaying phase of the signal (k3) remain approximately the same whereas the rapid decay (k2) speeds up by a factor of two. This supports the assignment of k2 to an intrinsic reaction of the FoF1-ATPase related to ion transport or a conformational change and is consistent with the assumption that k1 and k3 are due to processes that are not directly associated with the protein (like ATP release from caged ATP and charging of the liposomes).
For a further identification of different processes represented by the different time constants of the electrical signal, a temperature dependence of the signal was analyzed. The measurement was performed at pH 7.0 and 6.4, that is under conditions where the release of ATP in solution was expected to be rate limiting (release of ATP 70 s−1 at pH 7.0) and not rate limiting (release of ATP 500 s−1 at pH 6.4) for the kinetics of the ATPase. Linear Arrhenius plots were obtained and the activation energies determined at pH 6.4 and 7.0 (Table 1). In particular, k3 was independent from the temperature (zero activation energy within the limits of experimental error), which agrees with its assignment to the time constant of charging of the membrane capacitances. The rising phase (k1) has the largest temperature dependence (110 kJ/mol at pH 6.4, 75 kJ/mol at pH 7.0) but also k2 shows a temperature dependence that is in the range of values expected for an enzymatic reaction (42 kJ/mol at pH 6.4 and at pH 7.0)
TABLE 1.
BLM experiment
| k1 | k2 | k3 | ||
|---|---|---|---|---|
| pH 6.4 | 120 ± 16 | 46 ± 20 | 0 ± 15 | kJ/mol |
| pH 7.0 | 80 ± 7 | 42 ± 9 | −12 ± 9 | kJ/mol |
Activation energies (±SD) determined for the relaxation rates of the electrical signal at pH 6.4 and 7.0. Conditions: 50 mM HEPES, pH 7,0 (TRIS); 100 mM KCl; 1 mM MgCl2; 2 mM NaCl; 1 mM DTT; 10 μM monensin; 186 μM caged ATP, (η = 0,28). Temperature range: 13–33°C.
In the pH range 6.0–7.4 only a moderate dependence on the magnitude and shape of the electrical signal is observed (Fig. 5). Although the relaxation rate of the rising phase (k1) decreases with increasing pH, the relaxation rates of the decaying phases (k2 and k3) remain constant (see Fig. 5). The pH dependence of k1 indicates that this phase may be in fact related to the release of ATP from caged ATP that becomes slower at higher pH (Walker et al., 1988). For comparison, the rate constant λ of release of ATP from caged ATP in solution was calculated according to Walker et al. (1988) and is included in the figure (conditions: 1 mM MgCl2 and room temperature). Obviously, the large variation of λ has only a minor effect on k1 (see Fig. 5). We will show below, that the ATPase is activated by ATP released from caged ATP in the binding site. Possibly the altered electrostatic environment in the binding site leads to a different photochemical behavior of caged ATP than in bulk solution. This may explain the much smaller pH dependence of k1 as compared to λ. Note that the fraction of ATP released from caged ATP as calculated and given in the description of the experiments refers to solution conditions. Its real value in the binding site may be different due to the altered environment mentioned above.
FIGURE 5.

Relaxation rates of the transient currents after activation with caged ATP at the BLM at different pH. The dashed line is the rate of ATP released from caged ATP in solution calculated according to Walker et al. (1988). Conditions: 50 mM HEPES, pH 7,0 (TRIS); 100 mM KCl; 1 mM MgCl2; 2 mM NaCl; 1 mM DTT; 10 μM monensin; 400 μM caged ATP (η = 0,26).
Transient currents on the BLM using caged ADP
Under physiological conditions the Na+-FoF1-ATPase from I. tartaricus is able to hydrolyze as well as to synthesize ATP (Neumann et al., 1998). For the study of the synthetic action caged ADP is a suitable photolyzable substrate. It turned out that supplying ADP and Pi in the absence of ATP is not sufficient to activate synthesis (although thermodynamically possible) at an observable rate. In fact, a voltage gradient is required for the synthetic activity of the protein (Kaim and Dimroth, 1999). We have therefore generated an electrochemical sodium potential across the liposomal membrane by adding a small amount of ATP (“background ATP”), which produces a Na+ concentration gradient and a potential as driving forces for the synthetic reaction (see Fig. 1). After the photolytic release of ADP in the absence of Pi and “background ATP” only a small laser artifact was observed (trace a in Fig. 6). When “background ATP” was added, a small transient current appeared (trace b). However, only when Pi was added a large current could be measured (trace c). The polarity of the signal corresponds to positive charge transported out of the liposome, which is expected for the synthetic mode and ion transport of the enzyme. An exponential fit to the decaying phase of the signal yielded a relaxation rate of 50–70 s−1. The fact that Pi and “background ATP” are required as well as the polarity of the current demonstrate that this signal represents charge translocation of the FoF1-ATPase in the synthetic mode. In particular, the requirement for Pi rules out that the negative signal shown in Fig. 6 b is due to a passive discharge of the liposomes upon inhibiton of the activity of the ATPase by released ADP. In addition, liposomes and even open membrane fragments discharge on planar bilayers with time constants >200 ms (Fendler et al., 1993; Gropp et al., 1998) whereas the relaxation time of the negative signal is ∼20 ms.
FIGURE 6.

Transient currents after activation with caged ADP at the BLM. Conditions: 50 mM HEPES, pH 7,0 (TRIS); 100 mM NaCl; 1 mM MgCl2; 1 mM DTT. After adsorption of the proteoliposomes the cuvette was perfused with 2 ml protein free solution. The transient currents were consecutively recorded after addition of (a) 500 μM caged ADP, (b) 50 μM “background” ATP, and (c) 0.5 mM H3PO4(KOH).
At first glance the experiment seems to indicate that a small charge translocation also occurs in the absence of Pi. However it can be shown that the small transient current observed under these conditions is due to the Pi generated in solution by hydrolysis of “background ATP”. To understand this behavior one has to know that ∼50 μg of FoF1-ATPase in proteoliposomes were added to the cuvette for adsorption to the BLM. Most of that enzyme is still present and active in the solution. Although it does not contribute to the electrical signal it can still hydrolyze the “background ATP” that is added to the cuvette in the synthesis experiments. In preliminary experiments we found that upon repetitive laser flashes in the absence of Pi the transient current after addition of “background ATP” first increased and then decreased with time. Because the fragile bilayer prevents rapid stirring of the solution a minimum mixing time of 1 min is required after addition of a substrate to the cuvette. During this time the protein contained in the cuvette solution (50 μg corresponding to 200 units) hydrolyses the “background ATP” generating Pi and finally removing the “background ATP” that is required to supply the driving force for synthesis. Therefore, in the experiment shown in Fig. 6 most of the proteoliposomes in the solution (>75%) were removed by perfusion of the cuvette with 2 ml of protein-free solution. Only under these conditions, activation with Pi as shown in the figure was possible. The small remaining signal before addition of Pi (trace b in Fig. 6) has to be attributed to Pi generated by the remaining enzyme in solution via hydrolysis of “background ATP.”
ATP concentration jumps on the SSM
Proteoliposomes containing the FoF1-ATPase were adsorbed to the SSM and the ion pumps were then activated using a rapid solution exchange from the nonactivating solution (no ATP) to the activating solution (containing ATP) and back. Transient currents were observed in the absence and presence of Na+ upon addition (on-signal) and withdrawal of ATP (off-signal) as shown in Fig. 7, A and B. Note that the traces recorded in the presence and absence of Na+ (Fig. 7, A and B) are from different experiments. The amplitudes can, therefore, not be directly compared. Furthermore, these signals could be inhibited partially by NaN3 and (in the absence of Na+) completely by DCCD (Fig. 7 C). Partial inhibition by NaN3 was also observed on BLM and by other authors (Laubinger and Dimroth, 1988). Note that SSM measurements do not require caged ATP. These experiments, therefore, rule out that the electrical signals are due to an electrogenic process associated with the photolytic release of ATP in the binding site.
FIGURE 7.
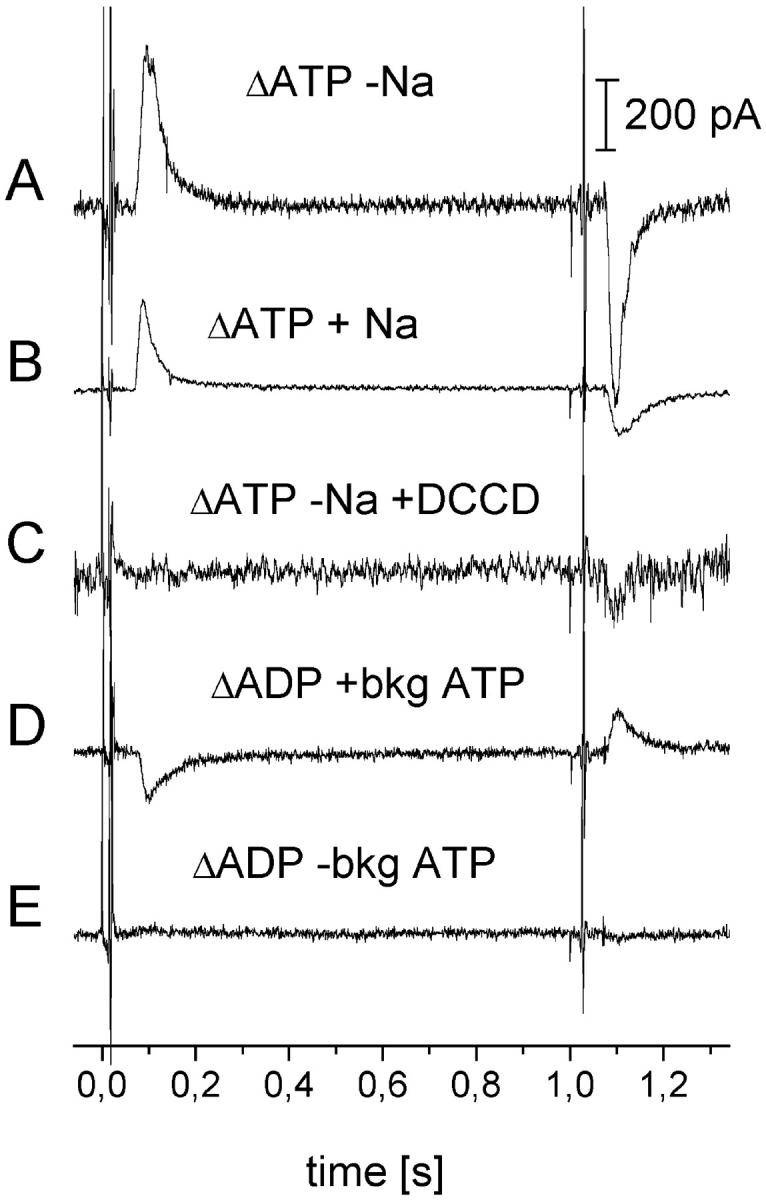
Transient currents after activation with a rapid concentration jump at the SSM. (A) SSM signal after an ATP jump (1 mM ATP) in the absence of NaCl. (B) SSM signal after an ATP jump (0,5 mM ATP) in the presence of 2 mM NaCl. (C) Inhibition of A by 60 μM DCCD. Activating solution for A–C: 50 mM HEPES, pH 7,0 (TRIS); 300 mM KCl; 0 or 2 mM NaCl; 3 mM MgCl2; 0.5 or 1 mM ATP. Nonactivating solution: as activating solution but no ATP. (D) SSM signal after an ADP jump (0.3 mM ADP) in the presence of NaCl, Pi, and “background ATP.” (E) Without “background ATP”. Activating solution for D and E: 50 mM HEPES, pH 7,0 (TRIS); 300 mM KCl; 2 mM NaCl; 3 mM MgCl2; 1 mM H3PO4(KOH); 0/30 μM external ATP; 0,3 mM ADP. Nonactivating solution: as activating solution but no ADP.
The rising and decaying phases of the signal are characterized by relaxation rates of ∼100 s−1 and ∼30 s−1, respectively, in the presence and absence of Na+. The off-signal had somewhat lower relaxation rates. The rising phase is slower than in the case of the BLM measurements because the kinetics of the rising phase of the current is determined by the kinetics of the solution exchange at the surface of the SSM (Pintschovius et al., 1999). The existence of an off-signal in the experiment of Fig. 7 A obviously means that ADP and Pi are in the binding site when ATP is withdrawn and are available for the reverse reaction (off-signal). Such a configuration is obtained when the affinity change step preceding ADP and Pi release is rate limiting during ATP hydrolysis as proposed previously (Al-Shawi et al., 1997; Dunn et al., 1987). The on- and the off-signals correspond to the same translocated charge. This may indicate that under the conditions of our SSM experiments the electrical signal is dominated by single turnover activity of the ATPase. Furthermore, no indication for a significant slow component, which could be attributed to a stationary transport activity (Ganea et al., 2001), could be found in the SSM signal. We attribute the absence of a stationary activity of the ATPase in these experiments to the retarding potential generated in the liposomes that tends to lock the enzyme after one or few turnovers in the intermediate preceding the electrogenic step. Note that in the BLM experiment a small phase corresponding to stationary turnover of the ATPase is observed. Probably in these experiments potential buildup is less severe because only a small fraction of the enzyme is activated.
In the liposomes, the FoF1-ATPase is inside out as well as rightside out oriented. However, only the inside-out population is activated by ATP and contributes to the pump current. The positive transient current measured after addition of ATP corresponds to the transport of positive charges into the liposome in agreement with the transport of Na+ out of the bacteria in the hydrolytic mode of the FoF1-ATPase.
An ATP dependence of the amplitude of the peak currents in the presence of Na+ (data not shown) yielded a hyperbolic relationship characterized by a half-saturation concentration K0,5ATP of 103 ± 15 μM in good agreement with published dissociation constants of FoF1-ATPases for ATP (see e.g., 140 μM, (Muneyuki et al., 1989) and 38 μM, (Weber et al., 1993) for bacterial FoF1-ATPases).
Na+ concentration jumps on the SSM
In the presence of ATP the FoF1-ATPase can be activated on the SSM by addition of Na+ (data not shown). Under these conditions, the enzyme is already hydrolyzing ATP at a slow rate when addition of Na+ speeds up this reaction. Because the FoF1-ATPase is already translocating protons before switching to the activating (in this case the Na+-containing) solution a potential (positive inside the liposomes) is already present when Na+ is added. This experiment, therefore, represents a Na+ activation of the FoF1-ATPase in the presence of a retarding potential. The peak currents at different Na+ concentrations saturate with a hyperbolic concentration dependence characterized by a half-saturation concentration of K0,5Na ≈ 350 ± 50 μM. This is close to the values found in our BLM study (Fig. 4; peak current: K0,5Na = 220 ± 74 μM, k2: K0,5Na = 160 ± 33 μM) and that reported previously (270 μM at pH 8.0, (Neumann et al., 1998)). As a control, Na+ concentration jumps were performed in the absence of ATP. No electrical signals were observed under these conditions.
ADP concentration jumps on the SSM
As in the case of the BLM measurements, ADP concentration jumps in the presence of “background ATP” and Pi lead to electrical signals with negative polarity (Fig. 7 D) corresponding to the transport of positive charge out of the liposomes. These signals most probably represent charge translocation of the FoF1-ATPase in the synthetic mode. They show the same characteristics as observed on the BLM, namely they are not observed in the absence of “background ATP” (Fig. 7 E). These measurements corroborate the results obtained on the BLM. As stated for the ATP concentration jumps also, these measurements exclude that the transient current measured on the BLM is due to an electrogenic process associated with the photolytic release of the nucleotide in the binding site.
DISCUSSION
Charge movements during the enzymatic activity of ion translocating membrane proteins indicate the translocation of an ion in the protein or an electrogenic conformational change in the reaction cycle. Both processes are interesting in terms of the mechanism of ion translocation. With BLM and SSM techniques we have tools at hand to measure direction and speed of charge translocation during the transport cycle of the protein that can be interpreted on the basis of existing models for the transport process. We have measured electrical signals during the enzymatic activity of the FoF1-ATPase. It will be shown below that the characteristics of these signals suggest that they have to be assigned to a partial reaction of the Na+/H+ translocation process. We give a rate constant for this partial reaction and make a tentative assignment to a microscopic process during the rotary ion transport mechanism of the FoF1-ATPase.
The electrical signals on the BLM and SSM are generated by the hydrolytic or synthetic activity of the FoF1-ATPase
After photolytic generation of substrates at the BLM or after a rapid exchange to a substrate containing solution at the SSM, a transient current is measured in the absence and presence of Na+. We have characterized this signal using different caged ATP, caged ADP, and Na+ concentrations. The affinities of the FoF1-ATPase for ATP and Na+ determined on the BLM and SSM agree well with the values found in literature. Furthermore, the specific inhibitors of the FoF1-ATPase NaN3 and DCCD inhibited the electrical signals. Taken together, these results show that the electrical signals observed on the BLM and on the SSM reflect the electrical activity of the Na+-FoF1-ATPase from I. tartaricus.
Electrical signals could be measured under conditions of ATP hydrolysis and ATP synthesis. As expected, these signals are of opposite polarity. The polarity of the signals is consistent with cation transport to the periplasmic side of the protein under hydrolysis conditions and with cation transport to the cytoplasmic side of the protein under synthesis conditions. In addition, synthesis signals required an additional electrochemical driving force.
From their ATP, pH, and temperature dependence the relaxation rates k1 and k3 of the electrical signal were assigned to the photolytic release of ATP in the binding site and to the charging of the proteoliposomes due to the pumping activity of the enzyme, respectively. Only the relaxation rate k2 is dependent on the nature of the transported cation and is assigned to the electrical activity of the FoF1-ATPase. Also its activation energy of ∼45 kJ/mol corroborates this assignment. It is suggested that k2 represents the rate constant of an electrogenic partial reaction of the ATPase reaction cycle. The fact that the rate constant depends on the transported cation demonstrates that this reaction is limited by the electrogenic process itself rather than by the nucleotide related processes in F1. For ATP hydrolysis this reaction has a rate constant of 15–30 s−1 if H+ is transported and 30–60 s−1 if Na+ is transported. For ATP synthesis the rate constant is 50–70 s−1 (only determined in the presence of Na+).
The electrical signal measured on the BLM is dominated by a single turnover of the FoF1-ATPase activated by caged ATP photolyzed in the binding site
Caged ATP binds to various ATPases and acts as a competitive inhibitor (Fendler et al., 1996; Forbush, 1984; Nagel et al., 1987). Because at our conditions only ∼30% of the caged ATP is transformed to ATP by the ultraviolet light flash, the remaining caged ATP competes for the ATP binding sites on F1. Caged ATP already bound at the binding sites may be photolytically released directly in the binding sites, or the unphotolyzed fraction of caged ATP may prevent access to the binding site for ATP released in solution. All these processes have to be taken into account for the interpretation of the time dependence of the electrical currents generated by photolytical release of ATP. In the following, we propose that the FoF1-ATPase is activated by caged ATP photolyzed in the binding site and that the electrical signal is dominated by a single turnover of the enzyme.
The linear decrease of the signal upon reduction of the light intensity (see Fig. 3 A, open circles) shows that the electrical signal scales with the number of photolyzed caged ATP molecules. This suggests that the fraction of photolyzed caged ATP in the binding sites determines the signal (“release in-site model”). If binding of released ATP was involved, a hyperbolic dependence would have been expected instead. Consequently, the increase of the signal with rising caged ATP concentration (see Fig. 3 A, filled circles) reflects the increasing number of binding sites occupied with caged ATP. We can, therefore, determine from this dependency the caged ATP affinity of the FoF1-ATPase. Under the conditions of the experiment 23% of caged ATP in solution are transformed to ATP. A half-saturation concentration of 81 μM determined from Fig. 3 A yields a dissociation constant for caged ATP of ≈ 350 μM (pH 7,0). In activity measurements using the proteoliposomes at different ATP and caged ATP concentrations competitive inhibition by caged ATP with a comparable inhibition constant (350 ± 50 μM) was found.
Further support of the “release in-site model” comes from the analysis of the shape of the current traces. Only the magnitude of the curves changes at different caged ATP concentration or different light intensity. The time constants and relative amplitudes remain the same (Fig. 3). At the same time, the transported charge changes with ATP concentration. If the ATP released in solution was available for the enzyme, an ATP dependent time constant would be expected. This is not observed. We therefore conclude that on the timescale of the current measurements (∼1 s) mainly ATP released from caged ATP bound in the binding site contributes to the transient current. This implies that a single turnover dominates the signal after activation of the FoF1-ATPase.
Finally, the same amount of charge is transported whether Na+ is present or not. This can be deduced from the fact that peak current and relaxation rate k2 yield a Na+ dependence characterized by a nearly identical K0.5Na (Fig. 4). Under these conditions the product amplitude x relaxation time, which is proportional to the translocated charge, is constant at all Na+ concentrations. This finding additionally supports the notion that the electrical signal represents a single turnover of the enzyme.
The electrical signal is generated in Fo
At the ionic strength of our experiment (100 mM) the Debye length is ∼1 nm. The F1 complex of the ATPase, however, protrudes into the solution more than 45 nm (Weber and Senior, 1997). It is, therefore, unlikely that movement of a charged portion of F1 brings about the electrical signal because this part of the protein is effectively screened by the surrounding solution. The charge displacement has to take place in the membrane bound Fo complex, potentially in the “rotor” consisting of 11 c-subunits (Stahlberg et al., 2001) or in the membrane inserted part of the “stator,” i.e., the a- or the b-subunits.
At concentrations <100 μM DCCD inhibits transport in the Fo portion of the ATPase by binding to the ion binding sites in the c-subunits. (Weber et al., 1993). It binds to protonated carboxylates and consequently Na+ and Li+ protect against DCCD inhibition in P. modestum and I. tartaricus (Kluge and Dimroth, 1993; Neumann et al., 1998). This was also observed in the present study. Inhibition of the electrical signals by DCCD therefore demonstrates that the ion binding sites are directly involved. A charge displacement in subunits-a, -b, and -c due to a displacement of charged residues by the torsional forces exerted by F1 can be excluded.
A kinetic model for the activation of the FoF1-ATPase using caged ATP
The kinetic analysis will be based on transient currents observed on the BLM because of the superior time resolution of this technique. At time zero the current is zero, rises to its peak, and decays. This requires a kinetic model where an electroneutral process precedes the electrogenic reaction. Based on its dependence on Na+, pH, and temperature, we have assigned the rising phase (k1) to the release of ATP from caged ATP. The fast decay (k2) was attributed to an intrinsic reaction of the FoF1-ATPase. Taking into account that the release of ATP has to precede the intrinsic reaction of the protein the following kinetic model is obtained: electroneutral release of ATP from caged ATP with a rate constant k1 = 250–600 s−1 is followed by a charge translocation with rate constant k2 = 15–60 s−1.
Various models have been proposed for the hydrolytic reaction mechanism of the FoF1-Atpase (for a review see Bianchet et al. (2000)). All have in common that ATP is hydrolyzed in the tight binding site when the open site is occupied by ATP. In the subsequent step the tight site is transformed into a loose one concomitant with energy transduction. We have taken this core mechanism and have tried to adapt it to the situation of the BLM experiment (see Fig. 8 A). Initially only caged ATP is present at high concentrations (0.4–2 mM), which is assumed to be sufficient to bind to all sites including the open ATP binding site. When ATP is released from caged ATP in the tight site by ultraviolet irradiation it can be hydrolyzed providing energy for ion translocation. The role of ATP in the open binding site is here played by caged ATP that acts as a nonhydrolyzable ATP analog. Note that because of the requirement of an occupied open binding site our assumption of caged ATP binding to all three sites makes sense. In a subsequent reaction ADP and Pi are released and replaced by caged ATP thereby regenerating the initial configuration. In the model of Boyer and Walker (Abrahams et al., 1994; Boyer and Kohlbrenner, 1981) ADP and Pi are released from the loose site whereas later models propose release out of the open site (Duncan et al., 1995), which is thermodynamically more favorable. It has to be noted, however, that in our BLM experiments, ADP and Pi are virtually absent in the solution allowing dissociation of the substrates from the loose site.
FIGURE 8.

(A) Kinetic model describing the activation of the FoF1-ATPase using a photolytic concentration jump with caged ATP. (B) Structure of FoF1-ATPase and rotary mechanism of Na+ transport during the process characterized by the rate constant k2. For clarity the α-, β-, δ-, and ɛ-subunits of F1 have been omitted. L, T, and O refer to the loose, tight, and open states, respectively, of the ATP binding site.
In the following we make use of the putative Na+ translocation mechanism in the hydrolytic mode of the FoF1-ATPase as proposed by (Dimroth et al., 1999; Kaim et al., 1998). In the initial state most of the Na+ binding sites on the 11 c-subunits of Fo are in contact with the cytoplasmic solution and therefore occupied by Na+ ions (Kaim et al., 1998). This is shown in Fig. 8 B, where for a clearer representation the α-, β-, δ-, and ɛ-subunits of F1 have been omitted. After the light flash ATP is released in the binding site with a rate constant k1 = 250–600 s−1. (Note that because of the low quantum efficiency of caged ATP the probability of more than one caged ATP being released in one F1 subunit is very small.) Then, subunit-γ rotates in F1 by 120° (Adachi et al., 2000) forming a conformation where ATP is hydrolyzed but ADP and Pi are still in the binding site. The rotation is transduced to Fo via the subunits-γ and -ɛ resulting in a 120° rotation of the c11 complex. This enables an average number of n = 3.7 Na+ ions to be released to the periplasmic side through a release channel in subunit-a. Subsequently, Na+ ions are taken up from the cytoplasmic side to repopulate the empty Na+ binding sites on Fo. For the first time we can assign a rate constant to the ion translocation process: it proceeds with a rate constant of k2 = 30–60 s−1 in the presence of Na+ and k2 = 15–30 s−1 when H+ ions are transported. Note that no indication for sequential transport of the 3–4 Na+ ions was found. In a final step ADP and Pi are released and the empty loose binding site is finally occupied by another molecule of caged ATP.
The translocation process is complex. It comprises release of ions to the periplasm, rotation of c11, and finally uptake of ions from the cytoplasm. Which of these is associated with a charge translocation? Periplasmic release through a narrow channel in subunit-a as well as cytoplasmic uptake through a channel formed by tightly packed c-subunits are plausible candidates for an electrogenic reaction. In this respect, comparison with NaK-ATPase is of interest, where electrogenic Na+ uptake and release has previously been described (Gadsby et al., 1993; Pintschovius et al., 1999). Rotation of c11, on the other hand, could also involve an electrogenic step, namely the transition of the bound cation across the “hydrophobic strip” as proposed by Dimroth et al. (1999). Whether all three processes contribute to the generation of the observed current or one of them dominates the charge translocation cannot yet be decided at present.
The kinetic model shown in Fig. 8 only accounts for a single turnover of the ATPase after release of ATP from caged ATP in the binding site. This process dominates the observed transient current. However, at a longer timescale, ATP released in solution may exchange for caged ATP in the binding sites and allow for a stationary activity as suggested by the slow component k3 in the electrical signal.
The potential can act as the only driving force of the ATP synthesis activity of the FoF1-ATPase
It has been shown recently that the kinetically relevant driving force for ATP synthesis of the FoF1-ATPase is the electrical potential (Kaim and Dimroth, 1998; Kaim and Dimroth, 1999). We have, therefore, performed experiments at the BLM and SSM to test this hypothesis. Generation of an ion gradient or of a potential across the proteoliposomal membrane is possible through the FoF1-ATPase itself. For that purpose, a few FoF1-ATPase molecules are put into the hydrolytic mode by adding a small concentration of “background ATP.” These generate a membrane potential and a Na+ ion gradient (Fig. 1). After the flash and release of ADP (for the BLM experiments) or after switching to an ADP containing solution (for the SSM experiments) the activated FoF1-ATPases are now in the synthetic mode driven by the membrane potential and the ion gradient.
Which one of the two driving forces is dominant? By a simple calculation it can be shown that the main driving force generated by means of the “background ATP” is the membrane potential. Transport of 1 mM Na+ into the liposomes (diameter 100–300 nm) generates a potential of 0,4–1,2 V (Fendler et al., 1996). This is certainly sufficient to drive ATP synthesis (under the condition of the SSM experiment shown in Fig. 7, ATP synthesis requires a free energy equivalent to ∼120 mV). At the same time this potential is high enough to prevent further ion transport driven by “background ATP.” Hence, a considerable potential but only a negligible Na+ gradient of 81 mM inside versus 80 mM outside the liposomes is created. The measurements presented in Fig. 6, therefore, support the notion that a potential is sufficient for the synthetic activity of the Na+-FoF1-ATPase of I. tartaricus. It does, however, not rule out the possibility that a sufficiently high Na+ gradient in the absence of a potential could drive ATP synthesis.
CONCLUSIONS
We have identified an electrogenic reaction in the reaction cycle of the Na+-transporting FoF1-ATPase of I. tartaricus. This process is related to the translocation of the cation through the membrane bound subcomplex of the FoF1-ATPase. The reaction could possibly be the transport of the Na+ or H+ ions through the putative access channel in the “stator,” the a-subunit, the binding or release of the cation through a narrow channel formed by the c-subunits, or the transition of the bound cations across the “hydrophobic strip” (Dimroth et al., 1999). In addition, we have been able to determine rate constants for the process: for ATP hydrolysis this reaction has a rate constant of 15–30 s−1 if H+ is transported and 30–60 s−1 if Na+ is transported. For ATP synthesis the rate constant is 50–70 s−1.
Acknowledgments
We thank Y. Appoldt for help with the preparation of the protein, Jennifer Mc Manus for excellent technical assistance, and E. Grell for providing the Na+-free NPE-caged ATP.
This work has been financially supported by the Deutsche Forschungsgemeinschaft (SFB 47Z).
Abbreviations used: BLM, black lipid membrane; SSM, solid supported membrane; NPE-caged ATP, P3-1-(2-nitro)phenylethyladenosine-5′-triphosphate); background ATP, ATP present in small amounts before and after activation of the ATPase; λ, rate constant of release of ATP from caged ATP; η, fraction of ATP released from caged ATP; DCCD, dicyclohexylcarbodiimide; DTT, dithiothreitole.
References
- Abrahams, J. P., A. G. Leslie, R. Lutter, and J. E. Walker. 1994. Structure at 2.8 A resolution of F1-ATPase from bovine heart mitochondria. Nature. 370:621–628. [DOI] [PubMed] [Google Scholar]
- Adachi, K., R. Yasuda, H. Noji, H. Itoh, Y. Harada, M. Yoshida, and M. Kinosita, Jr. 2000. Stepping rotation of F1-ATPase visualized through angle-resolved single-fluorophore imaging. Proc. Natl. Acad. Sci. USA. 97:7243–7247. [DOI] [PMC free article] [PubMed] [Google Scholar]
- Al-Shawi, M. K., C. J. Ketchum, and R. K. Nakamoto. 1997. The Escherichia coli FOF1 γM23K uncoupling mutant has a higher K0.5 for Pi. Transition state analysis of this mutant and others reveals that synthesis and hydrolysis utilize the same kinetic pathway. Biochemistry. 36:12961–12969. [DOI] [PubMed] [Google Scholar]
- Bamberg, E., H. J. Butt, A. Eisenrauch, and K. Fendler. 1993. Charge transport of ion pumps on lipid bilayer membranes. Q. Rev. Biophys. 26:1–25. [DOI] [PubMed] [Google Scholar]
- Bianchet, M. A., P. L. Pedersen, and L. M. Amzel. 2000. Notes on the mechanism of ATP synthesis. J. Bioenerg. Biomembr. 32:517–521. [DOI] [PubMed] [Google Scholar]
- Birkenhager, R., M. Hoppert, G. Deckershebestreit, F. Mayer, and K. Altendorf. 1995. The F-0 complex of the Escherichia coli ATP synthase—investigation by electron spectroscopic imaging and immunoelectron microscopy. Eur. J. Biochem. 230:58–67. [PubMed] [Google Scholar]
- Börsch, M., M. Diez, B. Zimmermann, R. Reuter, and P. Gräber. 2002. Stepwise rotation of the γ-subunit of EF0F1-ATP synthase observed by intramolecular single-molecule fluorescence resonance energy transfer. FEBS Lett. 527:147–152. [DOI] [PubMed] [Google Scholar]
- Boyer, P. D. 1997. The ATP synthase–a splendid molecular machine. Annu. Rev. Biochem. 66:717–749. [DOI] [PubMed] [Google Scholar]
- Boyer, P. D., and W. E. Kohlbrenner. 1981. The present status of the binding-change mechanism and its relation to ATP formation by chloroplasts. In Energy Coupling in Photosynthesis. B. R. Selman and S. Selman-Reimer, editors. Elsevier, Amsterdam. 231–240.
- Christensen, B., M. Gutweiler, E. Grell, N. Wagner, R. Pabst, K. Dose, and E. Bamberg. 1988. Pump and displacement currents of reconstituted ATP synthase on black lipid membranes. J. Membr. Biol. 104:179–191. [Google Scholar]
- Dimroth, P., H. Wang, M. Grabe, and G. Oster. 1999. Energy transduction in the sodium F-ATPase of Propionigenium modestum. Proc. Natl. Acad. Sci. USA. 96:4924–4929. [DOI] [PMC free article] [PubMed] [Google Scholar]
- Drachev, L. A., A. A. Jasaitis, A. D. Kaulen, A. A. Kondrashin, E. A. Liberman, I. B. Nemecek, S. A. Ostroumov, A. Semenov, and V. P. Skulachev. 1974. Direct measurement of electric current generation by cytochrome oxidase, H+-ATPase and bacteriorhodopsin. Nature. 249:321–324. [DOI] [PubMed] [Google Scholar]
- Duncan, T. M., V. V. Bulygin, Y. Zhou, M. L. Hutcheon, and R. L. Cross. 1995. Rotation of subunits during catalysis by Escherichia coli F1-ATPase. Proc. Natl. Acad. Sci. USA. 92:10964–10968. [DOI] [PMC free article] [PubMed] [Google Scholar]
- Dunn, S. D., and J. Chandler. 1998. Characterization of a b2delta complex from Escherichia coli ATP synthase. J. Biol. Chem. 273:8646–8651. [DOI] [PubMed] [Google Scholar]
- Dunn, S. D., V. D. Zadorozny, R. G. Tozer, and L. E. Orr. 1987. ɛ subunit of Escherichia coli F1-ATPase: effects on affinity for aurovertin and inhibition of product release in unisite ATP hydrolysis. Biochemistry. 26:4488–4493. [DOI] [PubMed] [Google Scholar]
- Fendler, K., S. Drose, K. Altendorf, and E. Bamberg. 1996. Electrogenic K+ transport by the Kdp-ATPase of Escherichia coli. Biochemistry. 35:8009–8017. [DOI] [PubMed] [Google Scholar]
- Fendler, K., E. Grell, M. Haubs, and E. Bamberg. 1985. Pump currents generated by the purified Na+K+-ATPase from kidney on black lipid membranes. EMBO J. 4:3079–3085. [DOI] [PMC free article] [PubMed] [Google Scholar]
- Fendler, K., S. Jaruschewski, A. Hobbs, W. Albers, and J. P. Froehlich. 1993. Pre-steady-state charge translocation in NaK-ATPase from eel electric organ. J. Gen. Physiol. 102:631–666. [DOI] [PMC free article] [PubMed] [Google Scholar]
- Forbush, B. D. 1984. Na+ movement in a single turnover of the Na pump. Proc. Natl. Acad. Sci. USA. 81:5310–5314. [DOI] [PMC free article] [PubMed] [Google Scholar]
- Friedrich, T., E. Bamberg, and G. Nagel. 1996. Na+,K+-ATPase pump currents in giant excised patches activated by an ATP concentration jump. Biophys. J. 71:2486–2500. [DOI] [PMC free article] [PubMed] [Google Scholar]
- Gadsby, D. C., R. F. Rakowski, and P. De Weer. 1993. Extracellular access to the Na,K pump: pathway similar to ion channel. Science. 260:100–103. [DOI] [PubMed] [Google Scholar]
- Ganea, C., T. Pourcher, G. Leblanc, and K. Fendler. 2001. Evidence for intraprotein charge transfer during the transport activity of the melibiose permease from Escherichia coli. Biochemistry. 40:13744–13752. [DOI] [PubMed] [Google Scholar]
- Gropp, T., F. Cornelius, and K. Fendler. 1998. K+-dependence of electrogenic transport by the NaK-ATPase. Biochim. Biophys. Acta. 1368:184–200. [DOI] [PubMed] [Google Scholar]
- Kaim, G., and P. Dimroth. 1998. Voltage-generated torque drives the motor of the ATP synthase. EMBO J. 17:5887–5895. [DOI] [PMC free article] [PubMed] [Google Scholar]
- Kaim, G., and P. Dimroth. 1999. ATP synthesis by F-type ATP synthase is obligatorily dependent on the transmembrane voltage. EMBO J. 18:4118–4127. [DOI] [PMC free article] [PubMed] [Google Scholar]
- Kaim, G., U. Matthey, and P. Dimroth. 1998. Mode of interaction of the single a subunit with the multimeric c subunits during the translocation of the coupling ions by F1F0 ATPases. EMBO J. 17:688–695. [DOI] [PMC free article] [PubMed] [Google Scholar]
- Kaim, G., M. Prummer, B. Sick, G. Zumofen, A. Renn, U. Wild, and P. Dimroth. 2002. Coupled rotation within single FoF1 enzyme complexes during ATP synthesis or hydrolysis. FEBS Lett. 525:156–163. [DOI] [PubMed] [Google Scholar]
- Kluge, C., and P. Dimroth. 1993. Kinetics of inactivation of the FoF1 ATPase of Propionigenium modestum by dicyclohexylcarbodiimide in relationship to H+ and Na+ concentration: probing the binding site for the coupling of ions. Biochemistry. 32:10378–10386. [DOI] [PubMed] [Google Scholar]
- Laubinger, W., and P. Dimroth. 1988. Characterization of the ATP synthase of Propionigenium modestum as a primary sodium pump. Biochemistry. 27:7531–7537. [DOI] [PubMed] [Google Scholar]
- Muneyuki, E., Y. Kagawa, and H. Hirata. 1989. Steady state kinetics of proton translocation catalyzed by thermophilic F0F1-ATPase reconstituted in planar bilayer membranes. J. Biol. Chem. 264:6092–6096. [PubMed] [Google Scholar]
- Nagel, G., K. Fendler, E. Grell, and E. Bamberg. 1987. Na+ currents generated by the purified (Na+ + K+)-ATPase on planar lipid membranes. Biochim. Biophys. Acta. 901:239–249. [DOI] [PubMed] [Google Scholar]
- Neumann, S., U. Matthey, G. Kaim, and P. Dimroth. 1998. Purification and properties of the FoF1 ATPase of Ilyobacter tartaricus, a sodium ion pump. J. Bacteriol. 180:3312–3316. [DOI] [PMC free article] [PubMed] [Google Scholar]
- Noji, H., R. Yasuda, M. Yoshida, and K. Kinosita, Jr. 1997. Direct observation of the rotation of F1-ATPase. Nature. 386:299–302. [DOI] [PubMed] [Google Scholar]
- Pänke, O., K. Gumbiowski, W. Junge, and S. Engelbrecht. 2000. F-ATPase: specific observation of the rotating c subunit oligomer of EFOEF1. FEBS Lett. 472:34–38. [DOI] [PubMed] [Google Scholar]
- Pintschovius, J., K. Fendler, and E. Bamberg. 1999. Charge translocation by the Na+/K+-ATPase investigated on solid supported membranes: cytoplasmic cation binding and release. Biophys. J. 76:827–836. [DOI] [PMC free article] [PubMed] [Google Scholar]
- Rodgers, A. J. W., and R. A. Capaldi. 1998. The second stalk composed of the b- and δ-subunits connects f0 to f1 via an α-subunit in the Escherichia coli ATP synthase. J. Biol. Chem. 273:29406–29410. [DOI] [PubMed] [Google Scholar]
- Sambongi, Y., Y. Iko, M. Tanabe, H. Omote, A. Iwamoto-Kihara, I. Ueda, T. Yanagida, Y. Wada, and M. Futai. 1999. Mechanical rotation of the c subunit oligomer in ATP synthase (F0F1): direct observation. Science. 286:1722–1724. [DOI] [PubMed] [Google Scholar]
- Schink, B. 1984. Fermentation of tartrate enantiomers by anaerobic bacteria, and description of two new species of strict anaerobes, Ruminococcus pasteurii and Ilyobacter tartaricus. Arch. Microbiol. 139:409–414. [Google Scholar]
- Seifert, K., K. Fendler, and E. Bamberg. 1993. Charge transport by ion translocating membrane proteins on solid supported membranes. Biophys. J. 64:384–391. [DOI] [PMC free article] [PubMed] [Google Scholar]
- Singh, S., P. Turina, C. J. Bustamante, D. J. Keller, and R. A. Capaldi. 1996. Topographical structure of membrane-bound Escherichia coli F1F0 ATP synthase in aqueous buffer. FEBS Lett. 397:30–34. [DOI] [PubMed] [Google Scholar]
- Stahlberg, H., D. J. Muller, K. Suda, D. Fotiadis, A. Engel, T. Meier, U. Matthey, and P. Dimroth. 2001. Bacterial Na+-ATP synthase has an undecameric rotor. EMBO Rep. 2:229–233. [DOI] [PMC free article] [PubMed] [Google Scholar]
- Stengelin, M., A. Eisenrauch, K. Fendler, G. Nagel, H. T. van der Hijden, J. J. de Pont, E. Grell, and E. Bamberg. 1992. Charge translocation of H,K-ATPase and Na,K-ATPase. Ann. N. Y. Acad. Sci. 671:170–188. [DOI] [PubMed] [Google Scholar]
- Takeyasu, K., H. Omote, S. Nettikadan, F. Tokumasu, A. Iwamotokihara, and M. Futai. 1996. Molecular imaging of Escherichia coli F0F1-Atpase in reconstituted membranes using atomic force microscopy. FEBS Lett. 392:110–113. [DOI] [PubMed] [Google Scholar]
- Tsunoda, S. P., R. Aggeler, M. Yoshida, and R. A. Capaldi. 2001. Rotation of the c subunit oligomer in fully functional F1Fo ATP synthase. Proc. Natl. Acad. Sci. USA. 98:898–902. [DOI] [PMC free article] [PubMed] [Google Scholar]
- Walker, J. W., G. P. Reid, J. A. McCray, and D. R. Trentham. 1988. Photolabile 1-(2-nitrophenyl)ethyl phosphate esters of adenine nucleotide analogues: synthesis and mechanism of photolysis. J. Am. Chem. Soc. 110:7170–7177. [Google Scholar]
- Weber, J., and A. E. Senior. 1997. Catalytic mechanism of F1-ATPase. Biochim. Biophys. Acta. 1319:19–58. [DOI] [PubMed] [Google Scholar]
- Weber, J., S. Wilke-Mounts, and A. E. Senior. 1994. Cooperativity and stoichiometry of substrate binding to the catalytic sites of Escherichia coli F1-ATPase: effects of magnesium, inhibitors, and mutation. J. Biol. Chem. 269:20462–20467. [PubMed] [Google Scholar]
- Weber, J., S. Wilke-Mounts, R. S. Lee, E. Grell, and A. E. Senior. 1993. Specific placement of tryptophan in the catalytic sites of Escherichia coli F1-ATPase provides a direct probe of nucleotide binding: maximal ATP hydrolysis occurs with three sites occupied. J. Biol. Chem. 268:20126–20133. [PubMed] [Google Scholar]