

Abstract
The interaction of Chlamydomonas cytochrome f (cyt f) with either Chlamydomonas plastocyanin (PC) or Chlamydomonas cytochrome c6 (cyt c6) was studied using Brownian dynamics simulations. The two electron acceptors (PC and cyt c6) were found to be essentially interchangeable despite a lack of sequence homology and different secondary structures (β-sheet for PC and α-helix for cyt c6). Simulations using PC and cyt c6 interacting with cyt f showed approximately equal numbers of successful complexes and calculated rates of electron transfer. Cyt f-PC and cyt f-cyt c6 showed the same types of interactions. Hydrophobic residues surrounding the Y1 ligand to the heme on cyt f interacted with hydrophobic residues on PC (surrounding the H87 ligand to the Cu) or cyt c6 (surrounding the heme). Both types of complexes were stabilized by electrostatic interactions between K65, K188, and K189 on cyt f and conserved anionic residues on PC (E43, D44, D53, and E85) or cyt c6 (E2, E70, and E71). Mutations on cyt f had identical effects on its interaction with either PC or cyt c6. K65A, K188A, and K189A showed the largest effects whereas residues such as K217A, R88A, and K110A, which are located far from the positive patch on cyt f, showed very little inhibition. The effect of mutations observed in Brownian dynamics simulations paralleled those observed in experiments.
Plastocyanin (PC) (Freeman, 1981; Sykes, 1991; Gross, 1993, 1996; Redinbo et al.,1994; Sigfridsson, 1998; Hope, 2000) is a 10 kD “blue” copper protein located in the lumen of the chloroplast thylakoid where it shuttles electrons from cytochrome f (cyt f) (Martinez et al, 1994, 1996) in the cytochrome b6f complex (cyt bf) (Hauska et al., 1983; Cramer et al., 1996) to P700 in Photosystem I. Several lines of evidence indicate that the interaction between PC and cyt f is electrostatic in nature. These include: 1), the formation of chemical cross-links between K187 on turnip cyt f and D44 on spinach PC (Morand et al., 1989); 2), chemical modification of both cationic residues on cyt f (Takenaka and Takabe, 1984; Takabe et al., 1986) and anionic residues on PC, which inhibited electron transfer (Anderson et al., 1987); 3), the salt concentration dependence of electron transfer rates (Qin and Kostic, 1992; Meyer et al., 1993); 4), studies of mutants of both anionic residues on PC (Lee et al., 1995; Kannt et al., 1996) and cationic residues on cyt f (Soriano et al., 1998; Gong et al., 2000), which inhibited electron transfer; and 5), NMR studies of a PC-cyt f complex (Ubbink et al., 1998; Ejdeback et al., 2000). Monte Carlo (Ullmann et al., 1997b) and Brownian dynamics (BD) simulations have also confirmed the importance of electrostatic interactions between turnip cyt f and spinach PC (Nelson et al., 1999; De Rienzo et al., 2001) and poplar PC (Pearson and Gross, 1998). However, Soriano et al. (1996) and Zhou et al. (1996) observed no electrostatic interactions between Chlamydomonas cyt f and PC in intact cells.
In BD simulations (Northrup et al., 1987a,b; Northup et al., 1988; Gabdoulline and Wade, 1998, 2001), a mobile diffusing molecule (Molecule 2, i.e., PC or cyt c6) is allowed to dock with a target molecule (Molecule 1, i.e, cyt f) under the influence of an electrostatic field and random Brownian motions. Typically, 1,000–10,000 trajectories are carried out to provide information on 1), the rates at which the two proteins encounter each other and 2), the structures of the complexes formed.
Rates of electron transport (Pearson and Gross, 1998) calculated from BD simulations were of the same magnitude as experimentally observed rates of electron transport (Kannt et al., 1996). In addition, when BD simulations were used to examine the interaction of turnip cyt f with mutants of spinach PC, (Nelson et al., 1999; DeRienzo et al., 2001), the rates of electron transport calculated from BD simulations agreed with experimental results. (Kannt et al., 1996). Moreover, the complexes formed in these simulations showed a close juxtaposition between the Y1 ligand to the heme on cyt f and the H87 ligand to the Cu on PC, providing a short pathway for electron transfer (Moser et al., 1992, 1995). In addition to the predicted electrostatic interactions, hydrophobic interactions were also observed between highly conserved residues on PC surrounding H87 (Gross, 1996) and those surrounding the heme on cyt f (Martinez et al, 1996). The BD results agreed with the Monte Carlo calculations of Ullmann et al., (1997b) and the structures of the complexes obtained were similar to the structure of the spinach PC-turnip cyt f NMR complexes of Ubbink et al. (1998) and Ejdeback et al. (2000).
As a next step toward understanding the role of protein-protein interactions in electron transfer, we are using BD techniques to study the interaction of Chlamydomonas cyt f with its reaction partners. This system is of particular interest because Chlamydomonas cyt f interacts not only with PC but also with cytochrome c6 (cyt c6) which is synthesized by Chlamydomonas under Cu-limiting conditions (Merchant and Bogorad, 1986). Moreover, the structures of all three components: PC (Redinbo et al., 1993), cyt c6 (Kerfeld et al., 1995) and cyt f (Chi et al., 2000) have been determined and mutations have been constructed for Chlamydomonas cyt f both in vitro (Soriano et al., 1998; Gong et al., 2000) and in vivo (Soriano et al., 1996; Zhou et al., 1996). Also, the structure of a Monoraphidium cyt c6-turnip cyt f complex has been determined by computational methods (M. Fragata and A. Kajava, unpublished results, Protein Data Bank, structure 1JX8).
The structure of Chlamydomonas cyt f (Chi et al., 2000) is almost identical to that of turnip cyt f (Martinez et al., 1994, 1996) It is a β-sheet protein consisting of two domains. The large domain contains the heme with the propionic acid side chains exposed on the surface of the protein. Y1, the sixth ligand to the heme, lies on top of it. The heme itself is surrounded by several nonpolar residues including V3, F4, A62, P117, and P161.
Five lysine residues (58, 65, 66, 188, and 189) on Chlamydomonas cyt f (Fig. 1) contribute to a local positively charged electrostatic field (Pearson et al., 1996) that attracts negatively charged residues on Chlamydomonas PC (Fig. 2 A). K188 and K189 on Chlamydomonas cyt f correspond to K187 and R209 on turnip cyt f (Gray, 1992).
FIGURE 1.

Electric field representation of Chlamydomonas cyt f (Structure B of 1CFM). The electrostatic field contour at +1 kT/e− (gray) was calculated at 10 mM ionic strength, pH 7.
FIGURE 2.

Electrostatic fields of Chlamydomonas (A) PC and (B) cyt c6. The electrostatic field contour at −1 kT/e− is shown (gray). Other conditions were as for Fig. 1.
The structure of Chlamydomonas PC (Redinbo et al., 1993) (Fig. 2 A) is very similar to that of poplar (Guss et al., 1992) and spinach PC (Xue et al., 1998). It is a β-sheet protein with two potential sites for electron transfer (Gross, 1996). The first site is the H87 ligand to the copper. It is surrounded by conserved nonpolar residues. The second site is Y83, which lies at the center of two clusters of anionic residues. The first cluster consists of residues 42–44 and either 45 or 79. These residues are conserved in all higher plant and green algal PCs (Gross, 1996). In PCs from most species of higher plants including spinach, the second cluster consists of residues 59–61. However, PCs from all algae and some species of higher plants, including parsley, have a two-residue deletion in this region. As a consequence, Chlamydomonas PC has only two negatively charged residues at positions 59 and 61. Instead, there is a third negatively charged residue at position 85 (Fig. 2 A). In addition to the two clusters, there is a single aspartate residue at position 53. All green algal and higher plant PCs have a negatively charged residue at either position 51 or position 53. In summary, Chlamydomonas PC has eight negatively charged residues surrounding Y83, the same number as poplar and spinach PC. These eight negatively charged residues contribute to a large negative electrostatic field surrounding Y83 (Durell et al., 1990; Fig. 2 A).
Chlamydomonas cyt c6 (Kerfeld et al., 1995) (Fig. 2 B) is an α-helical heme protein with no sequence homology to PC even though both proteins interact with cyt f. Nonetheless, PC and cyt c6 have a similar pattern of negatively charged residues on their surfaces (compare Fig. 2, A and B). Glutamates 69–71 on cyt c6 correspond to residues 42–44 on PC; E47 on cyt c6 corresponds to D53 on PC; D41 on cyt c6 corresponds to D59 and D60 (or 61) on PC; and E54 on cyt c6 corresponds to E85 on PC (Ullmann et al., 1997a). As a result, the electrostatic field is similar for both proteins. In this article, we will use BD simulations to examine the interaction of Chlamydomonas cyt f with both of its reaction partners: PC and cyt c6.
METHODS
Molecular structures
The structures for Chlamydomonas PC, cyt f, and cyt c6 were taken from the Protein Data Bank (PDB) (http://www.rcsb.org/pdb/, Berman et al., 2000). Chlamydomonas PC is structure 2PLT (Redinbo et al., 1993); the c6 used is 1CYJ (Kerfeld et al., 1995); the cyt f used is the second cyt f record within 1CFM (Chi et al., 2000). Spinach PC (1AG6) is taken from Xue et al. (1998) whereas turnip cyt f (1HCZ) is taken from Martinez et al. (1996). Anabaena variabilis PC (1NIN; Badsberg et al., 1996) and azurin from Alcaligenes denitrificans (2AZA, Baker, 1988) were used as controls against the behavior of Chlamydomonas PC. The structure of the cyt f-PC complex (Ubbink et al., 1998) was the first model in PDB file 2PCF.
Structures for mutant cyt fs were generated using the MacroDox program (Northrup et al., 1987a, 1993; Northrup, 1999) with all mutant residues kept in the same orientation as their wild-type counterparts (i.e., no energy minimization was performed on the mutants, so that the orientation of the mutant side chain is unchanged).
Molecular representations
All molecular representations were made using the program GRASP (Nicholls and Honig, 1991). In addition, the electrostatic fields depicted in Figs. 1 and 2 were also calculated using GRASP. The internal and external dielectric constants of the proteins were 4 and 78 respectively. The ionic strength was 10 mM and the pH was 7.0.
Brownian dynamics simulations
BD simulations were carried out using the program MacroDox v. 3.2.1 (Northrup et al., 1987a,b, 1988, 1993; Northrup, 1996, 1999; http://gemini.tntech.edu/s;/index.html) as described by Pearson and Gross (1998) and Pearson (2000).
Electrostatic calculations used in MacroDox simulations
pKs were calculated using a modified Tanford-Kirkwood pK algorithm (Matthew, 1985). The pK calculations were carried out at pH 7.0, which is far away from the pKs of amino and carboxyl groups. Therefore, the Tanford-Kirkwood method should be sufficient to determine the charges. In addition, both histidine residues on PC and one of the two histidines on cyt f (H25) are uncharged because they are ligated to the metal centers. The other histidine on cyt f lies far away from the metal centers and, hence, should have very little effect on the electrostatic field. The only histidine on Chlamydomonas cyt c6 is also a ligand to the heme and was uncharged. The sulfur atom of the cys 84 ligand to the Cu was given a net charge of −1 (Durell et al., 1990) and the Cu atom was given a charge of +2. For both cyt f and cyt c6, the charges on the heme were as follows: Fe (+2), two ring nitrogen atoms (−1 each), and two propionic acid side chains (−1 each).
Electrostatic calculations were carried out using the Warwicker/Watson finite difference method (Warwicker and Watson, 1982) for solving the linearized Poisson-Boltzmann equation. This algorithm is slightly different from that used in GRASP. In most cases, full charges were assigned to the ionized atoms. However, very little difference was observed when partial charges were assigned to cyt f alone or to both cyt f and PC. The center of mass of the proteins was placed at the center of a 61 × 61 × 61 grid. The electrostatic field was first iterated over a 3.6 Å grid followed by iteration over a smaller 1.2 Å grid for better accuracy. Changing the grid size to 2.4/0.8 Å decreased the number of successful complexes and calculated electron transport rates by ∼20% but did not affect the structure or shape of the complexes formed or the effect of mutations.
Forces, torques, and electrostatic interaction energies
Forces were calculated as described by Northrup et al. (1993). Molecule 1 (cyt f, the target molecule) was given a low internal dielectric constant of 4.0. However, because of computational complexities, Molecule 2 (PC or cyt c6) was treated as a set of point charges embedded in a medium of the same dielectric constant and ionic strength as the solvent. According to Northrup (Northrup et al., 1987a; S. Northrup, personal communication), this would have little effect on the electrostatics of the docked complexes but would affect the calculated rates of electron transfer by as much as 25%. However, the degree of inhibition observed for mutants compared to wild-type proteins should be unaffected. Torques were calculated using dipoles for the moving protein as described by Northrup (1996).
Electrostatic interaction energies were calculated using an array of test charges to represent Molecule 2 in the electrostatic field of Molecule 1. Molecule 1 has a low internal dielectric constant as described above. According to Gabdoulline and Wade (1996, 2001) the electrostatic interaction energy would be overestimated by up to 25% due to not including the low internal dielectric constant for Molecule 2 (however, see Northrup et al. (1987b)) and neglecting mutual desolvation effects (Elcock et al., 1999; Gabdoulline and Wade, 2001).
Brownian dynamics trajectories
The equation of motion used by the BD algorithm is the Ermak-McCammon equation:
 |
(1) |
where ro and r are the initial and final distances between the center of mass of the Molecule 2 (PC or cyt c6) and the center of mass of the target molecule (Molecule 1, cyt f), before and after a time step Δt; β = (kT)−1; F(ro) is the external force on the molecule at ro; D is the relative diffusion coefficient of the two molecules; R is a random (Brownian) vector with the following properties (McCammon and Harvey, 1987; Harvey, 1989).
 |
(2) |
KT should be sufficiently small so that there is a minimal change in F [i.e., F(r) ∼ F(r)o]. A similar equation can be derived for the torque (Northrup, 1996).
A typical BD run for 10 mM ionic strength at pH 7 consists of 1000 trajectories (for 100 and 300 mM ionic strength conditions, five sets of 5000 and 10,000 trajectories were completed, respectively). For each trajectory, the center of mass of Molecule 2 (PC or cyt c6) is positioned on the surface of a sphere (B in Fig. 3), the center of which is the center of mass of Molecule 1. The distances between the centers of mass of cyt f and PC, on the one hand, and cyt f and cyt c6, on the other, were 86 Å and 85 Å, respectively. In each simulation, the position and orientation of Molecule 2 on the surface of the sphere is determined by the MacroDox program using a random number seed. Molecule 2 is subjected to a force F(r) and moves accordingly after which F(r) and R are recalculated. A trajectory is concluded when the mobile molecule leaves a sphere of 200 Å radius from the center of the fixed molecule (D in Fig. 3). The relative translational diffusion coefficient was 0.027 Å2/ps for both cyt f-PC and cyt f-cyt c6 simulations. Both the fixed and diffusing molecules rotate with rotational diffusion coefficients, calculated by MacroDox, of 0.33, 0.41, and 0.46 × 10⁻⁴ ps−1 for cyt f, PC, and cyt c6, respectively. Exclusion volumes are determined as described by Northrup et al. (1993). Overlap with the target molecule is checked for all atoms on Molecule 2 (PC or cyt c6) after each step in the trajectory.
FIGURE 3.

Brownian dynamics simulations. PC or cyt c6 is randomly placed on a sphere (B) of radius 86 Å (PC) and 85 Å (cyt c6) distance from the center of mass of cyt f . It is allowed to move one step under the influence of an electrostatic field (EL) and a random Brownian factor (BR). Many such steps form a trajectory that is terminated when PC or cyt c6 exits sphere D (200 Å). The smallest metal to metal distance attained in a trajectory (point C) is recorded for each trajectory. At that point, the structure of the complex formed, the fifteen closest electrostatic contacts and the electrostatic interaction energy is also recorded.
MacroDox determines the closest approach of the two molecules based on a preselected reaction criterion. The reaction criterion used for these studies is the smallest metal to metal distance. This was chosen as the reaction criterion to select for electron-transfer-active complexes. The smallest value of the reaction criterion for the trajectory shown in Fig. 3 is at point C. For each trajectory, MacroDox records the value of C and various properties of the complex formed at that point. These include the following: a), The structure of the complex formed in the form of a PDB file; b), the fifteen closest electrostatic contacts; and c), the electrostatic interaction energy. After the BD simulation is concluded, the number of successes is determined as a function of reaction criterion distance. Electron transfer rates are calculated as a function of reaction coordinate distance using an equation derived by Northrup et al. (1987a, 1993) from the theories of Smoluchowski. These equations calculate second order rate constants (k2) from the fraction of trajectories that met the preset reaction criteria. Unless otherwise indicated, a value of 20 Å for the metal to metal distance was used to calculate rate constants in these studies, because it was sufficient to include essentially all of the electrostatic complexes formed while excluding those formed solely by random Brownian motion (Fig. 4).
FIGURE 4.
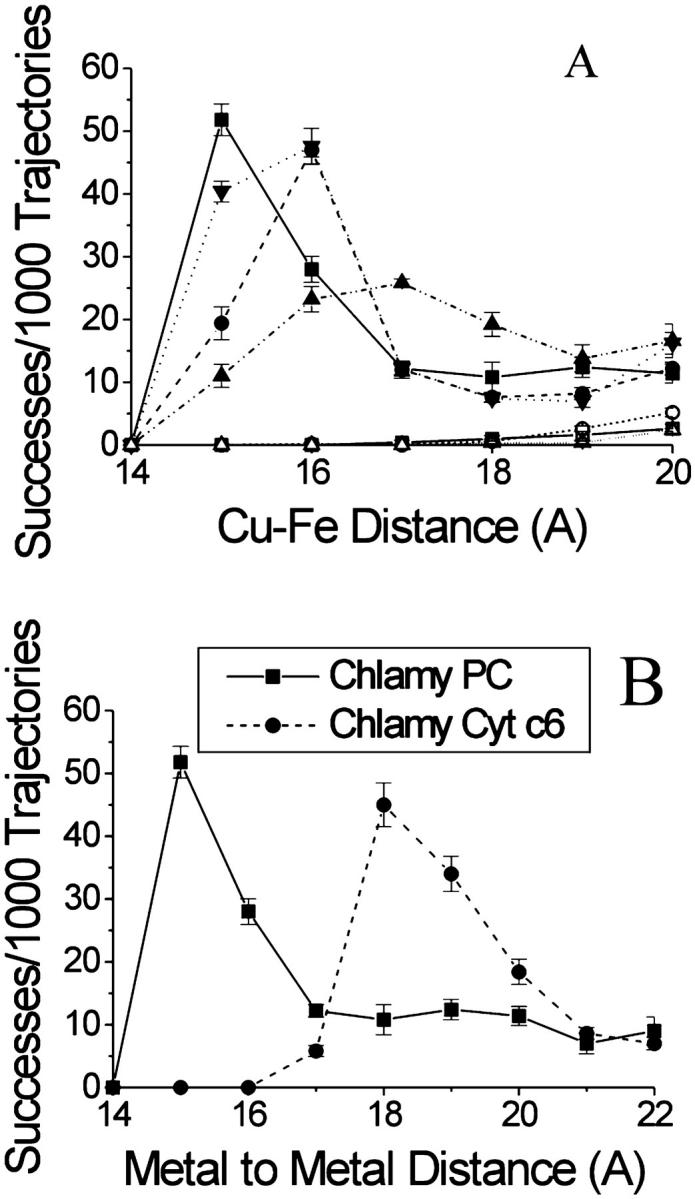
MacroDox simulations of the interaction of cyt f with PC and cyt c6. (A) The interaction of Chlamydomonas cyt f with PCs from Chlamydomonas, spinach, and Anabaena as well as azurin. Chlamydomonas cyt f-Chlamydomonas PC (▪); turnip cyt f-spinach PC (•); Chlamydomonas cyt f-spinach PC (Δ); turnip cyt f-spinach PC (∇); Chlamydomonas cyt f-Chlamydomonas PC-no electrostatic field (□); Chlamydomonas cyt f-Anabaena PC (▵); Chlamydomonas cyt f-azurin (○). (B) The interaction of Chlamydomonas cyt f with Chlamydomonas PC and cyt c6. Five sets of 1000 trajectories each were carried out at 10 mM ionic strength (pH 7.0) after which the number of successful complexes was plotted as a function of Cu-Fe (PC, azurin) or Fe-Fe (cyt c6) distance at closest approach. The number of complexes with distances of closest metal to metal distance rounded to the next highest Å. Other conditions were as described in the Methods section.
Analysis of the complexes formed
Ten complexes formed between wild-type (WT) cyt f and PC or cyt c6 were selected for further analysis. These complexes were selected at random from those complexes with metal to metal distances less than the mean of the peaks shown in Fig. 4 B. Cyt f-PC complexes with Cu-Fe distances ≤15.5 Å and cyt f-cyt c6 complexes with Fe-Fe distances of ≤17.5 Å were chosen. The smallest Fe-Fe distance for the cyt f-cyt c6 interactions was larger due to the greater metal to metal distance at the point of contact between the two proteins.
Close contacts between the two proteins were determined as follows. Electrostatic contacts were determined as described by Northrup et al. (1993). Other contacts were determined using an in-house program that calculates the distance from every atom on Molecule 1 (cyt f) to every atom on Molecule 2 (PC or cyt c6) and records atom pairs with a distance less than or equal to a preset value. The distance selected for this study was 8 Å to observe the closest contacts while allowing for the fact that these complexes have not been energy optimized in any way. A second set of 10 randomly selected cyt f-PC complexes produced the same set of close contacts as the first. To be accepted as a “contact,” a pair of residues must be ≤8 Å apart in at least eight out of the 10 complexes analyzed.
Electrostatic interaction energies in kcal/mol were calculated for the ten complexes chosen using test charges representing Molecule 2 against the Poisson-Boltzmann electrostatic potential grid of Molecule 1 as described above. Hydrophobic interaction energies were calculated as follows. The solvent accessible surface area for the contact residues (Table 1) was calculated by the MacroDox program using the Richards algorithm (Lee and Richards, 1971; Richards, 1977). Electrostatic pairs such as K189-E71 were not included because the only contact between the two residues is via the charged atoms. The areas on cyt f involved in nonpolar interactions with PC and the area on PC involved in hydrophobic interactions with cyt f were calculated. The total hydrophobic surface area was considered to be twice the smaller of the two areas. The same strategy was used to calculate the hydrophobic area for the cyt f-cyt c6 complexes.
TABLE 1.
Residues involved in complex formation between Chlamydomonas cyt f and either Chlamydomonas PC or Cyt c6
| Cyt f | PC | Cyt c6 |
|---|---|---|
| A. All contacts ≤8 Å* | ||
| Y1 | L12, P86, H87 | A16, C17, R66, Heme |
| V3 | L12 | C17, S24, V25 |
| F4 | A90 | A16 |
| Q7 | None | A10, S24 |
| A62 | E85, P86 | G12, R66 |
| N63 | E85 | N13, R66 |
| Y101 | None | G58 |
| Q103 | None | V25 |
| P117 | G34, F35, P36, H87 | A59, Heme |
| K189 | None | E71 |
| Heme | P86 | R66 |
| B. Electrostatic contacts ≤10 Å* | ||
| K65 | E85 | E70, E71 |
| K188 | E43, D44, D53 | E2, E70, E71 |
| K189 | E43, D44, D53 | E2, E70, E71 |
| D68 | None | D65 |
| R156 | None | R66 |
| Heme | None | R66 |
Ten close complexes taken from simulations carried out at 10 mM ionic strength (pH 7.0) were chosen at random for analysis. Both the closest contacts (A) and the closest electrostatic contacts (B) were determined as described in the Methods section.
Reported values for hydrophobic interaction energies vary between −25 and −47 cal/Å2 (Janin and Chothia, 1990; Rose and Wolfenden, 1993; Sharp et al., 1991). Because of the wide variation, both 25 and 47 cal/Å2 were used for our calculations.
All simulations were run on a Silicon Graphics O2 workstation.
RESULTS
The interaction of Chlamydomonas cyt f with PCs from various organisms
Metal to metal distance was selected as the reaction criterion to select for electron transfer-active complexes. The assumption is that those complexes with smallest metal to metal distance will have the highest rates of electron transfer (Moser et al., 1992; 1995). Using this criterion, the role of potential predocking complexes cannot be evaluated in these studies.
Fig. 5 A compares the number of complexes formed using different cyt fs and PCs (at 10 mM ionic strength and pH 7) plotted as a function of smallest Cu-Fe distance observed for that trajectory (point C in Fig. 3). In these plots, the calculated rate of electron transport is greater: 1), for smaller metal to metal distances and 2), for larger numbers of complexes formed at a given metal to metal distance. Large numbers of complexes were formed at Cu-Fe distances of ≤20 Å for Chlamydomonas cyt f interacting with either spinach or Chlamydomonas PC or turnip cyt f interacting with spinach or Chlamydomonas PC. Thus, higher plant and algal cyt fs and PCs are essentially interchangeable. Maximal complex formation occurs at a Cu-Fe distance of 15 Å for Chlamydomonas cyt f interacting with Chlamydomonas PC.
FIGURE 5.
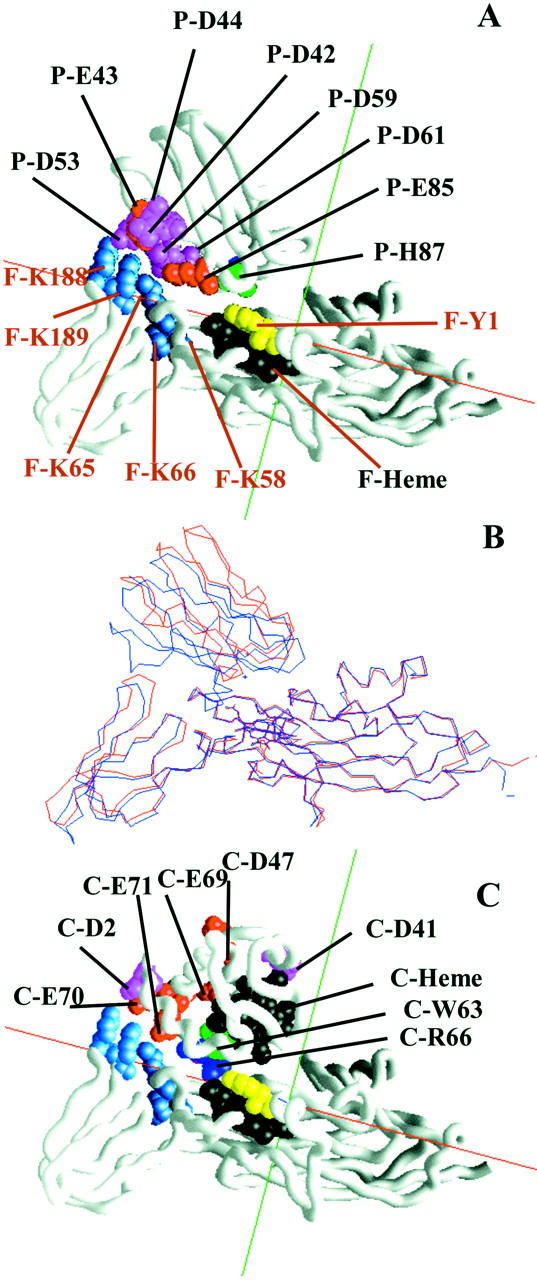
The structure of Chlamydomonas cyt f-PC and Chlamydomonas cyt f-cyt c6 complexes. (A) A typical cyt f-PC complex from MacroDox simulations. (B) The turnip cyt f-spinach PC complex model 1 of Ubbink et al. (1998) (blue) superimposed on that of the Chlamydomonas cyt f-PC BD complex depicted in A (red). The two molecules were superimposed using Deep View from Swiss Prot (Guex and Peitsch, 1997; http://www.expasy.ch/spdbv/) aligning of residues 1–171 of the large domains of the cyt f molecules. (C) A typical cyt f-cyt c6 complex from MacroDox simulations. Representative BD complexes were taken from those used to construct Table 1. See the Methods section for the manner in which the complexes were chosen and displayed. Color codes for A and C were as follows: Heme, black; histidine, green; tyrosine, yellow; arginine, dark blue; lysine, light blue; glutamate, red; asparatate, magenta.
In contrast, Anabaena PC (Badsberg et al., 1996), which lacks most of the negatively charged residues (Gross, 1996) shows no interaction with Chlamydomonas cyt f (Fig. 4 A). Moreover, azurin (Baker, 1988), a related “blue copper” protein, which has a neutral flap replacing the negative patches, also does not interact with Chlamydomonas cyt f. Finally, almost no complexes with Cu-Fe distances ≤20 Å were formed in the absence of the electrostatic field. Thus, complex formation with cyt f is specific for higher plant and green algal PCs that have negatively charged residues surrounding Y83.
The interaction of Chlamydomonas cyt f with Chlamydomonas cyt c6
When the number of complexes formed between cyt f and cyt c6 was determined as a function of metal to metal distance (Fig. 4 B), it was found that the Fe to Fe distance that showed the greatest number of complexes was 18 Å compared to 15 Å for PC. This is due to the fact that the Fe atom is buried ∼2 Å deeper within the cyt c6 molecule. The number of complexes with metal to metal distance of ≤20 Å is 104 ± 11 compared to 123 ± 13 for PC. A distance of 20 Å was used for the determination of electron transport rates because almost all the cyt f-PC and cyt f-cyt c6 complexes observed have metal to metal distances ≤20 Å. The calculated rate constant for electron transfer was 29 ± 2 × 10⁸ M−1 s−1 for cyt c6 compared to 35 ± 2 × 10⁸ M−1 s−1 for PC confirming that the two molecules are essentially interchangeable.
The structure of the complexes formed
Fig. 5 A depicts a typical BD close complex formed between Chlamydomonas cyt f and Chlamydomonas PC. It was chosen from the 10 selected for further analysis as described in the Methods section. This complex is nearly identical to that previously observed in BD simulations of turnip cyt f interacting with either poplar PC (Pearson and Gross, 1998) or spinach PC (Nelson et al., 1999). Similar complexes were also formed in the Monte Carlo calculations of Ullmann et al. (1997b).
Fig. 5 B shows a comparison of the same cyt f-PC complex depicted in Fig. 5 A with the solution structure of a turnip cyt f-spinach PC complex determined by NMR (Ubbink et al., 1998). In this figure, residues 1–171 of the large domains of the two cyt f molecules were superimposed. The first observation is that the hinge angle between the two domains is less for Chlamydomonas cyt f structure B than for turnip cyt f (see also Chi et al (2000)) . The second observation is that PC is less “tilted” toward cyt f in the BD cyt f-PC complex from Chlamydomonas than for the spinach cyt f-turnip PC complex determined by NMR. There are two possible reasons for this. First, the smaller hinge angle observed for Chlamydomonas cyt f will decrease the apparent tilt of PC. Second, the negative charges on PC lie closer to the positive charges on cyt f in the energy-minimized NMR complex (not shown) than for the BD simulations. However, the two types of complexes share two important features: 1), Hydrophobic interactions between nonpolar residues surrounding Y1 on cyt f and those surrounding H87 on PC and 2), electrostatic interactions between residues on the positive patch on cyt f and those in the negative patches on PC.
The cyt f-cyt c6 complex depicted in Fig. 5 C closely resembles that between turnip cyt f and Monoraphidium cyt c6 determined by computer modeling (Fragata and Kajava, structure 1JX8 in the Protein Data Bank). The cyt f-cyt c6 complex shares the same two features as the cyt f-PC complexes: namely, hydrophobic interactions between residues surrounding the metal centers and electrostatic interactions between positively charged residues on cyt f and negatively charged residues on cyt c6.
Residues involved in complex formation
Residues involved in close interactions are listed in Table 1. Ten complexes were chosen at random for analysis as described in the Methods section. Because the complexes were not subject to energy minimization, we chose a criterion of ≤8 Å in at least eight out of 10 complexes. Thus, these contacts represent a minimum interface for complex formation.
Residues on cyt f involved in complex formation with PC include Y1, V3, F4, A62, N63, P117, and the heme. All of these except N63 are hydrophobic in nature. N63 may form a hydrogen bond with E85. Several additional residues on cyt f including Q7, Y101, Q103, and K189 are involved in its interaction with cyt c6. See Fig. 6 for the location of these residues on the cyt f molecule. The only electrostatic interaction with an interatom distance of ≤8 Å is the interaction of K189 on cyt f with E71 on cyt c6. The residues on PC involved in close contacts are L12, G34, F35, P36, P86, E85, H87, and A90. These residues are all hydrophobic in nature except for E85, and form a highly conserved hydrophobic patch in all higher plants and green algae (Gross, 1996; Pearson, 2000). The residues on cyt c6 that interact closely with cyt f are A10, G12, N13, A16, C17, S24, V25, G58, A59, R66, E71, and the heme. All of these residues except N13, S24, and E71 are hydrophobic and even R66 is hydrophobic except for the guanido group.
FIGURE 6.

Locations of the binding site(s) on cyt f for PC and cyt c6. Binding site for cyt c6 alone: gray with label in italics; binding site for both PC and cyt c6: black.
Electrostatic interactions are observed upon increasing the sphere of interactions to 10 Å (Table 1 B). K65, K188, and K189 on cyt f interact with E43, D44, D53, and E85 on PC and E2, E70, and E71 on cyt c6. In addition, D68 on cyt f interacts with D65 on cyt c6 and both R156 and the heme on cyt f interact with R66 on cyt c6. These observations are in agreement with experimental results. Kannt et al. (1996) and Lee et al. (1995) observed that mutagenesis of E43 and D44 on PC inhibited electron transfer between turnip cyt f and either spinach or silene PC. D53 on PC has also been shown to be involved in the NMR complexes of Ubbink et al. (1998) and its removal by mutagenesis inhibited electron transfer from turnip cyt f to pea PC (Gong et al., 2000).
Hydrophobic and electrostatic interaction energies
In these studies as well as those of Pearson and Gross (1998), electrostatic forces bring PC and cyt c6 into a dock on cyt f, which is largely hydrophobic in nature. For this reason, we have calculated both the electrostatic and hydrophobic interaction energies for the complexes formed (Table 2). Hydrophobic interaction energies are in the range from −7.5 to −14.1 kcal mol−1 for the interaction of cyt f and PC, and in the range from −13.8 to −26.0 kcal mol−1 for the interaction of cytochrome f with cyt c6. The values obtained for the Chlamydomonas cyt f-PC complexes are very close to those for Complex 2 of the manually docked turnip cyt f/poplar PC complexes studied by Pearson et al. (1996), namely −6.4 and −12.0 kcal mol−1.
TABLE 2.
Electrostatic and hydrophobic interaction energies
| PC | Cyt c6 | |
|---|---|---|
| A. Hydrophobic and electrostatic interaction energies for wild-type (WT) cyt f interacting with PC and cyt c6 at 10 mM ionic strength (pH 7.0)* | ||
| Hydrophobic surface area (Å2) | 300 | 554 |
| Hydrophobic interaction energy (Kcal mol−1) | ||
| A. assuming −25 (cal/Å2) | −7.5 | −13.8 |
| B. assuming −47 (calÅ2) | −14.1 | −26.0 |
| Electrostatic interaction energy (Kcal mol−1) | −10.5 ± 1.5 | −12.2 ± 3.5 |
| Electrostatic interaction energies
|
|||
|---|---|---|---|
| Cyt f | Ionic strength (mM) | (kcal mol−1) | % Inhibition‡ |
| B. Electrostatic interaction energies for the interaction of cyt f with PC under different conditions† | |||
| WT | 10 | −10.5 ± 1.5 | |
| WT | 300 | −2.5 ± 1.4 | 66 |
| K189A 10 | −6.1 ± 1.8 | 42 | |
| K189E 10 | −1.9 ± 2.3 | 82 | |
Hydrophobic interaction energies were calculated for the ten close complexes selected for Table 1. See Methods section for details of the calculations.
Ten close complexes were chosen at random from BD simulations of the interaction of wild-type and mutant cyt fs with PC under the conditions shown. Other conditions are as described in the Methods section.
Compared to wild-type (WT) cyt f complexes at 10 mM ionic strength.
In comparison, electrostatic interaction energies were from −10.5 ± 1.5 to −12.2 ± 3.5 kcal mol−1 for cyt f -PC and cyt f-cyt c6 complexes, respectively. The result for PC is close to the −15.6 kcal mol−1 value obtained by Meyer et al. (1993) from flash photolysis experiments of turnip cyt f-spinach PC interactions and the −12.5 kcal mol−1 calculated for the interaction of turnip cyt f-silene PC complexes at zero ionic strength (Lee et al., 1966). The PC results also agree well with those obtained by Pearson et al. (1996) for the manually docked Complex 2 (−9.8 kcal mol−1). Thus, Complex 2 of Pearson et al. (1996) is very similar to our BD complexes in energetics as well as structure. Electrostatic interactions of the same order of magnitude were obtained by Northrup et al. (1993) for the interaction of cytochrome c peroxidase with cytochrome c. However, the values of interaction energies calculated in these simulations may be overestimated by as much as 25% because PC and cyt c6 are treated as series of point charges in a high dielectric medium as well as neglecting desolvation effects as described in the Methods section. Increasing the ionic strength decreases the electrostatic interaction energy of cyt f-PC complexes as do the K189A and K189E mutations (Table 1 B).
Orientation of the BD complexes
The question arises as to whether the complexes observed in BD simulations have a unique orientation. Fig. 7, A and B, depict the peptide backbones of five cyt f-PC BD complexes and five cyt f-cyt c6 BD complexes chosen at random from those used to construct Table 1. All five cyt f-PC complexes have essentially the same orientation as do all five of the cyt f-cyt c6 complexes. The electrostatic interactions that occur on only one side of the complexes (Fig. 5) hold the proteins in the proper orientation for electron transfer. Increasing the ionic strength to 300 mM for cyt f-PC complexes (Fig. 7 E) causes the orientations to be more random. PC is also less tilted toward cyt f than at 10 mM but PC binds to the same location on cyt f as at low ionic strength. Complexes formed between cyt f mutants K189A (Fig. 7 C) and K189E (Fig. 7 D) and PC also show an increase in the randomness of orientation as a result of the decrease in electrostatic interaction energy (Table 2).
FIGURE 7.

Orientation of complexes. (A) Cyt f-PC complexes. (B) Cyt f-cyt c6 complexes. (C) K189A-cyt f-PC complexes. (D) K189E-cyt f-PC complexes. (E) Wild-type cyt f at 300 mM ionic strength. Five complexes were chosen for each condition and were superimposed using GRASP. The protein backbones, the cyt f heme and the PC Cu atoms are shown. The ionic strength is 10 mM except where indicated.
In conclusion, the complexes formed between cyt f and PC closely resemble those formed between cyt f and cyt c6. In each case, strong electrostatic interactions bring PC or cyt c6 to a hydrophobic dock on cyt f, which provides a direct pathway for electron transfer between the two molecules.
Mutants of Chlamydomonas cyt f
One way to examine the electrostatic nature of the interactions is to study the effect of mutations. Several mutants of lysine positive patch residues of cyt f have previously been used to study the interaction of Chlamydomonas cyt f with PC both in vivo (Soriano et al., 1996; Zhou et al., 1996) and in vitro (Soriano et al., 1998; Gong et al., 2000). The in vitro studies show that removal of positively charged residues on cyt f inhibits electron transfer between cyt f and PC. In contrast, the in vivo studies show little or no effect of removing positively charged residues on cyt f.
BD simulations of several cyt mutants (Fig. 8 A) show varying degrees of inhibition of complex formation. The greatest inhibition was observed for K189E-cyt f which has a change in charge of −2 units. However, significant inhibition was also observed for K65A- and K189A-cyt f. Both of these residues are located within the positive patch on cyt f (Figs. 1 and 8 B). For single mutants (i.e., those for which the change in charge was −1) the inhibition was less for K122A- and K110-cyt f . These residues lie outside the positive patch.
FIGURE 8.

The effect of cyt f mutants on the formation of cyt f-PC complexes at 10 mM ionic strength. (A) The number of complexes formed as a function of Cu-Fe distance for wild-type and cyt f mutants. Other conditions were as for Fig. 4. (B) Position of the mutants on cyt f. Inhibition of complex formation: Class I, ≤30% (R88, K94, K110, K164, and K165), light gray; Class II, 30–60% (K58, K66, K121, K122, R156, and R207) dark gray with labels in italics; Class III, > 60% (K65, K188, and K189), black with labels underlined.
The results obtained for a large selection of single mutants is summarized in Table 3, which presents both the number of complexes formed with metal-metal distances ≤20 Å and the corresponding rate constants for electron transfer. The consequences of choosing a reaction criterion distance of ≤20 Å for the calculation of reaction rates will be discussed below.
TABLE 3.
The effect of single mutations of cationic residues on cytochrome f on its interactions with plastocyanin and cytochrome c6 at 10 mM ionic strength
| Cyt f* | Successes/1000 Traj.† | PC % Inhibition‡ | Rate 10−8 (M−1 s−1)§ | Successes/1000 Traj. | Cyt c6 % Inhibition | Rate 10−8 (M−1 s−1) |
|---|---|---|---|---|---|---|
| Class I¶ | ||||||
| W.T. | 123 ± 13 | — | 35 ± 2 | 104 ± 11 | — | 29 ± 2 |
| K217A | 120 ± 14 | 2 | 34 ± 2 | — | — | — |
| R88A | 102 ± 11 | 17 | 29 ± 2 | — | — | — |
| K165A | 95 ± 10 | 23 | 28 ± 2 | — | — | — |
| K110A | 91 ± 9 | 26 | 27 ± 3 | 92 ± 6 | 12 | 26 ± 1 |
| K29A | 91 ± 11 | 26 | 26 ± 2 | 79 ± 8 | 24 | 22 ± 2 |
| K164A | 90 ± 5 | 27 | 26 ± 3 | 73 ± 5 | 29 | 21 ± 2 |
| Class II | ||||||
| K94A | 85 ± 7 | 31 | 25 ± 2 | — | — | — |
| K207A | 78 ± 5 | 37 | 23 ± 2 | — | — | — |
| R156A | 74 ± 8 | 40 | 22 ± 2 | 53 ± 6 | 49 | 16 ± 2 |
| K121A | 70 ± 7 | 43 | 21 ± 3 | — | — | — |
| K122A | 70 ± 10 | 43 | 21 ± 2 | 39 ± 6 | 63 | 12 ± 2 |
| K66A | 62 ± 10 | 50 | 20 ± 2 | 61 ± 8 | 41 | 17 ± 1 |
| K58A | 57 ± 4 | 54 | 17 ± 3 | 60 ± 9 | 52 | 17 ± 2 |
| K58Q | 49 ± 6 | 60 | 15 ± 2 | — | — | — |
| Class III | ||||||
| K65S | 46 ± 2 | 63 | 14 ± 2 | — | — | — |
| K65A | 44 ± 3 | 64 | 13 ± 2 | 30 ± 5 | 71 | 9 ± 1 |
| K188A | 39 ± 5 | 68 | 12 ± 2 | 28 ± 3 | 73 | 8 ± 2 |
| K188N | 33 ± 4 | 73 | 10 ± 2 | — | — | — |
| K189Q | 38 ± 5 | 69 | 11 ± 2 | — | — | — |
| K189A | 33 ± 5 | 73 | 10 ± 2 | 23 ± 4 | 78 | 7 ± 1 |
Single mutations are mutants with a charge change of −1 (e.g., K→A)
Five runs of 1000 trajectories each were carried out after which the number of successful trajectories with metal to metal distances ≤20 Å were calculated. Other conditions were as for Fig. 8.
% Inhibition = 100 × (WT-mutant)/W.T. where WT refers to wild type.
Calculated using the Smolochowski equation based on complexes with a metal to metal distance of ≤20 Å as a reaction criterion. Other conditions were as described in the Methods section.
Class I: ≤30% inhibition; Class II: 30–60% inhibition; Class III: >60% inhibition.
The mutants were divided into three classes for the purposes of discussion. Class I includes those mutants with inhibitions of complex formation ≤30%; Class II includes mutants with inhibition of complex formation between 30 and 60%; and Class III includes mutants with inhibitions >60%. Class III mutants include K65A-, K188A- and K189A-cyt f, all in the positive patch. Positive patch mutants K66A- and K58A-cyt f show slightly less inhibition and, hence, fall into Class II. Other Class II mutants include K207A, R156A, K121A, and K122A.
K58A- and K58Q-cyt f show similar results to within the limit of error. The same is true for K189A- and K189Q-cyt f and for K188A and K188N-cyt f. These results show that there is no steric hindrance that would be picked up by MacroDox.
Also, almost all of the mutants show the same degree of inhibition for both PC and cyt c6 as electron acceptors. The one exception is K122A-cyt f, which shows significantly greater inhibition when donating electrons to cyt c6 compared to PC. The results for the mutants provide even more evidence that PC and cyt c6 are interchangeable.
The locations of all of the mutants studied (with the exception of K29A, which is located on the backside of cyt f) are shown in Fig. 8 B. It can be seen that the inhibition decreases the further away one gets from the positive patch. In other words, mutants of positive-patch residues cause the greatest inhibition and, thus, are the most important for determining the interaction of Chlamydomonas cyt f with either PC or cyt c6.
The importance of positive patch residues K65, K188, and K189 is confirmed by the observation that these three residues are among the electrostatic contacts listed in Table 1 for both PC and cyt c6. Also, K189A-cyt f shows a 42% decrease in the electrostatic interaction energy for cyt f interacting with PC (Table 2 B).
Mutants that change the charge by −2 units
K→E mutants (Table 4), in which the charge on cyt f is changed by −2 units, showed a greater degree of inhibition of complex formation and rates of electron transfer than did K→A mutants of the same residues. This is particularly striking for double mutants of positive patch residues K65, K188, and K189, in which the number of complexes formed was almost zero and comparable to the number formed by simple diffusion alone in the absence of an electrostatic field. Note that the electrostatic interaction energy for K189E-cyt f interacting with PC is also almost zero (Table 2 B). Cyt f mutants with a change in charge of −1 on each of two residues, namely K188N + K189Q, show the same degree of inhibition as K65E.
TABLE 4.
The effect of double mutations of cationic residues on Chlamydomonas cyt f on its interaction with PC and cyt c6 at 10 mm ionic strength
| PC
|
Cyt c6
|
|||||
|---|---|---|---|---|---|---|
| Cyt f* | Successes/1000 Traj.† | % Inhibition | Rate 10−8 (M−1 s−1) | Successes/1000 Traj. | % Inhibition | Rate 10−8 (M−1 s−1) |
| K110E | 75 ± 3 | 39 | 22 ± 2 | 54 ± 7 | 48 | 16 ± 2 |
| K66E | 42 ± 7 | 66 | 13 ± 2 | 30 ± 4 | 72 | 9 ± 2 |
| K58E | 18 ± 5 | 85 | 6 ± 1 | 17 ± 4 | 83 | 5 ± 1 |
| K188E | 10 ± 1 | 92 | 3 ± 1 | 8 ± 3 | 92 | 2.4 ± 1.1 |
| K189E | 10 ± 3 | 92 | 3 + 1 | 4 + 2 | 96 | 1.1 + 0.6 |
| K65E | 6 ± 4 | 95 | 2 ± 0.7 | 3 ± 1 | 97 | 1.0 ± 0.6 |
| K188N + K189Q | 8 ± 2 | 96 | 1.8 ± 0.8 | — | — | — |
| Electrostatic field off‡ | 5 ± 3 | 96 | 1.6 ± 0.7 | 9 ± 3 | 92 | 2.1 ± 0.9 |
Double mutations are those with a change in charge of −2 units.
Other conditions were as for Table 3.
Calculated with electrostatic field turned off.
Complexes formed between K189A-cyt f and PC (Fig. 7 C) were less uniform in orientation than complexes observed for wild-type cyt f. Complexes formed between K189E-cyt f and PC (Fig. 7 D) showed an even greater variation in orientation. Similar results were also obtained for K65A-cyt f-PC complexes and K65E-cyt f-PC complexes (not shown). However, none of these mutants affected the degree of tilt of PC.
The interaction of mutant cyt fs with PC at 300 mM ionic strength
It has been shown that electrostatic forces are important for complex formation under low ionic strength conditions (namely, 10 mM). The question arises concerning the role of electrostatic forces at higher ionic strengths that more closely resemble in vivo conditions. Whereas the ionic strength of the lumen of the thylakoid is not known, we used the value of 300 mM as an approximation.
The number of close complexes formed and the rate of electron transfer is much lower at 300 mM ionic strength than at 10 mM (Table 5) (i.e., the number of close complexes formed decreased from 123 ± 13 at 10 mM to 17.1 ± 4 at 300 mM ionic strength, and the rates of electron transport decreased from 35 ± 2 to 5.2 ± 0.9 × 10⁸ M−1 s−1). Nonetheless, the number of complexes formed and the rates of complex formation observed are still larger than in the absence of the electrostatic field. Further evidence for the presence of electrostatic forces even at 300 mM is that cyt f mutations still affect both the number of complexes formed and the corresponding electron transfer rates (Table 5), although the percent inhibition accompanying a charge change of −1 unit is less at 300 mM than at 10 mM. As at 10 mM, K65E and K189E are more effective than K65A and K189A. The most severe inhibition was observed for the K58Q + K65S + K66E + K188N + K189Q mutant, which has a net change in charge of −6. In conclusion, electrostatic fields are still operative at 300 mM ionic strength.
TABLE 5.
The effect of mutations of positively charged residues on cytochrome f on its interactions with plastocyanin at 300 mm ionic strength
| Cyt f | Successes/1000 Trajectories* | % Inhibition† | Rate of electron transport 10−8 (M−1 s−1) |
|---|---|---|---|
| WT | 17.1 ± 4.0 | — | 5.2 ± 0.9 |
| K189A | 11.5 ± 3.8 | 33 | 3.5 ± 0.7 |
| K65A | 11.4 ± 3.4 | 33 | 3.5 ± 0.7 |
| K189E | 7.4 ± 0.5 | 57 | 2.3 ± 0.6 |
| K65E | 8.3 ± 0.7 | 51 | 2.6 ± 0.5 |
| K58Q + K65S + K66A | 8.9 ± 0.6 | 48 | 2.8 ± 0.6 |
| K58Q + K65S + K66E + K188N + K189Q | 5.4 ± 0.9 | 68 | 1.7 ± 0.6 |
| Electrostatic field off | 3.7 ± 0.1 | 78 | 1.1 ± 0.5 |
To obtain better statistics, five runs of 10,000 trajectories each were carried out at an ionic strength of 300 mM after which the number of successful trajectories with minimum Cu-Fe distance ≤20 Å were calculated. Other conditions were as for Table 3.
Compared to WT control at 300 mM.
DISCUSSION
MacroDox is a very useful program for examining electrostatic interactions between proteins. One advantage is that it includes random, diffusional factors as well as electrostatic components. It also requires relatively little computational time per simulation (compared to many Monte Carlo simulations, for example) so that a large number of conditions (mutations, different ionic strengths, etc.) can be studied in a brief time. It also provides a large amount of information concerning the complexes formed. In the present version of MacroDox, both molecules have irregular geometries taken from PDB files allowing a study of steric effects. This is because the MacroDox program checks for overlaps between the two molecules after each step in the trajectory. For example, MacroDox was able to distinguish between wild-type and a Y10G mutant of Prochlorothrix PC in simulations of its interactions with Phormidium cyt f (Gross, 2001).
Weaknesses of MacroDox include the following. First, hydrophobic interactions are not explicitly included. Both molecules are rigid, not permitting conformational changes in the two molecules as they approach each other as they dock. There is, however, one advantage of this in that a particular conformation of a molecule can be studied and compared with other conformations of the same molecule. Second, whereas the Tanford-Kirkwood method for determining pKs is adequate for pH 7, a new algorithm is needed to study cyt f-PC and cyt f-cyt c6 interactions under the low pH (∼4) conditions that exist in the lumen of the thylakoid. Third, in MacroDox BD simulations, Molecule 2 lacks a low dielectric cavity because of computational difficulties (Northrup et al., 1993; Gabdoulline and Wade, 2001), and mutual desolvation effects are not considered (Elcock et al., 1999). Gabdoulline and Wade (1996) have developed a method using effective charges to compensate for the absence of a low dielectric cavity in Molecule 2.
How well do rate constants for electron transport obtained in BD simulations agree with experimental results? The rate constant for electron transport as determined by BD simulations for cyt f-PC interactions was 12.4 ± 0.7 × 10⁸ M−1 s−1 at 100 mM ionic strength (Table 6). The experimental values for the rate constants determined by stopped-flow methods also at 100 mM was 1.75 × 10⁸ M−1 s−1 for pea PC interacting with turnip cyt f (Gong et al., 2000) and 1.07 × 10⁸ M−1 s−1 for Chlamydomonas PC interacting with Chlamydomonas cyt f (Soriano et al., 1998). Reasons for this difference will be discussed below.
TABLE 6.
Comparison of the effect of cyt f mutations as computed by MacroDox with experimental results at an ionic strength of 100 mm
| MacroDox results
|
Experimental results
|
|||
|---|---|---|---|---|
| Cytochrome f | Rate of electron transport 10−8 (M−1 s−1)* | % Inhibition | Rate of electron transport 10−8 (M−1 s−1) | % Inhibition |
| Gong et al. (2000)† | ||||
| W.T. | 12.4 ± 0.7 | — | 1.75 | — |
| K58Q | 9.0 ± 0.7 | 27 | 1.09 | 38 |
| K65Q | 5.8 ± 0.7 | 53 | 0.35 | 80 |
| K188E | 4.3 ± 0.5 | 65 | 0.28 | 82 |
| Soriano et al. (1998)‡ | ||||
| WT | 12.4 ± 0.7 | — | 1.07 | — |
| K188N + K189Q | 2.8 ± 0.4 | 77 | 0.28 | 74 |
The ionic strength was 100 mM. Other conditions were as for Table 4. All simulations were carried out with Chlamydomonas PC and Chlamydomonas cy t f.
Experimental values were for pea PC interacting with turnip cyt f.
Experimental values were for Chlamydomonas PC interacting with Chlamydomonas cyt f.
Experimental and MacroDox results for three cyt f mutants are shown in Table 6. The K188N + K189Q-Chlamydomonas cyt f mutant of Soriano et al. (1998) shows the same percent inhibition in the simulations as in the measured rates of electron transport. K188N + K189Q is one of the mutants described by Soriano et al. (1998), who observed a significant effect in vitro but almost no effect in vivo (Soriano et al., 1996). However, Soriano et al. (1996) did observe a 15–30% decrease in oxygen evolution for this mutant.
A slightly greater degree of inhibition was obtained for the experimentally determined rates for turnip cyt f interacting with pea PC. However, the relative extent of inhibition (i.e., the order of increasing inhibition: namely, K58Q, K65Q, and K188E) is the same for both simulations and experiments. This is important because it shows that BD simulations can be used to predict the effects of mutations.
There are at least three reasons that the computed electron transfer rates are greater than the experimental electron transfer rates. The first reason concerns the choice of reaction criterion. We chose 20 Å as a reaction criterion to include any complexes that could possibly result in electron transfer. Decreasing the reaction criterion to 15 Å, which includes only the closest complexes, decreases the calculated rate to 2.4 ± 0.4 × 10⁸ M−1 s−1 compared to 1.1–1.7 × 10⁸ M−1 s−1 observed in experiments. Second, no attempt was made to correct for the attenuation in electron transfer rates due to the distance between the metal centers (Moser et al., 1992; 1995). Third, the failure to model Molecule 2 (PC or cyt c6) with a low dielectric cavity would also cause an overestimation of the reaction rate as would the failure to consider desolvation effects.
The most interesting result of these studies is the similarity between the cyt f-PC and the cyt f-cyt c6 complexes. Electrostatic and hydrophobic forces are involved in stabilizing both types of complexes. Also, residues K65, K188, and K189 are involved in the formation of both cyt f-PC and cyt f-cyt c6 complexes. Because of the similarities between the two types of complexes, it is easy to see how PC and cyt c6 can be used interchangeably by Chlamydomonas cells (Merchant and Bogorad, 1986) despite the difference in primary and secondary structure between the two molecules.
Another interesting feature is that both cyt f-PC and cyt f-cyt c6 complexes are very homogenous in orientation (Fig. 7) even though the only reaction criterion used was metal to metal distance. No orientation angle criterion was specified. The uniformity in orientation is the result of the fact that the charged residues involved in complex formation are all located on one side of their respective molecules. As a consequence, decreasing the electrostatic interactions by mutation or by increasing the ionic strength causes the orientation of the complexes to be more random.
It is envisioned (Bendall, 1996; Crnogorac et al., 1996; Qin and Kostic, 1993) that PC and cyt c6 form an initial electrostatic encounter complex with cyt f, followed by a rearrangement that brings PC or cyt c6 into an electron-transfer-active configuration. The complexes observed in these BD simulations are not initial encounter complexes that probably resemble the Type 1 complexes of Pearson et al. (1996) in which electrostatic forces dominate; hydrophobic forces are nonexistent, and the metal to metal distance is ≥30 Å, too large for efficient electron transfer (Moser et al., 1992, 1995). They are not the close, electron-transfer active complexes of Ubbink et al. (1998), but they are definitely close to those electron-transfer active complexes. To observe the final electron-transfer-active complexes in BD simulations, it would be necessary to include both hydrophobic interactions and energy minimization.
The results obtained for BD simulations of cyt f mutants agree with the in vitro experiments of Soriano et al. (1998) and Gong et al. (2000) but not with the in vivo experiments (Soriano et al., 1996; Zhou et al., 1996). One possible explanation is that electrostatic effects may be less important under the high ionic strength conditions found in the lumen of the thylakoid. However, the results presented in Table 5 show that, although the rates of electron transport are lower at 300 mM ionic strength, electrostatic effects still determine reaction rates.
The difference also cannot be solely due to the small size of the lumen of the thylakoid for the following reasons. Decreasing the value of B, the starting radius for the BD simulations, from 87 Å to 40 Å (not shown) did not significantly increase the number of complexes formed in the absence of the electrostatic field, nor did it decrease the effect of the mutations on the number of complexes formed and the rates of electron transfer. It is uncertain what causes the difference in behavior in vivo compared to in vitro, but differences in growth conditions of the Chlamydomonas cells may be involved.
CONCLUSIONS
BD simulations showed that Chlamydomonas PC and cyt c6 interact with cyt f in the same manner despite the differences in primary and secondary structure. Electrostatic and hydrophobic interactions are involved in the formation of both cyt f-PC and cyt f-cyt c6 complexes. Also, residues K65, K188, and K189 of the basic patch on cyt f are involved in the formation of both types of complexes as determined by measurements of close contacts and the effect of mutations. Mutation of these residues decreased complex formation and the rate of electron transport in agreement with the results of in vitro experiments of Soriano et al. (1998) and Gong et al. (2000). Decreasing the electrostatic interaction energy by either mutation or increasing the ionic strength decreased the orientational uniformity of the complexes without affecting their basic structure.
Acknowledgments
The authors thank the Department of Biochemistry at The Ohio State University for its support and Mr. Esmael Haddadian and Dr. Mark Foster for their careful reading of the manuscript. We thank Professors Scott Northrup and Kathryn Thomasson for their helpful discussions, and Mr. Hassan Borteh for writing the program to determine contact distances between residues on the two proteins in a complex.
References
- Anderson, G. P., D. G. Sanderson, C. H. Lee, S. Durell, L. B. Anderson, and E. L. Gross. 1987. The effect of ethylene diamine chemical modification of plastocyanin on the rate of cytochrome f oxidation and P-700+ reduction. Biochim. Biophys. Acta. 894:386–398. [DOI] [PubMed] [Google Scholar]
- Badsberg, U., A. M. Jorgensen, H. Gesmar, J. J. Led, J. M. Hammerstad, L. L. Jespersen, and J. Ulstrop. 1996. Solution structure of reduced plastocyanin from the blue-green alga Anabaena variabilis. Biochemistry. 35:7021–7031. [DOI] [PubMed] [Google Scholar]
- Baker, E. N. 1988. Structure of azurin from Alcaligenes denitrificans: refinement at 1.8 Å resolution and comparison of the two crystallographically independent molecules. J. Mol. Biol. 203:1071–1095. [DOI] [PubMed] [Google Scholar]
- Bendall, D. S. 1996. Interprotein electron transfer. In Protein Electron Transfer, D. S. Bendall, editor. Bios. Scientific Publisher, Oxford, UK. 43–68.
- Berman, H. M., J. Westbrook, Z. Feng, G. Gilliland, T. N. Bhat, H. Weissig, L. N. Shindyalov, and P. E. Bourne. 2000. The protein data bank. Nucleic Acids Res. 28:235–242. [DOI] [PMC free article] [PubMed] [Google Scholar]
- Chi, Y. I., L. S. Huang, Z. Zhang, J. G. Fernandez-Velasco, and E. A. Berry. 2000. X-ray structure of a truncated form of cytochrome f from chlamydomonas reinhardtii. Biochemistry. 39:7689–7701. [DOI] [PubMed] [Google Scholar]
- Cramer, W. A., G. M. Soriano, M. Ponomarev, D. Huang, H. Zhang, S. E. Martinez, and J. L. Smith. 1996. Some new structural aspects and old controversies concerning the cytochrome b6f complex of oxygenic photosynthesis. Annu. Rev. Plant. Physiol. Plant Mol. Biol. 47:477–508. [DOI] [PubMed] [Google Scholar]
- Crnogorac, M. M., C. Shen, S. Young, O. Hansson, and N. M. Kostic. 1996. Effect of mutations in plastocyanin on the kinetics of the protein rearrangement gating the electron-transfer reaction with zinc cytochrome c. Analysis of the rearrangement pathway. Biochemistry. 35:16465–16474. [DOI] [PubMed] [Google Scholar]
- De Rienzo, F., R. R. Gabdoulline, M. C. Menziani, P. G. De Benedetti, and R. C. Wade. 2001. Electrostatic analysis and Brownian dynamics simulation of the association of plastocyanin and cytochrome f. Biophys. J. 81:3090–3104. [DOI] [PMC free article] [PubMed] [Google Scholar]
- Durell, S. R., J. K. Labanowski, and E. L. Gross. 1990. Modeling the electrostatic potential field of plastocyanin. Arch. Biochem. Biophys. 277:241–254. [DOI] [PubMed] [Google Scholar]
- Ejdeback, M., A. Bergkvist, B. G. Karlsson, and M. Ubbink. 2000. Side-chain interactions in the plastocyanin-cytochrome f complex. Biochemistry. 39:5022–5027. [DOI] [PubMed] [Google Scholar]
- Elcock, A. H., R. R. Gabdoulline, R. C. Wade, and J. A. McCammon. 1999. Computer simulation of protein-protein kinetics: acetylcholinesterase-fasciculin. J. Mol. Biol. 291:149–162. [DOI] [PubMed] [Google Scholar]
- Freeman, H. C. 1981. Electron transfer in “blue” copper proteins. Coord. Chem. 21:29–52. [Google Scholar]
- Gabdoulline, R. R., and R. C. Wade. 1996. Effective charges for macromolecules in solvent. J. Phys. Chem. 100:3868–3878. [Google Scholar]
- Gabdoulline, R. R., and R. C. Wade. 1998. Brownian dynamics simulation of protein-protein diffusional encounter. Methods. 14:329–341. [DOI] [PubMed] [Google Scholar]
- Gabdoulline, R. R., and R. C. Wade. 2001. Protein-protein association: investigation of factors influencing association rates by Brownian dynamics simulations. J. Mol. Biol. 9:1139–1155. [DOI] [PubMed] [Google Scholar]
- Gong, X. S., J. Q. Wen, N. E. Fisher, S. Young, C. J. Howe, D. S. Bendall, and J. C. Gray. 2000. The role of individual lysine residues in the basic patch on turnip cytochrome f for the electrostatic interactions with plastocyanin in vitro. Eur. J. Biochem. 267:3461–3468. [DOI] [PubMed] [Google Scholar]
- Gray, J. C. 1992. Cytochrome f: structure, function and biosynthesis. Photosynth. Res. 34:359–374. [DOI] [PubMed] [Google Scholar]
- Gross, E. L. 1993. Plastocyanin: structure and function. Photosynth. Res. 37:103–116. [DOI] [PubMed] [Google Scholar]
- Gross, E. L. 1996. Plastocyanin: structure, location, diffusion, and electron transfer mechanisms. In Oxygenic Photosynthesis: The Light Reactions. D. Ort and C. Yocum, editors. Kluwer Academic Publishers, Dordrecht, the Netherlands. 413–429.
- Gross, E. L. 2001. A Brownian dynamics study of evolutionary changes in the electrostatic interactions between plastocyanin and cytochrome f in cyanobacteria and green plants. Proceedings of the 12th International Congress on Photosynthesis. Brisbane, Australia. S11–014.
- Guex, N., and M. C. Peitsch. 1997. SWISS-MODEL and the Swiss-PdbViewer: an environment for comparative protein modeling. Electrophoresis. 18:2714–2723. [DOI] [PubMed] [Google Scholar]
- Guss, J. M., H. D. Bartunik, and H. C. Freeman. 1992. Accuracy and precision in protein structure analysis: restrained least-squares refinement of the structure of poplar plastocyanin at 1.33 Å resolution. Acta Crystallogr. B. 48:790–811. [DOI] [PubMed] [Google Scholar]
- Harvey, S. C. 1989. Treatment of electrostatic effects in macromolecular modeling. Proteins. 5:78–92. [DOI] [PubMed] [Google Scholar]
- Hauska, G., E. Hurt, N. Gabellini, and W. Lockau. 1983. Comparative aspects of the quinol-cytochrome c/plastocyanin oxidoreductases. Biochim. Biophys. Acta. 726:97–133. [DOI] [PubMed] [Google Scholar]
- Hope, A. B. 2000. Electron transfers amongst cytochrome f, plastocyanin and photosystem I: kinetics and mechanisms. Biochim. Biophys. Acta. 1456:5–26. [DOI] [PubMed] [Google Scholar]
- Janin, J., and C. Chothia. 1990. The structure of protein-protein recognition sites. J. Biol. Chem. 265:16027–16030. [PubMed] [Google Scholar]
- Kannt, A., S. Young, and D. S. Bendall. 1996. The role of acidic residues of plastocyanin in its interaction with cytochrome f. Biochim. Biophys. Acta. 1277:115–126. [PubMed] [Google Scholar]
- Kerfeld, C. A., H. P. Anwar, R. Interrante, S. Merchant, and T. O. Yeates. 1995. The structure of chloroplast cytochrome c6 at 1.9 Å resolution: evidence for functional oligomerization. J. Mol. Biol. 250:627–647. [DOI] [PubMed] [Google Scholar]
- Lee, B. H., T. Hibino, T. Takabe, P. J. Weisbeek, and T. Takabe. 1995. Site-directed mutagenetic study on the role of negative patches on silene plastocyanin in the interactions with cytochrome f and photosystem I. J. Biochem. (Tokyo) 117:1209–1217. [DOI] [PubMed] [Google Scholar]
- Lee, B., and F. M. Richards. 1971. The interpretation of protein structures: estimation of static accessibility. J. Mol. Biol. 55:379–400. [DOI] [PubMed] [Google Scholar]
- Martinez, S. E., D. Huang, A. Szczepaniak, W. A. Cramer, and J. L. Smith. 1994. Crystal structure of the chloroplast cytochrome f reveals a novel cytochrome fold and unexpected heme ligation. Structure. 2:95–105. [DOI] [PubMed] [Google Scholar]
- Martinez, S. E., D. Huang, M. Ponomarev, W. A. Cramer, and J. L. Smith. 1996. The heme redox center of chloroplast cytochrome f is linked to a buried five-water chain. Protein. Sci. 5:1081–1092. [DOI] [PMC free article] [PubMed] [Google Scholar]
- Matthew, J. B. 1985. Electrostatic effects in proteins. Annu. Rev. Biophys. Biophys. Chem. 14:387–417. [DOI] [PubMed] [Google Scholar]
- McCammon, J. A., and S. C. Harvey. 1987. Dynamics of Proteins and Nucleic Acids. Cambridge University Press, Cambridge.
- Merchant, S., and L. Bogorad. 1986. Regulation by copper of the expression of plastocyanin and cytochrome c552 in Chlamydomonas reinhardii. Mol. Cell. Biol. 6:462–469. [DOI] [PMC free article] [PubMed] [Google Scholar]
- Meyer, T. E., Z. G. Zhao, M. A. Cusanovich, and G. Tollin. 1993. Transient kinetics of electron transfer from a variety of c-type cytochromes to plastocyanin. Biochemistry. 32:4552–4559. [DOI] [PubMed] [Google Scholar]
- Morand, L. Z., M. K. Frame, K. K. Colvert, D. A. Johnson, D. W. Krogmann, and D. J. Davis. 1989. Plastocyanin cytochrome f interaction. Biochemistry. 28:8039–8047. [DOI] [PubMed] [Google Scholar]
- Moser, C. C., J. M. Keske, K. Warncke, R. S. Farid, and P. L. Dutton. 1992. Nature of biological electron transfer. Nature. 355:796–802. [DOI] [PubMed] [Google Scholar]
- Moser, C. C., C. C Page, R. Farid, and P. L. Dutton. 1995. Biological electron transfer. J. Bioenerg. Biomembr. 27:263–274. [DOI] [PubMed] [Google Scholar]
- Nelson, N., D. C. Pearson, Jr., and E. L. Gross. 1999. The interaction of plastocyanin with cytochrome f: a Brownian dynamics study. In Photosynthesis: Mechanisms and Effects, Vol. 3. G. Garab, editor. Kluwer Academic Publishers, Dordrecht, the Netherlands. 1493–1498.
- Nicholls, A., and B. Honig. 1991. A rapid finite-difference algorithm, utilizing successive over-relaxation to solve the Poisson-Boltzmann equation. J. Comp. Chem. 12:435–445. [Google Scholar]
- Northrup, S. H., J. O. Boles, and J. C. L. Reynolds. 1987a. Electrostatic effects in the Brownian dynamics of association and orientation of heme proteins. J. Phys. Chem. 91:5991–5998. [Google Scholar]
- Northrup, S. H., J. A. Luton, J. O. Boles, and J. C. L. Reynolds. 1987b. Brownian dynamics simulation of protein association. J. Comput. Aided. Mol. Des. 1:291–311. [DOI] [PubMed] [Google Scholar]
- Northrup, S. H., J. O. Boles, and J. C. Reynolds. 1988. Brownian dynamics of cytochrome c and cytochrome c peroxidase association. Science. 241:67–70. [DOI] [PubMed] [Google Scholar]
- Northrup, S. H., K. A. Thomasson, C. M. Miller, P. D. Barker, L. D. Eltis, J. G. Guillemette, S. C. Inglis, and A. G. Mauk. 1993. Effect of charged amino acid mutations on the bimolecular kinetics of reduction of yeast iso-1-ferricytochrome c by bovine ferrocytochrome b5. Biochemistry. 32:6613–6623. [DOI] [PubMed] [Google Scholar]
- Northrup, S. H. 1996. Theoretical simulation of protein-protein interactions. In Cytochrome c: A Multidiciplinary Approach. R. A. Scott and A. G. Mauk, editors. University Science Publishers, Sausalito, CA. 543–570.
- Northrup, S. H. 1999. Macrodox v.2.3.1: Software for the Prediction of Macromolecular Interaction. Tennessee Technological University, Cookeville, TN.
- Pearson, D. C., Jr., E. L. Gross, and E. S. David. 1996. The electrostatic properties of cytochrome f: implications for docking with plastocyanin. Biophys. J. 71:64–76. [DOI] [PMC free article] [PubMed] [Google Scholar]
- Pearson, D. C., Jr., and E. L. Gross. 1998. Brownian dynamics study of the interaction between plastocyanin and cytochrome f. Biophys. J. 75:2698–2711. [DOI] [PMC free article] [PubMed] [Google Scholar]
- Pearson, D. C., Jr. 2000. Brownian Dynamics Study of the Interaction between Cytochrome f and Mobile Electron Transfer Proteins. Ph.D. dissertation. The Ohio State University, Columbus, Ohio.
- Qin, L., and N. M. Kostic. 1992. Electron-transfer reactions of cytochrome f with flavin semiquinones and with plastocyanin. Importance of protein-protein electrostatic interactions and of donor-acceptor coupling. Biochemistry. 31:5145–5150. [DOI] [PubMed] [Google Scholar]
- Qin, L., and N. M. Kostic. 1993. Importance of protein rearrangements in the electron-transfer reaction between the physiological partners cytochrome f and plastocyanin. Biochemistry. 32:6073–6080. [DOI] [PubMed] [Google Scholar]
- Redinbo, M. R., D. Cascio, M. K. Choukair, D. Rice, S. Merchant, and T. O. Yeates. 1993. The 1.5-Å crystal structure of plastocyanin from the green alga Chlamydomonas reinhardtii. Biochemistry. 32:10560–10567. [DOI] [PubMed] [Google Scholar]
- Redinbo, M. R., T. O. Yeates, and S. Merchant. 1994. Plastocyanin: structural and functional analysis. J. Bioenerg. Biomembr. 26:49–66. [DOI] [PubMed] [Google Scholar]
- Richards, F. M. 1977. Areas, volumes, packing and protein structure. Annu. Rev. Biophys. Bioeng. 6:151–176. [DOI] [PubMed] [Google Scholar]
- Rose, G. D., and R. Wolfenden. 1993. Hydrogen bonding, hydrophobicity, packing and protein folding. Annu. Rev. Biophys. Biomol. Struct. 22:381–415. [DOI] [PubMed] [Google Scholar]
- Sharp, K. A., A. Nicholls, R. F. Fine, and B. Honig. 1991. Reconciling the magnitude of the microscopic and macroscopic hydrophobic effects. Science. 252:106–109. [DOI] [PubMed] [Google Scholar]
- Sigfridsson, K. 1998. Plastocyanin, an electron-transfer protein. Photosynth. Res. 57:1–28. [Google Scholar]
- Soriano, G. M., M. V. Ponomarev, G. S. Tae, and W. A. Cramer. 1996. Effect of the interdomain basic region of cytochrome f on its redox reactions in vivo. Biochemistry. 35:14590–14598. [DOI] [PubMed] [Google Scholar]
- Soriano, G. M., M. V. Pomamarev, R. A. Piskorowski, and W. A. Cramer. 1998. Identification of the basic residues of cytochrome f responsible for electrostatic docking interactions with plastocyanin in vitro: relevance to the electron transfer reaction in vivo. Biochemistry. 37:15120–15128. [DOI] [PubMed] [Google Scholar]
- Sykes, A. G. 1991. Plastocyanin and the blue copper proteins. Struct. Bond. 75:175–224. [Google Scholar]
- Takabe, T., K. Takenaka, H. Kawamura, and Y. Beppu. 1986. Charges on proteins and distances of electron transfer in metalloprotein redox reactions. J. Biochem. (Tokyo). 99:833–840. [DOI] [PubMed] [Google Scholar]
- Takenaka, K., and T. Takabe. 1984. Importance of local positive charges on cytochrome f for electron transfer to plastocyanin and potassium ferricyanide. J. Biochem. (Tokyo). 96:1813–1821. [DOI] [PubMed] [Google Scholar]
- Ubbink, M., M. Ejdebäck, B. G. Karlsson, and D. S. Bendall. 1998. The structure of the complex of plastocyanin and cytochrome f, determined by paramagnetic NMR and restrained rigid-body molecular dynamics. Structure. 6:323–335. [DOI] [PubMed] [Google Scholar]
- Ullmann, G. M., M. Hauswald, A. Jensen, N. M. Kostic, and E. W. Knapp. 1997a. Comparison of the physiologically equivalent proteins cytochrome c6 and plastocyanin on the basis of their electrostatic potentials. Tryptophan 63 in cytochrome c6 may be isofunctional with tyrosine 83 in plastocyanin. Biochemistry. 36:16187–16196. [DOI] [PubMed] [Google Scholar]
- Ullmann, G. M., E.-W. Knapp, and N. M. Kostic. 1997b. Computational simulation and analysis of dynamic association between plastocyanin and cytochrome f. Consequences for the electron-transfer reaction. J. Am. Chem. Soc. 119:42–52. [Google Scholar]
- Xue, Y., M. Okvist, O. Hansson, and S. Young. 1998. Crystal structure of spinach plastocyanin at 1.7 Å resolution. Protein Sci. 7:2099–2105. [DOI] [PMC free article] [PubMed] [Google Scholar]
- Warwicker, J., and H. C. Watson. 1982. Calculation of the electric potential in the active site cleft due to alpha-helix dipoles. J. Mol. Biol. 157:671–679. [DOI] [PubMed] [Google Scholar]
- Zhou, J., J. G. Fernandez-Velasco, and R. Malkin. 1996. N-terminal mutants of chloroplast cytochrome f: effect on redox reactions and growth in Chlamydomonas reinhardtii. J. Biol. Chem. 271:6225–6232. [DOI] [PubMed] [Google Scholar]