

Abstract
Steered molecular dynamics simulations of the mechanosensitive channel of large conductance, MscL, were used to investigate how forces arising from membrane tension induce gating of the channel. A homology model of the closed form of MscL from Escherichia coli was subjected to external forces of 35–70 pN applied to residues near the membrane-water interface. The magnitude and location of these forces corresponded to those determined from the lateral pressure profile computed from a lipid bilayer simulation. A fully expanded state was obtained on the 10-ns timescale that revealed the mechanism for transducing membrane forces into channel opening. The expanded state agrees well with proposed models of MscL gating, in that it entails an irislike expansion of the pore accompanied by tilting of the transmembrane helices. The channel was most easily opened when force was applied predominantly on the cytoplasmic side of MscL. Comparison of simulations in which gating progressed to varying degrees identified residues that pose steric hindrance to channel opening.
INTRODUCTION
Mechanosensitive channels (MS) constitute a ubiquitous class of membrane proteins, essential to the survival of bacteria (Blount et al., 1997) and playing a role in biological functions such as hearing, touch, and cardiovascular regulation in animals (Corey and Hudspeth, 1983). MS channels are transducers of mechanical strain that arise in their membrane environment, thereby mediating the stimulation of exocytosis (Xu et al., 1996; Weber et al., 2000) and, in bacteria, maintaining the viability of the cell in the face of changes in osmotic pressure. Other important membrane proteins, including voltage-gated potassium channels (Gu et al., 2001; Tabarean and Morris, 2002), appear to be affected by membrane strain as well.
The first MS channel for which a crystal structure was obtained is MscL, the large conductance mechanosensitive channel first characterized in Escherichia coli. The crystal structure (Chang et al., 1998) captures the state of MscL from the species Mycobacterium tuberculosis (Tb-MscL) in its closed form. Though early studies (Blount et al., 1996) suggested that MscL assembled as a monohexamer, the crystal structure revealed a protein consisting of five identical subunits, each with two transmembrane helices, which form a water-tight constriction inside the membrane, as shown schematically in Fig. 1. The crystallized protein in the closed state measures 50 Å across, yet the conductance of the open channel has been recorded at 3.6 (Sukharev et al., 1999) to 3.8 (Cruickshank et al., 1997) nS, corresponding to an estimated pore diameter of 36–42 Å. These results make it clear that a major conformational change accompanies the transition to the open state.
FIGURE 1.
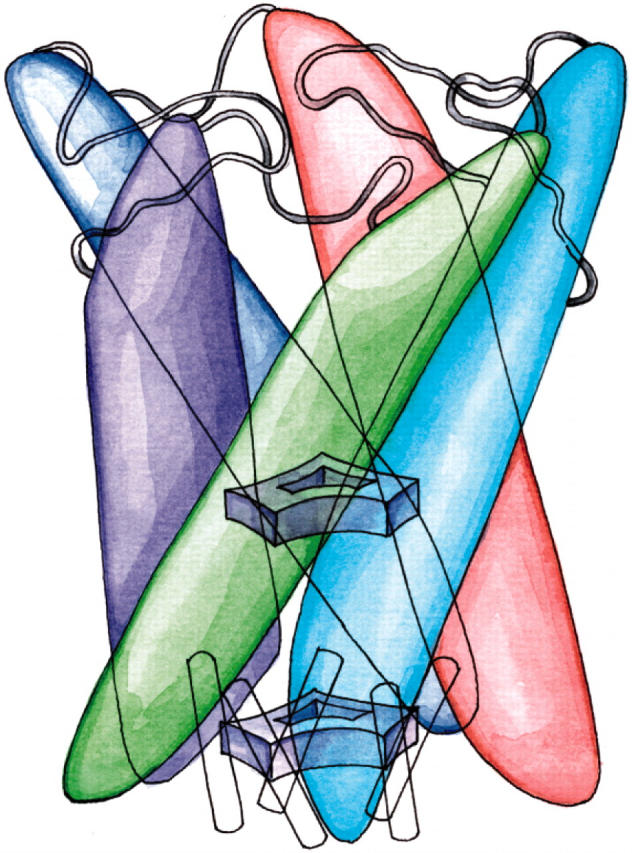
Homopentameric architecture of MscL. Five inner and five outer transmembrane helices assemble in pairs, each pair being comprised of helices from neighboring subunits. The inner (M1) helices form a water-tight constriction within the membrane, represented as the upper gate. Each M1 helix forms extensive contacts with an outer helix (M2) from a neighboring subunit; these helix pairs are sketched as solid-colored structures. In the model of reference (Sukharev et al., 2001a), the N-terminal domains (S1) form a helix bundle which comprises a second gate, shown schematically at the bottom of the drawing.
The mechanism for this gating process has been the subject of intense scrutiny for several years, accelerating with the publication of the crystal structure. Mutagenesis of Gly22, a well-conserved residue in the hydrophobic constriction of the channel, to all other natural amino acids by Yoshimura et al. (1999) showed that the tension threshold of the channel varies directly with the hydrophobicity of this residue, suggesting that Gly22 moves from a hydrophobic to a solvent-exposed environment during gating. Steric packing apparently plays a role in gating as well, as argued by Ou et al. (1998), who showed that the mutation V23G results in a severe gain-of-function phenotype, even though glycine is hydrophobic and smaller than valine.
Patch-clamp experiments by Sukharev and co-workers revealed the existence of at least five subconductance states (Sukharev et al., 1999); the only tension-sensitive transition was found to be between the closed state and the first subconductance state, with a total free energy barrier of 38 kBT. This tension sensitivity implies that MscL attains nearly its fully expanded radius before reaching the first subconductance state, i.e., before the channel has opened completely. How MscL can be essentially nonconducting in this expanded state must be explained by any proposed gating mechanism.
MscL conformational changes can also be induced by modifying the lipid environment. It has been known for some time (Martinac et al., 1990) that MscL can be gated through the introduction of micelle-forming lipids into the bilayer, rather than through tension. Recently, these observations were complemented by structural information obtained through electron paramagnetic spin resonance measurements (Perozo et al., 2002a). Using lipids with short acyl chains to modify the hydrophobic matching of the bilayer to the channel, an intermediate state with a lowered tension threshold but otherwise normal gating behavior was observed; this state differed from the closed state primarily in the rotation of the transmembrane helices about their primary axes. It is still unclear how this intermediate state is related to the expanded subconductance state observed in patch-clamp experiments (Sukharev et al., 1999). Introduction of lysophospholipids into one monolayer of a reconstituted membrane containing MscL resulted in a stabilized open channel under tension-free conditions (Perozo et al., 2002a,b).
We reported the first MD simulation of MscL in Gullingsrud et al. (2001), which described both equilibrium and nonequilibrium properties of the channel. Nonequilibrium properties of the channel were investigated using a surface tension algorithm, according to which the atomic coordinates of the protein are dynamically rescaled in response to a negative lateral pressure imposed on the system. The simulations suggested that gating of the channel is preceded by tilting of the transmembrane helices to lie flatter in the plane of the membrane; the suggestion was corroborated by observations in which MscL was shown to gate more easily in thin membranes (Kloda and Martinac, 2001). Our surface tension simulations were, however, subject to several limitations that motivate more refined MD investigation. First, the method applied global forces to the protein that bear no relation to protein-lipid interactions; it is desirable to model gating by direct coupling through these interactions. Second, the method used did not permit long enough simulations, making it difficult to study the gating process in detail. Finally, the protein secondary structure was disrupted before the most narrow part of the channel could open; hence a fully open state was not obtained, only an intermediate form which could be reached from the closed state without encountering large energy barriers.
Sukharev et al. (2001a,b) have developed models for the gating of both Tb-MscL as well as MscL from E. coli (Eco-MscL). A major contribution of these models was the rationalization of the expanded intermediate state observed earlier (Sukharev et al., 1999), The authors argued that this state implies the existence of a second gate, as shown in Fig. 1; this gate was assigned to the first nine N-terminal residues, which are well conserved and in a position to occlude the channel even when the transmembrane helices have spread apart. Modeling of the gating transition of the transmembrane part of the protein was guided by considerations of sequence conservation, the location of hydrophobic residues, and the measured conductance of the open state which suggested a pore diameter of ∼36 Å. The conformation of the periplasmic loops was considered to be the most speculative part of the model; the loops constitute the least conserved part of the protein. While MD simulation would arguably not make the best tool for de novo prediction of the structure of the periplasmic loops or N-terminal helices, MD simulation could be of use in examining the plausibility of the gating transition of the helices. MD is sensitive to steric clashes that must be avoided during channel opening, and can test whether the proposed (Sukharev et al., 2001b) MscL intermediate states can plausibly be reached through tension exerted by the membrane.
The gating mechanism of MscL has also been investigated through so-called targeted molecular dynamics (TMD) (Schlitter et al., 1993) by Kong et al. (2002). In this study the opening was simulated by applying a time-dependent force on all atoms of the protein to steer it from the closed form toward the putative open form. Though the authors of the study claim that the order of events observed in the TMD simulation follow solely from the intrinsic energetics of the structure, it is difficult to see how this could be the case. The primary difficulty is that the steering force in TMD is proportional to the distance of atoms in the structure from their final positions, so that the resulting order of events favors the large conformational changes first, followed by local changes. For example, TMD would predict that setting up a row of dominoes and knocking over the first results in all the remaining dominoes falling simultaneously, rather than one by one. This loss of causality may not occur in the case of applying TMD to a one-dimensional reaction, such as simple ligand docking to a binding site, but in the present case the complex nature of the proposed gating mechanism undermines the reliability of the TMD-determined intermediate states; we will return to this point in Discussion. Establishing a causal chain between stages of MscL gating requires a more direct means of simulating the gating transition.
In the following we describe results of steered molecular dynamics (SMD) simulations of MscL. The SMD method has been applied before to biomechanical processes (Lu and Schulten, 1999; Marszalek et al., 1999), as well as to the determination of reaction pathways (Isralewitz et al., 1997; Wriggers and Schulten, 1999; Kosztin et al., 1999); see Isralewitz et al. (2001) for a recent review. We use as our starting structure the model of Eco-MscL from Sukharev et al. (2001a,b). Although this structure is a homology model based on a crystal structure from M. tuberculosis (Tb-MscL) (Chang et al., 1998), the primacy of Eco-MscL in experimental investigation, the observed lower gating threshold of Eco-MscL compared to Tb-MscL, and the detailed proposed models of Eco-MscL of Sukharev et al. (2001b) make an Eco-MscL study more relevant.
Simulations of membrane channels are now widespread; see Forrest and Sansom (2000) or Roux (2002) for recent reviews. Though most have focused on ion or water permeation, increasing attention has been paid to channel gating, especially in MscL (Elmore and Dougherty, 2001) and in the KcsA potassium channel (Biggin and Sansom, 2002). Our approach of using external forces to induce opening of a membrane channel is similar to that of Biggin and Sansom (2002), who used an expanding sphere inside the channel to induce gating in KcsA. Most channel simulations have employed explicit lipid bilayers, though Guidoni et al. (2000) used octane as a more efficient membrane-mimetic environment, and Kong et al. (2002) omitted a lipid bilayer in their TMD simulations.
To study the protein-lipid interactions leading to gating that were neglected in our earlier work (Gullingsrud et al., 2001), we initially placed Eco-MscL in a fully hydrated lipid bilayer, with sufficient lipid to form a bulk phase far from the protein. We then attempted to gate the channel by applying moderate (50 dyn/cm) amounts of surface tension to the entire system, as was done in our earlier applied surface tension simulations (Gullingsrud et al., 2001). These attempts failed because the membrane stretched and compressed, while maintaining nearly constant volume, well before MscL's conformation could be affected. This result was, in retrospect, not surprising, given that the area compressibility of lipid bilayers is much smaller than the volume compressibility (Boal, 2002; Lindahl and Edholm, 2000). Our present approach is, therefore, to instead model the pressures that would be present in a stretched bilayer, rather than simulate the stretching of the bilayer itself. It will be demonstrated below that a bilayer is actually not needed to keep water from the hydrophobic part of the channel, where lipids would normally preclude water from touching the protein. Simulations without bilayer will be compared to results from MscL simulated in a full lipid bilayer environment.
The SMD simulations described below seek to determine how external force acting on lipid-exposed residues in the transmembrane helices can open the MscL channel. After the relevant forces have been identified, we describe the open state obtained from simulation, as well as the opening pathway. Finally, we examine simulations that did not result in a fully open state to discover how gating is controlled by key residues in the channel.
METHODS
The closed form of Eco-MscL in the model of Sukharev et al. (2001b) is based on the crystal structure of Tb-MscL (Chang et al., 1998) with the first nine N-terminal residues of each subunit modeled as a helix bundle, referred to as S1 (see Figs. 1 and 2). Residues 97–107 in each subunit make extensive salt-bridge contacts with charged residues in the N-terminal region; residues beyond 110 were excised to reduce the size of the simulation. These residues have been shown to be nonessential for gating (Ajouz et al., 2000).
FIGURE 2.

Starting Eco-MscL structure used in simulations. (Pink) S1 helices and linker region (residues 1–14); (blue) M1 helices (residues 15–45); (orange) periplasmic loops (residues 46–75); (red) M2 helices (residues 76–100); and (green) C-terminus (residues 101–110). Shown in blow-up are regions of the periplasmic loops and the N- and C-termini subjected to additional modeling described in the text. Side-chain orientations as modeled by Sukharev et al. (2001b) are rendered transparently; the orientations after modeling and minimization are shown in solid colors.
The structure of the periplasmic loop region (residues 50–75) was subjected to improvement with the goal of preventing the loops from blocking the opening of the protein. In the model of Sukharev et al. (2001b), several inter-subunit salt bridges are present in the closed structure but not in the open structure. Since the dissociation time for these contacts in simulation could be rather long, and since the precise conformation of the loops was admittedly speculative (Sukharev et al., 2001b), alternative conformations were sought which would establish the same contacts as those present in the open state, while still retaining the closed backbone conformation.
Side-chain rearrangements performed before simulation are depicted in Fig. 2. In preliminary investigations it was observed that Lys55 remained strongly coordinated with Asp67 of a neighboring subunit. However, in the open structure of Eco-MscL in the models of Sukharev et al. (2001b), Lys55 coordinates instead with Asp53 of the same subunit. We found that Lys55 could be reoriented to form a salt bridge with Asp53 in the closed state. Gln65 also competes with Lys55 for hydrogen bonds with Asp53, but we were not able to find a favorable nearby conformation for this residue. Additional modeling was also performed for the salt bridges and strong hydrogen bonds among N-terminal and C-terminal residues. The contact between Glu9 and Arg13 modeled in Sukharev et al. (2001b) was found in preliminary studies to be rather unstable. Arg104 was therefore placed in favorable contact with Glu9; Arg13, formerly in contact with Glu9, was placed in contact with Aspl8.
Local minimization was performed following each of the above modeling steps. Once modeling was completed, all nonbackbone atoms were minimized, then equilibrated at 310 K for 1 ps with backbone atoms held fixed.
The resulting system was solvated using the SOLVATE program (Grubmüller, 1996) to place water molecules near the protein and using VMD (Humphrey et al., 1996) to add bulk water. Water molecules found in a rectangular region, 28 Å thick, corresponding to the hydrophobic region of a lipid bilayer were removed, leaving a water layer, 5 Å thick on the sides of the protein, and 10 Å tall above and below the protein. The complete system contained 18,933 atoms, including 3396 water molecules and 8745 protein atoms. A snapshot of the constructed system is shown in Fig. 2. The stated amount of water was sufficient to maintain hydration of the pore, periplasmic loops, and cytoplasmic regions for the duration of all simulations.
After solvation, the system was minimized using the conjugate gradient algorithm of NAMD (Kale et al., 1999) for 500 steps, then heated and equilibrated at 300K in 5 ps. The heated structure was the starting point for all subsequent SMD simulations.
SMD simulations were performed using NAMD 2.5b1 (Kale et al., 1999), with a nonbonded cutoff of 10 Å. Temperature was controlled through velocity reassignment once per picosecond at 300 K. External forces were applied through the Tcl scripting language interface of NAMD. In the discussion below, “radial” forces means the force was applied along a vector normal to the channel axis pointing from the axis to the initial position of the atom. The direction and magnitude of all applied forces were held constant during the simulations; the protein experienced no appreciable drift in the plane of the membrane, so the applied forces may be considered to be radial at all points in the simulations. Forces were applied to Cα atoms only.
An additional SMD simulation was performed using the particle mesh Ewald method (PME) (Darden et al., 1993) for full electrostatics. Since the PME method necessitates the use of periodic boundary conditions, care was taken to avoid artifacts caused by interaction of the periodic images. The size of the rectangular unit cell was 85 Å on all sides; this is well above the greatest extent of the protein in both the lateral direction (65 Å at the end of the simulation) and the normal direction (73 Å at the beginning of the simulation).
In addition to the SMD simulations conducted without the use of an explicit lipid bilayer as described above, a fully solvated protein-membrane complex was constructed and simulated with a similar constant force protocol. The bilayer used was composed of 365 1,2-dilauroyl-phosphatidylethanolamine (DLPE) lipids; the full system contained 22,308 water molecules and a total of 111,079 atoms. Full electrostatics using PME was used throughout the simulation, with a cutoff for van der Waals interactions of 10 Å. After minimization, heating, and equilibration for 1.4 ns at constant normal pressure of 1 atm with a surface tension of 20 dyn/cm, the RMS distance of the transmembrane backbone atoms from the starting homology model was 1.76 Å. SMD forces were applied to the equilibrated protein under the same pressure conditions.
Pressure profile calculations were made following the method of Lindahl and Edholm (2000), with some small modifications. A pure DLPE bilayer composed of 200 lipids in an ideal geometry was constructed, solvated, and equilibrated at 310 K for 500 ps under conditions of constant area (57 Å2/lipid) and constant normal pressure of 1 atm. The pressure profile was calculated from a 9-ns simulation at constant volume with full electrostatics. The entire system was translated every 500 ps to keep the membrane at a fixed spatial location. Contributions to the virial from the kinetic energy and covalent bond interactions were computed on the fly during the simulation; contributions from the Lennard-Jones and electrostatic terms were computed from coordinate frames saved every 500 ps. The nonbonded contributions to the virial were computed using a cutoff of 18 Å.
RESULTS
All SMD simulations are summarized in Table 1, with the exception of a simulation in an explicit membrane environment described below. In simulations C1–C7 MscL remained in a closed state, as seen by the radius of the pore in the gate at Val23. Simulations O1–O4 evolved to an expanded state, such that the transmembrane gate opened but the S1 helix bundle still blocked the pore. In the following, we refer to the various components of MscL as defined in Fig. 2.
TABLE 1.
Summary of SMD simulations of Eco-MscL
| Name | Applied force | Affected residues | Duration | Pore size |
|---|---|---|---|---|
| C1 | 35 pN | 76–100 | 1.5 ns | * |
| C2 | 14 pN | 76–100 | 2.8 ns | * |
| C3 | 0–70 pN | 76–100 | 3.1 ns | * |
| C4 | 35 pN | Lipid-exposed M1 and M2 residues | 2.6 ns | 2.5* |
| C5 | 14 pN | 16, 36, 40, 78, 79, 94, 98 | 5.5 ns | 1.7* |
| C6 | 35 pN | 16, 36, 40, 78, 79, 98 | 13.2 ns | 3.3 ņ |
| C7 | 14 pN radial, 0.14 pN normal | 16, 17, 40, 78, 79, 98 | 10 ns | 1.9 Å |
| O1 | 35 pN radial, 0.35 pN normal | 16, 17, 40, 78, 79, 98 | 10.6 ns | 4.7 Ň; 12.1 ņ |
| O2 | 70 pN radial, 14 pN normal | 16, 17, 40, 78, 79, 98 | 4.5 ns | 9.8 Å |
| O3 | 70 pN radial | 16, 17, 40, 78, 79, 98 | 5.1 ns | 7.8 Ň; 9.5 Š|
| O4§ | 70 pN radial, 0.7 pN normal | 16, 17, 40, 78, 79, 98 | 12 ns | 9.4 Å |
Radial forces are directed away from the center of the channel; normal forces are directed along the membrane normal, toward the center of the bilayer. Minimum pore size is calculated using HOLE (Smart et al., 1993), using protein residues 15–45 and 75–100 at the indicated simulation time.
No well-formed pore.
At 10 ns.
At 4.5 ns.
Using PME.
Force protocol
Force was applied to selected residues in a predominantly radial direction (away from the channel axis) to mimic the effect of membrane strain in the absence of an explicit membrane. Residues in M2 are almost entirely hydrophobic, so if the membrane were pulled away from the protein due to tension, these residues would be exposed to solvent. The protein could therefore reduce the free energy of the system by expanding to maintain contact with the lipid bilayer.
To gauge the extent to which the applied forces used in our simulations mimics the effect of an actual lipid bilayer, we calculated the lateral pressure in a DLPE bilayer as a function of depth in the membrane. Results are shown in Fig. 3. The pressure profile is very similar to that obtained by Lindahl and Edholm (2000), though the profile shown here contains more detailed features and converges to the proper value of zero in the bulk water region. We shall describe a more extensive set of pressure profile investigations in a forthcoming article; for now our purpose is only to point out the relevant features of the profile in light of studies that have already been published (Lindahl and Edholm, 2000).
FIGURE 3.

Pressure profile of a DLPE membrane. The graph (left) shows the difference between the lateral pressure and the normal pressure as a function of depth in the membrane. Data was collected from a 9-ns simulation and sorted into 60 bins of thickness 1 Å; the statistical error in the data shown is 15–30 bar. (Middle) Snapshot from the DLPE simulation with atoms colored according to the pressure at their position, blue corresponding to negative lateral pressure and red to positive lateral pressure. (Right) The identical simulation snapshot, rendered to highlight structural components of the membrane; red spheres correspond to the ester oxygens connecting the lipid tails to the headgroup. Note that the strongest lateral pressure difference arises near the lipid-water interface.
By far the most prominent feature of the pressure profile is the negative lateral pressure peak just below the lipid headgroups. This peak corresponds to high surface tension: the membrane would like to reduce its surface area at this depth. In the center of the membrane are three smaller, positive peaks corresponding to forces that tend to increase the membrane area at this depth. The results shown in Fig. 3 suggest that the membrane drives the interfacial part of MscL to expand, and the central transmembrane part to compress.
We thus conclude that the membrane may be mimicked by radial forces near the lipid-water interface, with compressive forces in the transmembrane part and just outside the lipid bilayer. Since we are interested in producing an open state of MscL, the weaker inner membrane forces are neglected. But exactly what forces should be chosen to reproduce the interfacial tension? To answer this question we consider the relation of the local pressure p(z) to the interaction virial (see Lindahl and Edholm, 2000):
 |
(1) |
Here pxx, pyy, and pzz are the diagonal components of the pressure tensor, given by
 |
(2) |
and similarly for pyy and pzz. We approximate the local pressure p(z) at one interface as 1000 bar (see Fig. 3), and take the volume ΔV as that of one slice in the pressure profile, since the external forces are supposed to mimic the force in this region. The sum in Eq. 2 is performed over all interactions, which in this case are the external forces applied to the protein atoms at the bilayer-water interface. If the force is to be applied radially to 15 residues (three in each subunit), at a radius r = 20 Å (the radius of MscL), then the external force corresponding to the given local pressure is
 |
(3) |
Comparison with Table 1 shows that the forces employed in simulations C6–C7 and O1–O4 correspond closely to the interfacial lateral pressures observed in the DLPE simulation. Residues in simulations C6–C7 and O1–O4 are the hydrophobic residues in MscL most closely aligned with the negative pressure profile peak in Fig. 3.
MscL open state
An expanded state of MscL was obtained in four independent simulations (O1–O4). In simulations C6, C7, and O1–O4, a radial force was applied only to hydrophobic (Val, Ilene, Phe, Leu) residues near the membrane interface. Simulation C6 applied a radial force to Leu36; in C7 and O1–O4, this residue is not subject to an applied force; Val17 is pulled instead. Fig. 4 depicts the location of the residues subject to pulling in these two sets of simulations. Simulations C6 and O1 were thus essentially identical in their force protocol (neglecting the very small normal component) except for the location of the applied force. However, simulation C7 used the same force protocol as O1, but with a smaller magnitude of applied force, and produced no opening at all in a 12-ns run. It therefore appears that forces applied on the cytoplasmic side of the protein expand the channel more efficiently, and that a 14-pN force is insufficient to produce an opening on the 10-ns timescale of our simulations.
FIGURE 4.

(a) Top view and (b) side view of forces applied to MscL during simulations C6, C7, and O1–O4. Red-colored residues are Val17 and Leu36.
The expanded state obtained after 10 ns in simulation O4 is shown in Fig. 5. The pore radius at the narrowest part of the transmembrane region of the channel in Fig. 5 d was 8.2 Å; the pore continued to expand and reached a 9.4 Å radius at 12 ns. Several important observations may be made from the structure of Fig. 5. Expansion of the transmembrane region took place in conjunction with a tilting of the M1 helices toward the membrane plane. M2 helices tilted to a much smaller extent, but did expand outward as the pore opened. At the same time, neither the periplasmic loops nor the S1 helix bundle opened appreciably. The secondary structure of the transmembrane helices was somewhat degraded on their periplasmic ends, but the secondary structure near the tightest constriction of the pore, where the M1 helices meet, was quite sound for the first 10 ns of simulation O4 before the applied forces disrupted the structure. It is also clear from Fig. 5, a and b, that water completely wetted the pore in the expanded state of the channel, but did not enter the region where a lipid bilayer would normally be found. This can be attributed to the affinity of the water for the hydrophilic parts of the structure, as well as to the periodicity of the simulation along the channel axis, which permitted the water to form a continuous bulk region in the cytoplasmic and periplasmic regions of the channel.
FIGURE 5.
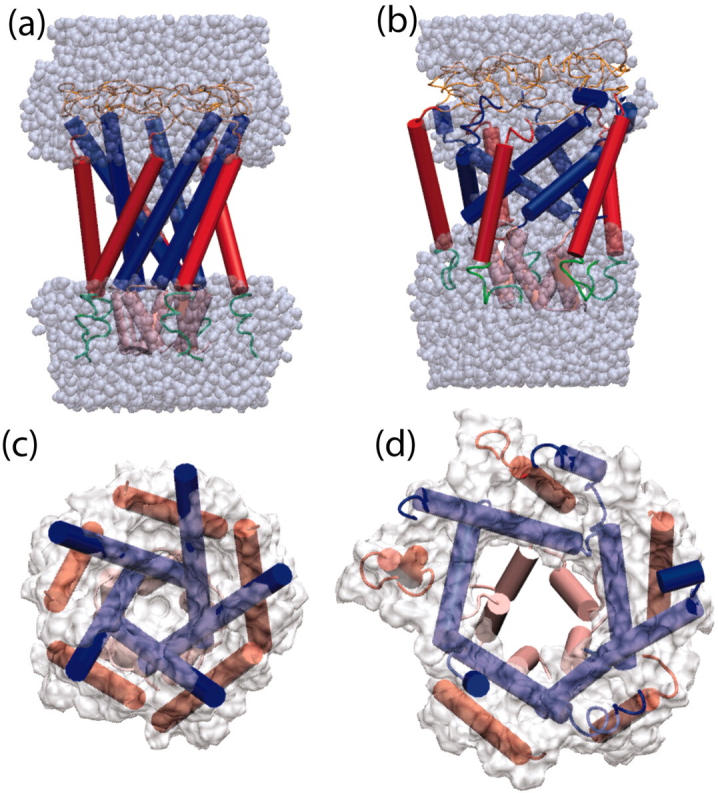
Snapshots from simulation O4 at 0 ns, a and c; and 10 ns, b and d. In a and b, water is shown in space-filling representation; in c and d, the MSMS-calculated surface (Sanner et al., 1995) of the channel formed by residues 15–41 and 77–100 is shown. MscL is represented in each snapshot as cartoon, with secondary structure calculated using STRIDE (Frishman and Argos, 1995) from the coordinates at 0 and 10 ns.
MscL gating pathway
To derive a measure of progress along the MscL gating pathway, we computed the average radius of the Cα atom of each residue in the five subunits, defined as the average distance of each Cα atom from the geometric center of the five equivalent amino acids (e.g., Ile79 of subunit 1, Ile of subunit 2, …). The average Cα radius will be sensitive to large-scale structural changes while ignoring the positions of side chains, which only affect pore size. To illustrate the progress of the channel toward the open state, we compute the difference between the average radius at various points in the simulation and the average radius computed at t = 0.
Fig. 6 a shows the change in average radius for simulations C6 and O1 at selected times, plotted as a function of residue number rather than spatial coordinate. In both simulations, the average radius either stays the same or decreases in the regions of the S1 helix bundle (residues 1–12), the periplasmic loops (50–67), and the C-terminal ends of the subunits (100–110). After 6 ns, simulation C6 has opened just as much as O1, as measured by average radius, for residues 35–110. However, for residues 12–35, corresponding to the linker region and the periplasmic side of the M1 helix, simulation C6 opens substantially less than simulation O1; after 6 ns in O1, residues 16–42 have all spread ∼5 Å from their initial state, whereas residues 16–23 have opened <4 Å from their initial states. In simulation C7, with an applied force of only 14pN, MscL opened much less than in any of the other simulations.
FIGURE 6.

Change in average radius of Cα atoms during SMD simulations. (a) Change in radius relative to t = 0 during simulations C6 and O1. C6 at 6 ns (dotted line); C7 at 10 ns (dashed line); O1 at 6 ns (thick solid line); and O1 at 10 ns (thin solid line). (b) Change in average radius of Cα atom by residue during simulations O1–O4. O1 at 10.6 ns (thick solid line); O2 at 4.45 ns (crosses); O3 at 5 ns (circles); and O4 at 10 ns (thin solid line). (c) Schematic MscL gating mechanism explaining results of simulations O1–O4. only Sl, M1, and loop sections are shown. The labeled radii at the cytoplasmic and periplasmic ends correspond to average Cα radii in the respective protein regions from simulation O1.
Simulations O1–O4 were conducted with forces on the same residues, but of different magnitudes and with slightly different directions. Fig. 6 b shows the average radius relative to the initial state for simulations O1–O4. It can be seen that the radius profile for all four simulations is practically identical, indicating that the observed opening is not sensitive to small changes in the direction of the forces. O4 differs somewhat from O1–O3 in that the pore expanded more slowly, despite the strong applied force. This is attributable to differences in water penetration due to the use of periodic boundary conditions in simulation O4 as described above; water was better confined to the aqueous parts of the channel in simulation O4 compared to O1–O3, though in no simulation was wetting observed of the external surface of the protein.
S1 and linker region
In the model of Sukharev et al. (2001b), the three “linker” residues Arg13, Gly14, and Asn15 transmit tension from the M1 helices to the second gate formed by S1 (see Fig. 1). The region must be sufficiently flexible that the Sl gate is not opened until the transmembrane part of MscL has expanded. The S1 helix bundle did not dissociate or open in any of the SMD simulations presented here. However, results from simulations O1–O4 suggest a mechanism by which the expansion of the M1 helices could lead to the opening of the S1 gate. Fig. 7 shows scatterplots of the conformation of the three linker residues in Ramachandran space during simulation O1. It can be seen that residues Arg13 and Asn15 remained in the allowed part of the Ramachandran diagram throughout the simulation. Gly14 sampled a region of Ramachandran space that would be disallowed for any other residue. Fig. 7 shows snapshots of the S1 helix bundle and the linker residues in cartoon representation at several points in the simulation. It can be seen that the S1 helices did not separate or lose any secondary structure, even though the linker residues separated quite far during simulation O1. An interesting change in tertiary structure did occur for one pair of helices: while all helices in the S1 bundle began in a favorable, left-handed packing at the start of the simulation, by the end two of the helices have reformed into a right-handed packing. This transition could mark the beginning of disruption and opening of the bundle, as was indeed suggested earlier (Sukharev et al., 2001a).
FIGURE 7.

(Top row, left to right) Ramachandran trajectory for residues Arg13, Gly14, and Asn15 for one representative subunit during simulation O1. (Bottom row) Structure of Sl helices during simulation O1 in cartoon representation. (From left to right) 0 ns, 3 ns, 7 ns, and 10 ns. The transition from left-handed to right-handed crossing is evident in the red-blue helix pair.
As described in Methods, several charged residues (Arg104 and Argl3) in the N-terminal region were repositioned in the starting structure to form more stable contacts with other well-conserved charged residues. The modeled Glu9-to-Argl04 contact was found to be quite stable in all simulations; in both C6 and O1, four out of five subunits had a stable Glu9-Arg104 contact for the duration of the simulations. In contrast, the modeled contacts between Arg13 and Asp18 were completely stable for all subunits in C6, but broke apart in three of the subunits in O1. The breaking of this contact in O1 coincided with the expansion of the N-terminal end of the M1 helices and the concomitant stretching of the linker residues. If this modeling is correct, the Argl3–Aspl8 contacts help to maintain the integrity of the S1 bundle until the transmembrane gate is fully expanded.
Transmembrane helix rotation
An obvious feature of the average radius changes depicted in Fig. 6 is the sawtooth pattern of the average Cα radius in the M1 and M2 regions of the protein sequence. This pattern is due to a rotation of the transmembrane helices, illustrated in Fig. 8, that occurs very early in all simulations. The rotation, however, does not appear to be systematic, especially for the M1 helices, which exhibit apparently random internal rotation. The M2 helices exhibit primarily clockwise rotation, though the amount is rather small. No systematic rotation was seen in simulations C6 and O1, either, although the average size of the rotations (30–40°) was sufficient to account for the sawtooth pattern in Fig. 6.
FIGURE 8.

Internal rotation of (top) M1 and (bottom) M2 helices in simulation O4. Data from each of the five subunits are shown. Data shown are a 100-ps running average of the angles calculated every 10 ps.
C1–C5: simulations exhibit excessive distortion
Simulations C1–C3 proceeded with force applied to Cα atoms of all M2 helix residues. None produced an open state of MscL, and in some cases the protein secondary structure was seriously distorted. In C1, by 400 ps the M1 helices had tilted considerably from the initial angle to become almost parallel to the membrane plane. This was accompanied by bending of three of the helices around Gly26 or Gly30. M2 helices were bent around the middle of the helix at residues 87–90, but did not show as much distortion as was seen in the inner M1 helices. This was somewhat surprising since force was applied to Cα atoms in M2, not in M1. Simulation C2, with only 40% of the applied force as C1, saw very little change in the structure of MscL, even though the simulation length was twice that of C1. In simulation C3, the applied force was scaled linearly from 70 pN to 0 over residues 76–88, and back up from 0 to 70 pN for residues 89–100. This choice was successful in mitigating much of the distortion and bending of the M2 helices seen in C1; no significant bending was seen in the M2 helices of any of the subunits during the first 1.5 ns. However, no channel expansion was observed during this time, either.
Simulation C4 used a 35-pN force on the Cα atoms of residues 16, 25, 29, 32, 33, 36, 40, 78, 79, 82, 83, 86, 87, 90, 93, 94, and 98. These represent the hydrophobic residues in both M1 and M2 helices that are exposed to the lipid environment. This approach was also too disruptive to the structure of the protein, causing unraveling of the helices around residues 19–21, i.e., the closest points of contact between M1 helices. Simulation C5 produced very little change in the structure of the protein during the 5.5 ns run.
M1-to-M1 interactions and barriers to opening
To determine why MscL opened in simulation O1, but not in C6, we analyzed the interactions of neighboring M1 helices. Coarse-grained measurements alone, such as the pore size or average radius, cannot reveal what might block the channel from opening for a period of time. These measures average, and therefore neglect, the heterogeneity that exists in the five subunits. The external force applied to MscL lowers the energy barrier to the open state, but the crossing of the energy barriers must occur for each subunit individually.
Residues Gly22, Gly26, and Ala20 interact with residues in neighboring M1 helices in the closed state. In the model of Sukharev et al. (2001b), Gly22 is proposed to lose its contact with the neighboring M1 helix and face the pore during the intermediate state, then pack against an S1 helix in the open state. If this is the case then we would expect that Gly22 would need to lose its contacts with neighboring M1 residues for MscL to progress toward the open state. Gly26 also interacts with neighboring M1 helix residues in the aforementioned models, and is supposed to line the pore in the intermediate and open states. Finally, the perfectly conserved Ala20 interacts strongly with Ile25 and Gly26 in the closed state, but is proposed to slide up to the also perfectly conserved Phe29 in an intermediate state, and to residues in the range of 33–40 in the open state.
Fig. 9 a shows the interaction of residues Gly22 and Gly26 with residues in the neighboring M1 helix. Two residues were considered to interact if at least one atom from one residue was within 2.5 Å of an atom from the other residue. In simulation O1, at ∼4 ns, interactions between Gly22 and its neighboring M1 helix were abolished in all five subunits. In all subunits, Gly26 had long-lasting contacts with Ala20 (lasting at least 2 ns); however, after 2–6 ns the contact was abolished in all five subunits. New contacts were formed between Gly26 and the neighboring helix, primarily with Aspl8. In four out of five subunits, even these additional contacts were eventually diminished and even abolished by the end of the 10-ns run. As seen in Fig. 9 b, the change in residues contacts is due to neighboring M1 helices sliding past each other, with continuous contacts between the helices being assured by Gly22 and Gly26 fitting into the pocket formed by Val16, Leul9, and Ala20.
FIGURE 9.

Interaction of Gly22 (asterisks) and Gly26 (circles) with residues in neighboring subunits in simulation O1. The graphs show which residues had atoms within 2.5 A of Gly22 or Gly26 during the simulation; the sampling period was 50 ps. (Below) Relative orientation of M1 helices in simulation O1 at (a) 0 ns, (b) 2 ns, and (c) 8 ns. Gly22 is shaded dark, Gly26 is shaded medium, and residues Val16, Leu19, and Ala20 are shaded light.
Fig. 10 shows the interaction of Ala20 with residues in its neighboring M1 helix. In simulation C6, contacts were made with residues 22–29, with no contacts at all beyond Phe29. Simulation O1 also exhibited long-lasting contacts at or before Phe29. However, in all cases Ala20 eventually slipped past Phe29 to make contacts with Val33. The slipping event is depicted for one subunit from each simulation below the graphs. In C6, Ala20 reaches the pocket formed by Ile25 and Phe29 within 2 ns of the start of the simulation, and never leaves that pocket. In O1, Ala20 reaches the same pocket, but eventually slips out to make contact with residues further down the helix. These results suggest that the well-conserved Phe29 may be an important element in setting the tension threshold for initial expansion of the channel.
FIGURE 10.

Interaction of Ala20 with residues in neighboring subunits during (a) simulation C6 and (b) simulation O1. Each row corresponds to one subunit. The vertical axis of each graph corresponds to the residue IDs of residues interacting with the Ala residue of the neighboring subunit. The relative orientation of neighboring subunits in this figure is the opposite of that in Fig. 9. Below, snapshots from one representative subunit pair showing the relative orientation of Ala20 (light) with Ile25 (medium), and Phe29 (dark).
Explicit membrane simulation
Finally, an SMD simulation of MscL in an explicit lipid environment was performed to check that the simulations described above were not unduly affected by the absence of a bilayer. The SMD protocol used in this simulation is described in Table 2. Since the system was periodic (unlike simulation O4, in which the periodic boundary conditions leave plenty of vacuum between periodic images into which the channel can expand during gating), it was necessary to allow the area of the protein-membrane system to expand; this flexibility was provided by the surface tension boundary condition.
TABLE 2.
Force protocol used in explicit membrane simulation
| Simulation period (ns) | Applied force (pN) | Surface tension (dyn/cm) | Min. pore radius (Å) |
|---|---|---|---|
| 0–6.61 | 70 | 20 | 0.94 |
| 6.61–10.99 | 140 on residues 16, 17, 98 | 20 | 2.71 |
| 10.99–11.84 | 140 on residues 16, 17, 98 | 30 | 4.04 |
| 11.84–14.21 | 140 on residues 16, 17, 98 | 50 | 4.66 |
The direction of the applied force was as in simulation O1; the magnitude was 70 pN on the periplasmic residues (36, 40, 78), and 70–140 pN as shown in the table. Applied pressure normal to the bilayer was 1 atm at all times. Minimum pore radius is measured using HOLE (Smart et al., 1993) from MscL residues 14–41 and 75–100 using the coordinates at the end of the indicated simulation time period.
The initial force applied to the channel residues was 70 pN; this is the same force that was employed in simulation O4. In simulation O4 there was significant expansion of the transmembrane pore constriction within 5 ns; in contrast, in the full membrane simulation the pore did not open at all within the first 6.6 ns, likely due to the bilayer pressing against the outside of the channel. The applied force on the cytoplasmic residues was therefore increased in steps to accelerate the gating process; the surface tension was also increased to decrease the extent to which membrane pressure held the protein shut. Within six more nanoseconds the first stages of gating were observed, as shown in Fig. 11. The minimum pore radius formed by the M1 helices in Fig. 11 b is 4.7 Å, half that of the open simulations O1–O3 but still substantially more than C1–C7. Comparison of Figs. 5 b and 11 a shows that the water distributions around the cytoplasmic and periplasmic sides of the channel in the two simulations are virtually identical, suggesting that there is no unrealistic hydration of the hydrophobic exterior of MscL present in simulation O4. An important observation to be made from Fig. 11 b is that the secondary structure of the channel is wholly intact, despite the application of applied forces that are 2–4× stronger than those used in simulations O1–O4, for simulation times that are comparable to, or longer than, the simulations without membrane present. This suggests that the SMD protocol is not disrupting the channel structure during the early stages of gating.
FIGURE 11.
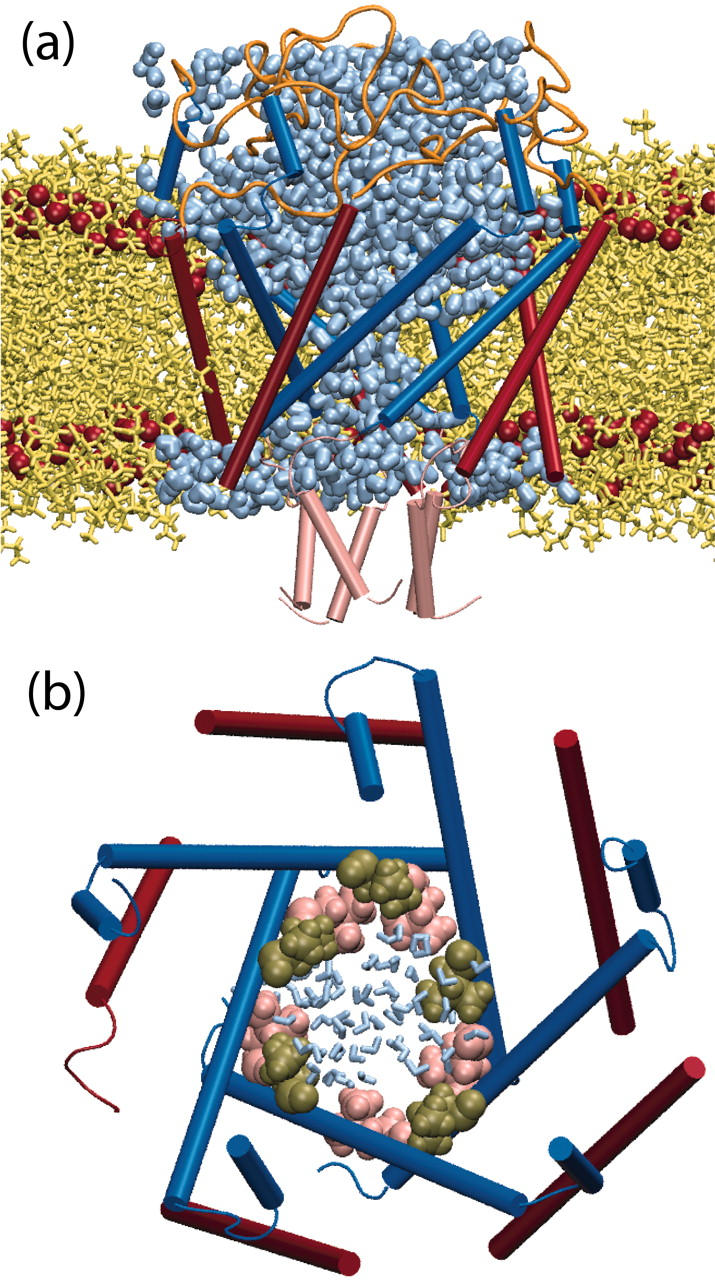
MscL-DLPE structure at the conclusion of the 14.2-ns explicit membrane simulation. (a) MscL cross-section, showing water penetration in the pore. Lipid atoms are colored yellow; ester oxygen atoms marking the edge of the hydrophobic core of the bilayer are shown as red spheres. M1 (blue) and M2 (red) helices are shown in cartoon representation. (b) MscL pore, with residues Leu19 (pink) and Val23 (tan) forming the transmembrane pore constriction. Water molecules found in the pore are shown in blue to indicate the relative size of the pore.
Periplasmic loops
The periplasmic loop region in all simulations was surprisingly stable. In simulation C1, this stability may be attributable to the formation of a very stable pair of backbone hydrogen bonds between Gln56, Phe57, and Met73. In all five subunits, Met73 retained at least one, and in most cases two, hydrogen bonds with Gln56 and Phe57 in the same subunit throughout the entire simulation, effectively locking it in place since no radial force was applied to any residues in M1. In simulation C2, only two of the subunits exhibited stable hydrogen bonding between Met73 and surrounding residues within the same subunit. In simulation C4, the periplasmic loop region was again very stable during the first 1.5 ns, though not quite as stable as in O1. An extended β-conformation involving residues Gln56, Phe57, Val59, Val7l, and Met73, but especially Val59 and Val71, was evident in all subunits.
In all simulations, Lys55 and Asp67 remained either coordinated with residues within their respective subunits, or else solvated; there were no salt bridges observed maintaining the integrity of the periplasmic region.
DISCUSSION
The SMD simulations described above have revealed in detail how lateral tension corresponding to what would be experienced in a bilayer environment can produce an expanded state of MscL. The results presented have greatly extended our initial investigations into MscL gating (Gullingsrud et al., 2001) by employing a steering force derived from a study of lateral pressure in homogeneous membranes. The long time (10 ns) of the simulations allowed statistically rare events to occur that likely would not have arisen in the previous subnanosecond simulations. To confirm that the pathway produced by SMD steering forces is realistic, we have made detailed comparisons of the simulated structures with observations. The simulations compared well to experimental results, while shedding new light on the mechanism of channel opening in MscL, in particular by revealing the key barriers to opening of the channel as well as on the detailed sequence of events during the initial expansion stage of opening.
The mechanism of MscL gating from the closed state to the expanded state may be summarized as follows. Initial expansion of the channels begins in the periplasmic ends of the M1 and M2 helices (residues 30–45 and 75–85, respectively), as seen in the change in average radius of the pore-lining residues (Fig. 6). No serious energy barriers are encountered in this phase of the expansion, as evidenced by the fact that even SMD simulations with small forces (e.g., C7) managed to induce this level of expansion. From Fig. 6 we see that the M2 helices may expand as much as 6 Å from the closed state without necessarily opening the hydrophobic constriction at Leu19 and Val23 (Fig. 11 b). No further expansion appears to be possible without opening of this first gate. The mechanical tension necessary to open this gate should come from the cytoplasmic side of the bilayer, as seen in the difference between simulations C6 and O1.
Progress toward expansion of the hydrophobic constriction appears to require Ala20 slipping past a pocket formed by Ile25 and Phe29 in a neighboring subunit (Fig. 10); all three of these residues are very well conserved among MscL homologs. Once this slippage has occurred, expansion of both M1 and M2 can continue; M1 and M2 helices from neighboring subunits expand together due to both close packing and a stable salt bridge between Lys31 and Asp84.
The opening of the first gate is quite decoupled from the expansion of the S1 bundle: the average radius of residues 16–28 increased by >10 Å in simulation O1, whereas residues 1–13 did not expand at all. The flexibility in the linker region of MscL comes entirely from Gly14; Arg13 and Asn15 remained in the allowed portion of Ramachandran space and did not become excessively distorted to allow the expansion of M1 (Fig. 7).
Our conclusions with regard to the tandem nature of the two MscL gating regions are in accord with those reached on the basis of TMD simulations (Kong et al., 2002). However, in those simulations the S1 helices need not have been destabilized by the open conformation of the M1 helices, as the proposed models (Sukharev et al., 2001b) describe; they could simply have been left behind as the large M1 and M2 helices are dragged toward their final positions. The same simulation saw the C-terminal S3 helix bundle dissociate and dock against the bottom of the transmembrane structure with no apparent impetus at all other than the pulling methodology.
Results from our simulations are in good agreement with experimentally determined models of MscL intermediate states. The inter-residue contacts for Gly22, Gly26, and Ala20 predicted by Sukharev et al. (2001b) are also seen in our simulations, as is the expansion of the transmembrane hydrophobic constriction independently from the S1 helix bundle and the stable contact between neighboring M1 and M2 helices.
We must acknowledge the somewhat controversial status of the modeled structure of the S1 helices. Although the “helix bundle model” used in our simulations is well supported by cysteine-cross linking studies (Sukharev et al., 2001a), site-directed spin labeling analysis (Perozo et al., 2001) as well as a reinterpretation of x-ray crystal data (Cortes et al., 2003) suggests that, in the closed state, the S1 helices may actually lie in the plane of the membrane adjacent to the TM2 helices. Uncertainty in this region of the channel does not invalidate the results we have presented for the transmembrane gating pathway, since in either interpretation the S1 helices are not thought to be the primary MscL tension sensors.
The stability of the periplasmic loop regions (residues 50–75) in our SMD simulations, even in the opened states of simulations O1–O3, was somewhat surprising. We expected at the outset that the loops would expand in response to the initial tilt of the helices. What was instead observed was that residues 45–50 at the end of the M1 helices tilted toward the center of the channel to accommodate the expansion of the pore. It is possible that the loops simply did not have time during the 10-ns runs to dissociate and follow the transmembrane helices to an expanded state. It has been reported (Ajouz et al., 2000) that excision of the periplasmic loops results in a much more mechanically sensitive channel, so the loops could indeed be acting as springs holding back gating. Alternatively, the structure of the loops in vivo could be different from that of the crystal structure. In the only available crystal structure of MscL (Chang et al., 1998), the loops unfortunately are packed against each other in the crystal; this non-native environment could have affected the observed conformation in this portion of the protein. As early as 1996, Blount and co-workers proposed a helical structure for residues 54–66 (as opposed to the random coil seen in the crystal structure; Blount et al., 1996), and uncertainty in this region of the E. coli homology model had been acknowledged (Sukharev et al., 2001b). Additional modeling of the loops is certainly warranted to understand the coupling of this region to the rest of the protein.
With the discovery of the crystal structure of MscS (Bass et al., 2002), there is now a second mechanosensitive channel amenable to molecular dynamics investigation. The details of MscS gating are likely to be quite different from those of MscL, due the lack of sequence homology; however, in both channels a GxxxG motif (Fleming and Engelman, 2001) governs the packing of the transmembrane helices forming the transmembrane pore (residues 22–26 in MscL, residues 104–108 in MscS), suggesting that helix-to-helix packing considerations such as those discussed in this article will be important in understanding the gating mechanism of the MscS channel.
Coordinates for Eco-MscL used as the starting point of our simulations are available at http://www.ks.uiuc.edu/Research/MscLchannel.
Acknowledgments
The authors thank B. Martinac, S. Sukharev, G. Meier, and E. Perozo for helpful discussions, and O. Svinarski for drawing Fig. 1. The molecular images in this article were created with the molecular graphics program VMD (Humphrey et al., 1996).
This work was supported by the National Institutes of Health (PHS5 P41RR05969-04) and the National Science Foundation (MCB-9982629). The authors also acknowledge computer time provided by National Resource Allocations Committee grant MCA93S028.
References
- Ajouz, B., C. Berrier, M. Besnard, B. Martinac, and A. Ghazi. 2000. Contributions of the different extramembranous domains of the mechanosensitive ion channel MscL to its response to membrane tension. J. BioI. Chem. 275:1015–1022. [DOI] [PubMed] [Google Scholar]
- Bass, R. B., P. Strop, M. Barclay, and D. C. Rees. 2002. Crystal structure of Escherichia coli MscS, a voltage-modulated and mechanosensitive channel. Science. 298:1582–1587. [DOI] [PubMed] [Google Scholar]
- Biggin, P. C., and M. S. P. Sansom. 2002. Open-state models of a potassium channel. Biophys. J. 83:1867–1876. [DOI] [PMC free article] [PubMed] [Google Scholar]
- Blount, P., M. J. Schroeder, and C. Kung. 1997. Mutations in a bacterial mechanosensitive channel change the cellular response to osmotic stress. J. BioI. Chem. 272:32150–32157. [DOI] [PubMed] [Google Scholar]
- Blount, P., S. I. Sukharev, P. C. Moe, M. J. Schroeder, H. R. Guy, and C. Kung. 1996. Membrane topology and multimeric structure of a mechanosensitive channel protein of Escherichia coli. EMBO J. 15:4798–4805. [PMC free article] [PubMed] [Google Scholar]
- Boal, D. 2002. Mechanics of the Cell. Cambridge University Press, Cambridge, UK.
- Chang, G., R. H. Spencer, A. T. Lee, M. T. Barclay, and D. C. Rees. 1998. Structure of the MscL homolog from Mycobacterium tuberculosis: a gated mechanosensitive ion channel. Science. 282:2220–2226. [DOI] [PubMed] [Google Scholar]
- Corey, D. P., and A. J. Hudspeth. 1983. Kinetics of the receptor current in bullfrog saccular hair cells. J. Neurosci. 3:962–976. [DOI] [PMC free article] [PubMed] [Google Scholar]
- Cortes, D. M., B. Martinac, and E. Perozo. 2003. Structure and conformational rearrangements of MscL N-terminal domain. Biophys. J. 84:21a. [Google Scholar]
- Cruickshank, C. C., R. F. Minchin, A. C. L. Dain, and B. Martinac. 1997. Estimation of the pore size of the large-conductance mechanosensitive ion channel of Escherichia coli. Biophys. J. 73:1925–1931. [DOI] [PMC free article] [PubMed] [Google Scholar]
- Darden, T., D. York, and L. Pedersen. 1993. Particle mesh Ewald. An N·log(N) method for Ewald sums in large systems. J. Chem. Phys. 98:10089–10092. [Google Scholar]
- Elmore, D. E., and D. A. Dougherty. 2001. Molecular dynamics simulations of wild-type and mutant forms of the Mycobacterium tuberculosis MscL channel. Biophys. J. 81:1345–1359. [DOI] [PMC free article] [PubMed] [Google Scholar]
- Fleming, K. G., and D. M. Engelman. 2001. Specificity in transmembrane helix-helix interactions can define a hierarchy of stability for sequence variants. Proc. Natl. Acad. Sci. USA. 98:14340–14344. [DOI] [PMC free article] [PubMed] [Google Scholar]
- Forrest, L. R., and M. S. P. Sansom. 2000. Membrane simulations: bigger and better? Curr. Opin. Struct. Biol. 10:174–181. [DOI] [PubMed] [Google Scholar]
- Frishman, D., and P. Argos. 1995. Knowledge-based secondary structure assignment. Prot. Struct. Func. Gen. 23:566–579. [DOI] [PubMed] [Google Scholar]
- Grubmüller, H. 1996. SOLVATE 1.0. http://www.mpibpc.gwdg.de/abteilungen/071/solvate/docu.html.
- Gu, C. X., P. F. Juranka, and C. E. Morris. 2001. Stretch-activation and stretch-inactivation of Shaker-IR, a voltage-gated K+ channel. Biophys. J. 80:2678–2693. [DOI] [PMC free article] [PubMed] [Google Scholar]
- Guidoni, L., V. Torre, and P. Carloni. 2000. Water and potassium dynamics inside the KcsA K+ channel. FEBS Lett. 477:37–42. [DOI] [PubMed] [Google Scholar]
- Gullingsrud, J., D. Kosztin, and K. Schulten. 2001. Structural determinants of MscL gating studied by molecular dynamics simulations. Biophys. J. 80:2074–2081. [DOI] [PMC free article] [PubMed] [Google Scholar]
- Humphrey, W., A. Dalke, and K. Schulten. 1996. VMD—visual molecular dynamics. J. Mol. Graph. 14:33–38. [DOI] [PubMed] [Google Scholar]
- Isralewitz, B., S. Izrailev, and K. Schulten. 1997. Binding pathway of retinal to bacteriorhodopsin: a prediction by molecular dynamics simulations. Biophys. J. 73:2972–2979. [DOI] [PMC free article] [PubMed] [Google Scholar]
- Isralewitz, B., J. Baudry, J. Gullingsrud, D. Kosztin, and K. Schulten. 2001. Steered molecular dynamics investigations of protein function. J. Mol. Graph. Model. 19:13–25. [DOI] [PubMed] [Google Scholar]
- Kale, L., R. Skeel, M. Bhandarkar, R. Brunner, A. Gursoy, N. Krawetz, J. Phillips, A. Shinozaki, K. Varadarajan, and K. Schulten. 1999. NAMD2: greater scalability for parallel molecular dynamics. J. Comp. Phys. 151:283–312. [Google Scholar]
- Kloda, A., and B. Martinac. 2001. Mechanosensitive channel of Thermoplasma, the cell wall-less Archaea: cloning and molecular characterization. Cell Biochem. Biophys. 34:321–347. [DOI] [PubMed] [Google Scholar]
- Kong, Y., Y. Shen, T. E. Warth, and J. Ma. 2002. Conformational pathways in the gating of Escherichia coli mechanosensitive channel. Proc. Natl. Acad. Sci. USA. 99:5999–6004. [DOI] [PMC free article] [PubMed] [Google Scholar]
- Kosztin, D., S. Izrailev, and K. Schulten. 1999. Unbinding of retinoic acid from its receptor studied by steered molecular dynamics. Biophys. J. 76:188–197. [DOI] [PMC free article] [PubMed] [Google Scholar]
- Lindahl, E., and O. Edholm. 2000. Spatial and energetic-entropic decomposition of surface tension in lipid bilayers from molecular dynamics simulations. J. Chem. Phys. 113:3882–3893. [Google Scholar]
- Lu, H., and K. Schulten. 1999. Steered molecular dynamics simulation of conformational changes of immunoglobulin domain I27 interpret atomic force microscopy observations. Chem. Phys. 247:141–153. [Google Scholar]
- Marszalek, P. E., H. Lu, H. Li, M. Carrion-Vazquez, A. F. Oberhauser, K. Schulten, and J. M. Fernandez. 1999. Mechanical unfolding intermediates in titin modules. Nature. 402:100–103. [DOI] [PubMed] [Google Scholar]
- Martinac, B., J. Adler, and C. Kung. 1990. Mechanosensitive ion channels of E. coli activated by amphipaths. Nature. 348:261–263. [DOI] [PubMed] [Google Scholar]
- Ou, X., P. Blount, R. J. Hoffman, and C. Kung. 1998. One face of a transmembrane helix is crucial in mechanosensitive channel gating. Proc. Natl. Acad. Sci. USA. 95:11471–11475. [DOI] [PMC free article] [PubMed] [Google Scholar]
- Perozo, E., A. Kloda, D. M. Cortes, and B. Martinac. 2001. Site-directed spin-labeling analysis of reconstituted MscL in the closed state. J. Gen. Physiol. 118:193–205. [DOI] [PMC free article] [PubMed] [Google Scholar]
- Perozo, E., D. M. Cortes, P. Sompornpisut, A. Kloda, and B. Martinac. 2002a. Open channel structure of MscL and the gating mechanism of mechanosensitive channels. Nature. 418:942–948. [DOI] [PubMed] [Google Scholar]
- Perozo, E., A. Kooda, D. M. Cortes, and B. Martinac. 2002b. Physical principles underlying the transduction of bilayer deformation forces during mechanosensitive channel gating. Nat. Struct. Biol. 9:696–703. [DOI] [PubMed] [Google Scholar]
- Roux, B. 2002. Theoretical and computational models of ion channels. Curr. Op. Struct. Biol. 12:182–189. [DOI] [PubMed] [Google Scholar]
- Sanner, M. F., A. J. Olson, and J.-C. Spehner. 1995. Fast and robust computation of molecular surfaces. In Proceedings of 11th ACM Symposium on Computational Geometry. SCM Press, New York, NY.
- Schlitter, J., M. Engels, P. Krtiger, E. Jacoby, and A. Wollmer. 1993. Targeted molecular dynamics simulation of conformational change application to the T↔R transition in insulin. Mol. Sim. 10:291–308. [Google Scholar]
- Smart, O., J. Goodfellow, and B. Wallace. 1993. The pore dimensions of gramicidin-A. Biophys. J. 65:2455–2460. [DOI] [PMC free article] [PubMed] [Google Scholar]
- Sukharev, S., M. Betanzos, C.-S. Chiang, and H. R. Guy. 2001a. The gating mechanism of the large mechanosensitive channel MscL. Nature. 409:720–724. [DOI] [PubMed] [Google Scholar]
- Sukharev, S., S. R. Durell, and H. R. Guy. 2001b. Structural models of the MscL gating mechanism. Biophys. J. 81:917–936. [DOI] [PMC free article] [PubMed] [Google Scholar]
- Sukharev, S. I., W. J. Sigurdson, C. Kung, and F. Sachs. 1999. Energetics and spatial parameters for gating of the bacterial large conductance mechanosensitive channel, MscL. J. Gen. Physiol. 113:525–539. [DOI] [PMC free article] [PubMed] [Google Scholar]
- Tabarean, I. V., and C. E. Morris. 2002. Membrane stretch accelerates activation and slow inactivation in Shaker channels with S3–S4 linker deletions. Biophys. J. 82:2982–2994. [DOI] [PMC free article] [PubMed] [Google Scholar]
- Weber, W.-M., C. Popp, W. Clauss, and W. V. Driessche. 2000. Maltotoxin induces insertion of different ion channels into the Xenopus oocyte plasma membrane via Ca2+-stimulated exocytosis. Br. J. Physiol. 439:363–369. [DOI] [PubMed] [Google Scholar]
- Wriggers, W., and K. Schulten. 1999. Investigating a back door mechanism of actin phosphate release by steered molecular dynamics. Prot. Struct. Func. Gen. 35:262–273. [PubMed] [Google Scholar]
- Xu, J., M. Liu, J. Liu, I. Caniggia, and M. Post. 1996. Mechanical strain induces constitutive and regulated secretion of glycosaminoglycans and proteoglycans in fetal lung cells. J. Cell Sci. 109:1605–1613. [DOI] [PubMed] [Google Scholar]
- Yoshimura, K., A. Batiza, M. Schroeder, P. Blount, and C. Kung. 1999. Hydrophilicity of a single residue within MscL correlates with increased channel mechanosensitivity. Biophys. J. 77:1960–1972. [DOI] [PMC free article] [PubMed] [Google Scholar]