

Abstract
Rupturing fluid membrane vesicles with a steady ramp of micropipette suction produces a distribution of breakage tensions governed by the kinetic process of membrane failure. When plotted as a function of log(tension loading rate), the locations of distribution peaks define a dynamic tension spectrum with distinct regimes that reflect passage of prominent energy barriers along the kinetic pathway. Using tests on five types of giant phosphatidylcholine lipid vesicles over loading rates(tension/time) from 0.01–100 mN/m/s, we show that the kinetic process of membrane breakage can be modeled by a causal sequence of two thermally-activated transitions. At fast loading rates, a steep linear regime appears in each spectrum which implies that membrane failure starts with nucleation of a rare precursor defect. The slope and projected intercept of this regime are set by defect size and frequency of spontaneous formation, respectively. But at slow loading rates, each spectrum crosses over to a shallow-curved regime where rupture tension changes weakly with rate. This regime is predicted by the classical cavitation theory for opening an unstable hole in a two-dimensional film within the lifetime of the defect state. Under slow loading, membrane edge energy and the frequency scale for thermal fluctuations in hole size are the principal factors that govern the level of tension at failure. To critically test the model and obtain the parameters governing the rates of transition under stress, distributions of rupture tension were computed and matched to the measured histograms through solution of the kinetic master (Markov) equations for defect formation and annihilation or evolution to an unstable hole under a ramp of tension. As key predictors of membrane strength, the results for spontaneous frequencies of defect formation and hole edge energies were found to correlate with membrane thicknesses and elastic bending moduli, respectively.
INTRODUCTION
An unstressed fluid-lipid membrane in the form of a solid supported film or closed vesicle can survive for a very long period of time. However, when stressed, some level of membrane tension will cause an unstable hole to open rapidly and rupture the membrane, which is usually an extremely fast and invisible event on the scale of light microscopy. Thus, the challenge is to identify and quantify the molecular-scale factors that govern dynamics of membrane rupture and thereby determine membrane strength. Held together by hydrophobic interactions, one might naively expect lipid membranes to rupture at tensions near hydrocarbon-water surface tension (σo/w ∼ 40 mN/m) by analogy to the disappearance of surface pressure in a lipid monolayer under large expansion at an oil/water interface. However, it has been known for some time that biomembranes rupture at much lower tensions in a range from ∼1 to 25 mN/m and that rupture strength depends prominently on lipid composition (Evans and Needham, 1987; Needham and Nunn, 1990; Bloom et al., 1991; Hallett et al., 1993; Mui et al., 1993; Olbrich et al., 2000). Although viewed traditionally as material constants, we will show here that rupture strength of a biomembrane is a dynamical property and that the level of strength depends on the time frame for breakage.
Many innovative methods have been designed to observe transient permeation and opening of membrane holes. In the majority of experiments, planar membrane films subject to constant tension have been permeated using transmembrane voltages often sufficient to cause capacitive breakdown (Abidor et al., 1979; Harbich and Helfrich, 1979; Chernomordik et al., 1985, 1987; Glaser et al., 1988; Barnett and Weaver, 1991; Zhelev and Needham, 1993; Melikov et al., 2001). Recently, holes in giant membrane vesicles have been opened by adhesion-driven tension and slowed through viscous thickening of the aqueous environment to enable observation by video microscopy (Sandre et al., 1999; Brochard-Wyart et al., 2000). Complementary to these studies, but linked more directly to the determinants of mechanical strength, we show here that rupturing vesicle or cell membranes under ramps of tension (σ = ℜσt) over many decades in timescale provides a straightforward method to explore the kinetic process of hole nucleation. If tested over a sufficient range of loading rate ℜσ, the spectrum of rupture tension versus log(ℜσ) can reveal the principal nano-to-mesoscale energy barriers along the tension-driven pathway that impede the failure process. These barriers are the determinants of membrane strength and the relative heights of these barriers lead to changes in strength on different timescales. As a demonstration of this “dynamic tension spectroscopy” (DTS), we present results from rupture tests on five types of giant phosphatidylcholine (PC) vesicles over a span of four orders in magnitude of loading rate (tension/time ∼0.01–100 mN/m/s). We will show that the loading rate dependence of rupture events implies a kinetic process that begins with nucleation of a molecular-scale defect, which then either vanishes or evolves to become an unstable hole. Correlation of the histograms for rupture tension to the distributions predicted by theory yields the size and frequency of initial defect formation plus the attempt rate and hole edge energy that govern passage of the final barrier to catastrophic failure.
MATERIALS AND METHODS
Lipids and vesicle preparation
Fluid membrane vesicles were made from five diacyl PC lipids: saturated 1,2-tridecanoyl-sn-glycero-3-phosphocholine (diC13:0) DTPC; cis unsaturated 1-stearoyl-2-oleoyl-sn-glycero-3- phosphocholine (C18:0/1) SOPC; 1,2-dioleoyl-sn-glycero-3-phosphocholine (diC18:1) DOPC; 1,2-dilinoleoyl-sn-glycero-3-phosphocholine (diC18:2) DLnOPC; and 1,2-dierucoyl-sn-glycero-3-phosphocholine (diC22:1) DEPC. These synthetic species of diacyl PC lipids were purchased from Avanti Polar Lipids (Alabaster, AL) in chloroform and used without further purification. The solutions were stored in amber glass screw cap vials with Teflon-lined silicone septa, wrapped in aluminum foil, and kept at −20°C under argon. To create giant bilayer vesicles (∼20-μm diameter), lipid films were first dried from chloroform:methanol (2:1) onto the surface of a roughened Teflon disk (Needham et al., 1988). After deposition of the lipid film and evaporation of the organic solvent in vacuo, the Teflon disk was covered with a film of warm (37°C) sucrose solution (200 mM) and allowed to prehydrate before swelling in excess buffer. The final aliquot of giant vesicles was obtained by manifold dilution of the prehydrated lipid in an equi-osmolar glucose or salt buffer. The difference of inner and outer solutes created differences in both refractive index and density, which significantly enhanced optical discrimination of the vesicle contour (compare to Fig. 1) and sedimented vesicles to the floor of the microscope chamber.
FIGURE 1.

(Top) Video microscope image of a 20-μm (C18:0/1) PC bilayer vesicle aspirated into a micropipette. (Bottom) Intensity scans taken along the axis of symmetry before (solid curve) and the next video step 0.01 s after (dotted curve) vesicle rupture.
Measurement of rupture strength
Micropipette pressurization was used to increase membrane tension and lyse single vesicles. A steady ramp of pipette suction P(t) = cpt was produced with a motorized ground-glass syringe pump connected to the micropipette assembly. Tension was calculated from the pressure using the well-known relation, σ(t) = P(t)Rp/2(1 − Rp/Rs), for a fluid membrane vesicle (Kwok and Evans, 1981), as defined through measurement of the inner pipette radius Rp and radius Rs of the vesicle segment exterior to the pipette. Both the vesicle projection length Lp inside the pipette and the radius Rs of the vesicle segment exterior to the pipette were monitored continuously throughout each test up to rupture. The loading rate ℜσ was determined directly from the slope of tension versus time. High speed video-image analysis was used to track the vesicle boundaries along the axis of symmetry at framing rates of at least 100/s as shown by the intensity profiles in Fig. 1. Vesicle rupture resulted in disappearance of its projection inside the pipette within a single video scan of 0.005–0.010 s, which provided accurate definition of rupture tension within 0.01 s × ℜσ (mN/m/s). Hydrodynamic impedance of the pipette system limited inflow of the exterior vesicle volume after rupture, which could only be observed for vesicles that broke at very low suction pressures (e.g., diC13:0). The transient disappearance of diC13:0 vesicles yielded an approximate suction-dependent inflow rate of ΔV/Δt ∼ 100 (μm3/s) P/(N/m2) for the typical pipette radius of 3 μm. Optical measurement of pipette radius contributed a random uncertainty of SD ∼ ±5% in the magnitude of tension and tension loading rate.
RESULTS
The results obtained with the method of dynamic tension spectroscopy are a set of rupture tension distributions for several loading rates and a DTS spectrum defined by the plot of the distribution peaks as a function of log(loading rate). In the tests described here, histograms of rupture tensions for each type of lipid were collected at six loading rates in the range from 0.01 to 100 mN/m/s. Fig. 2 shows sample tension histories for two vesicles made from the same lipid tested under a slow and fast loading rate up to failure. The generic evolution in shape of rupture distributions from slow to fast loading rates is demonstrated in Fig. 3 with histograms for three of the lipids from weakest to strongest. Superposed on the histograms are probability densities for failure predicted by the kinetic theory for rupture to be developed in the following section. Immediately apparent in Fig. 3, positions of histograms shift to higher tensions with increase in loading rate. Moreover, the shapes of distributions begin to narrow at slow rates and broaden asymmetrically on approach to fast rates; the spreads observed in rupture tension are significantly greater than experimental error at all loading rates. As we will show in the Theory section, the generic changes in distribution shape, width, and location with loading rate reveal a switch in impedance to rupture from one kinetic barrier to another. The parameters that characterize these dominant energy barriers can be estimated directly from analysis of the DTS spectrum defined by most frequent rupture tension versus log(loading rate) which is plotted for all five lipids in Fig. 4. The fits of the kinetic model to these spectra were used with a set of statistical master equations to predict the probability distributions superposed in Fig. 3. Coincident with evolution in distribution width from narrow to broad, the spectra in Fig. 4 begin with a shallow rise in strength at slow loading rates that crosses over to a steep increase in strength with rate under fast loading. The crossover signifies a switch in dominance by one kinetic barrier to another. Finally, from the perspective of material properties, the DTS plots in Fig. 4 show that the characteristic level of membrane strength increases with lipid chain length and drops dramatically for polyunsaturated chains.
FIGURE 2.

Membrane tension as function of time for two vesicles made from diC18:2 PC; one loaded at slow rate and the other at fast rate up to rupture (noted by asterisks).
FIGURE 3.

Comparative histograms of rupture tensions collected at slow (top row) and fast (bottom row) loading rates for vesicles made from (left) diC13:0 PC, (middle) C18:0/1 PC, and (right) diC22:1 PC. Superposed on each distribution is the probability density for failure predicted by the kinetic model for membrane rupture and the parameters listed in Table 1.
FIGURE 4.

Dynamic tension spectra defined by the plots of most frequent rupture tension as a function of log(tension loading rate). Superposed are continuous curves predicted by the kinetic model for membrane rupture and the parameters listed in Table 1.
THEORY
The major increase in rupture tension at fast rate compared to slow rate in Fig. 2 clearly demonstrates the intrinsic dynamical connection between membrane strength and survival time. Reduction in the likelihood of membrane survival under stress was appreciated almost a half century ago by Deryagin and Gutop (1962). Building on the classical nucleation theory of Zeldovich (1943) for cavitation in three-dimensional liquids, they theorized that the random—but limited—lifetime of a thin fluid film stems from thermally activated nucleation of an unstable hole. In their mesoscopic theory, Deryagin and Gutop used the mechanics of opening a hole in a two-dimensional continuum to describe the energy landscape governing cavitation. Here, the energy of cohesion is defined by the product of a material edge energy, ɛ (energy/length), and the hole perimeter, 2πr. Under mechanical tension, σ, the total energy, E(r), is lowered through the potential for mechanical work of expansion, E(r) ≈ (2πr) ɛ − (πr2) σ, which becomes the dominant term at large radii. Thus, a maximum in energy occurs at a critical radius, rc = ɛ/σ, and defines the height of the cavitation barrier, Ec = πɛ2/σ. Both height and radial position of this barrier diminish reciprocally under a ramp of tension in the course to rupture. Consequently, as we will show below, the thermally-activated frequency for hole opening (i.e., passage of the cavitation barrier) is expected to rise rapidly under a tension ramp on a scale defined and bounded by σc = πɛ2/kBT.
In more recent times, observations of electrical conductance and transient permeation through solvent-spread membranes (Abidor et al., 1979; Chernomordik et al., 1985, 1987; Glaser et al., 1988) have revealed that a more complex energy landscape governs dynamics of membrane permeation. In particular, fluctuations of voltage-dependent conductance showed that molecular-scale defects arise and vanish spontaneously in membranes. Initially, these transient structures were imagined to be very small hydrophobic pores that quickly round into hydrophilic structures lined with lipid headgroups. Consistent with concepts described earlier by Helfrich (1974), it was expected that rimming the edge with hydrophilic headgroups should diminish the large perimeter energy associated with exposure of hydrocarbon to water and lower the cavitation energy barrier. But perhaps most significant, it was recently demonstrated from careful study of transient bursts in membrane conductance that the spikes in conductance represented sequences of metastable nanopore states originating within the lifetime of a closed metastable defect labeled as a pre-pore state (Melikov et al., 2001). Surprisingly, the results also implied that no more than one defect was likely to exist in the membrane at any time (Melikov et al., 2001). Although the molecular-scale structures of such defects and open holes in membranes remain unknown, these electrical conductance measurements have shown clearly that some type of precursor state must be introduced into the classical theory of cavitation. Hence, in the idealized concept of configurations represented by a radius space, the energy landscape for open holes would commence from an intermediate state following a defect nucleation barrier as schematized in Fig. 5.
FIGURE 5.

Schematic of the energy landscape in hole radius space used to model the kinetic process of membrane rupture. The precursor barrier Eδ at rδ governs creation of a molecular-scale defect that then either vanishes or passes over the outer cavitation barrier to catastrophic failure. The height Ec of the cavitation barrier above the metastable state at energy E* is set by hole edge energy, ɛ, and mechanical tension, σ; i.e., Ec − E* = πɛ2/σ.
Kinetic model for membrane failure
Implicit in the energy landscape sketched in Fig. 5 is the assumption that an unstable hole is linked causally to a particular defect, which is supported by the recent studies of fluctuations in membrane conductance. Thus, although defects may arise anywhere on the membrane, they remain rare, isolated events, that either vanish or occasionally evolve to an unstable hole. Easily understood, membrane rupture is most likely to occur when tension rises above the level where the time needed for passage of the cavitation barrier falls to within the lifetime of a defect. Formulated into a hierarchy of master equations that simulates the stochastic process of failure, our model requires analytical prescriptions for each kinetic rate of barrier passage. Beginning with defect formation, we assume that the energy rises steeply from the ground state and is capped by a sharply-curved barrier at an energy level of Ep defined initially as Eδ in the unstressed state. For a sharp barrier, the height Ep will diminish under tension in proportion to the effective area of the defect, i.e., Ep(σ) ≈ Eδ − (πrδ2)σ. Thus, for a thermally-activated rate of transition ∼exp(−Ep/kBT), the frequency of defect formation νo→* will grow exponentially on a scale of tension defined by σδ = kBT/πrδ2, i.e.,
 |
(1) |
where the rate prefactor νoδ scales as exp(−Eδ/kBT). Given a sharp defect barrier, the energy E* of the metastable state that follows will drop from its initial level Eo by effectively the same amount under tension, i.e., E* ≈ Eo − (πrδ2)σ. Hence, the rate of defect annihilation  would remain approximately constant as expressed by
 |
(2) |
Finally, rising from the defect state at energy E*, the energy landscape is modeled by the mesoscopic mechanics of opening a hole in a continuous material as described above and sketched in Fig. 5. Beyond the cavitation barrier defined by Ec = E* + πɛ2/σ, an unstable hole opens to cause catastrophic failure of the membrane. Scaling barrier height by thermal energy defines the characteristic tension, σc = πɛ2/kBT, for thermal activation, i.e., rate ∼ exp(−σc/σ). Because the outer barrier is inversely proportional to tension in this mesoscopic model, we see that a defect cannot become an unstable hole at zero tension and that some level of tension is needed to rupture the membrane. As found by Deryagin and Gutop (albeit expressed in a much less organized relation than given here; Deryagin and Gutop, 1962), the frequency of opening an unstable hole ν*→hole is predicted to increase dramatically with application of tension up to the level defined by σc,
 |
(3) |
The origin (via Zeldovich) of Eq. 3 comes from Kramers' Brownian-dynamics theory (Kramers, 1940; Hanggi et al., 1990) for thermally-activated escape from a deeply-bound state. Deceptively simple, Kramers' result in the overdamped limit can be summarized in a generic expression for transition (escape) rate, i.e., ν→ = (D/lolts)exp[−Eb/kBT]. The major factor is exponential dependence on height of the barrier Eb, which for two-dimensional cavitation is exp(−σc/σ). The Brownian-diffusive dynamics are embodied in an attempt frequency, D/lolts, which is governed by a coefficient of damping ζ (≡kBT/D) and the product of two length scales lolts. The length lo is defined by the thermal spread in bound state local to the minimum. In the context of hole dynamics, fluctuations in bound state are confined by the perimeter-edge energy and thus the thermal spread is approximated by, lo ≈ kBT/(2πɛ). The other length, lts, is the energy-weighted width of the transition state. Governed by the fall in energy away from the top of the cavitation barrier, −π(r − rc)2σ, the thermal barrier width can be estimated by the Gaussian approximation, lts ≈ (kBT/σ)1/2. As a consequence of the variable barrier width, the attempt frequency in Eq. 3 is modulated by a weak tension-dependent function (σ/σc)1/2. Taken together, these approximations predict an attempt frequency prefactor νδc that depends on the ratio of the tension scale to damping coefficient, νδc ≈ 2π1/2σc/ζ.
Continuing with the perspective of Kramers' theory, it follows that the frequency νoδ for spontaneous nucleation of defects should vary as νoδ ∼ [kBT/(ζrδ2)]exp(−Eδ/kBT), if rδ2 is used to approximate the product lolts. As above, a ratio of thermal tension scale to damping coefficient sets the scale for attempt frequency and we obtain the expression, νoδ ∼ (πσδ/ζ)exp(−Eδ/kBT). Thus, if a common factor ζ characterizes damping of Brownian fluctuations over the entire energy landscape, the attempt frequency νδc for passage of the cavitation barrier should be directly related to the spontaneous frequency νoδ of defect formation through the height of the defect barrier, i.e., νδc/νoδ ≈ (σc/σδ)exp(Eδ/kBT). Although hypothetical, the assumption of a nearly-constant damping factor is not unreasonable given the very small area compressibility of biomembranes (Rawicz et al., 2000). Very small compressibility implies that changes in area caused by defect creation/annihilation and fluctuations in hole size would produce in-plane collective flows at essentially constant surface density. For simple radial flow, membrane surface-shear viscosity ηm determines the damping of circular fluctuations (i.e., ζ ≈ 4πηm). Completely obscure in this type of mesoscopic model, the frequency scales νoδ and νδc could involve an unknown prefactor ascribed to the number of sites Nδ for defect formation in a macroscopic membrane. However, as noted above, careful study of fluctuations in membrane conductance indicate that only a single defect state is likely to exist in the membrane at any time (Melikov et al., 2001). So we neglect the putative factor Nδ, which in any case merely remains a hidden homogeneous constant that arbitrarily scales time.
Dynamic regimes of membrane strength
The hypothesis is that membrane rupture arises from one unstable hole and that this hole must evolve during the lifetime of a particular defect. Hence, with the frequencies defined by Eqs. 1–3, we employ the following hierarchy of statistical (Markov) master equations to predict the causal sequence of defect formation and annihilation or evolution to an unstable hole:
 |
(4) |
So(t), S*(t), and Shole(t) are the probabilities of being in the defect-free ground state, metastable state, and ruptured state respectively. The last equation specifies the probability density for rupture events in a window of time t → t + Δt, i.e., prup(t) = dShole(t)/dt. Under a ramp of tension σ(t) = ℜσt, the distribution of rupture times is transformed by loading rate ℜσ (=dσ/dt) into the distribution of rupture tensions, i.e., prup(σ) = ν*→hole S*(σ)/ℜσ.
Simple inspection of the energy landscape (Fig. 5) shows that the outer cavitation barrier will fall below the defect barrier when tension rises above a level such that (Eδ − Eo)/kBT > σc/σ. As a consequence, the model predicts two distinct regimes in the spectrum of rupture tension as a function of loading rate. First, a high strength regime at fast loading rates arises when rupture is limited by creation of a defect. Second, a low strength regime at slow loading rates arises when rupture is limited by opening of a hole (i.e., passage of the cavitation barrier) within the lifetime of a defect. In each regime away from the crossover, the statistics of transitions can be approximated by solution to a single Markov equation using one of the following expressions for the limiting transition rate ν[σ(t)]:
 |
(5) |
Please note that the passage of the cavitation barrier must occur within the lifetime of a defect; thus, the effective frequency scale for the cavitation-limited regime depends on defect annihilation, i.e.,  or ∼νoδ exp(Eδ − Eo/kBT). When dominated by one barrier, the distribution of rupture events in time becomes
  , and the distribution of rupture tensions is again obtained through transformation by the loading rate,
  . The peak in the tension distribution (most frequent rupture) defines the rupture strength, σ, expected at the loading rate ℜσ. The dependence of expected strength σ on loading rate is easily derived from the maximum of the probability distribution ∂p/∂σ = 0, which yields the generic relation, ν(σ) = ℜσ{∂ log(ν)/∂σ}σ=σ. With this expression and the frequencies of barrier passage given in Eq. 5, the regimes of strength dominated by each barrier are predicted as functions of loading rate:
 |
(6) |
The defect-limited regime is a simple straight line with slope σδ, which extrapolates to a loading rate intercept given by, ℜσo = νoδσδ. By comparison, the cavitation-limited regime is a shallow nonlinear curve that rises very slowly as rate increases over many orders of magnitude. The distinctly different shapes of the two limiting regimes result in a prominent crossover in membrane strength when the loading rate is fast enough to rapidly suppress the outer cavitation barrier leaving the defect barrier as the dominant impedance to rupture. As we will show next, estimates of the parameters governing strength can usually be obtained by matching Eq. 6 to the appropriate portions of an experimental spectrum. However, match of the full solution of the Markov process (Eq. 4) to the measured distributions provides the best quantification of the kinetic parameters and is also needed to place a bound on the metastable state energy Eo.
ANALYSIS OF EXPERIMENTS
Analysis of a complete membrane rupture experiment is best begun by matching the strength regimes in Eq. 6 to appropriate segments of a DTS spectrum. The tests of C18:0/1 (SOPC) vesicles are well suited to demonstrate the coarse-grained methods used to analyze each strength regime. However, clear identification of both regimes can be difficult when the frequency of defect formation is either very small (e.g., diC22:1) or very large (e.g., diC13:0). In such cases, parameter estimates can be readily obtained for one regime; but full analysis of the tension distributions at all rates is needed to accurately specify parameters of the other regime.
As shown with the SOPC spectrum in Fig. 6 top, the first step was to match a straight line to the high strength data at fast loading rates >10 mN/m/s, consistent with the defect-limited regime of strength shown in Eq. 6. The outcome was a spontaneous rate for defect formation νoδ (≈0.18/s) and a tension scale σδ = kBT/rδ2 (≈4 pN) set by defect size. The next step was to match the cavitation-limited regime to the lower level of rupture tension at slow loading rates. As seen in Fig. 6 bottom, fit of the cavitation-limited regime was much less sensitive to the choice of parameters defined by the edge energy (tension scale σc = πɛ2/kBT) and attempt rate ν′δc. If only required to fit the rupture strength at one value, a mere twofold change of tension scale in a cavitation-limited regime was accompanied by a many orders-of-magnitude change in the rate scale (e.g., ν′δc ∼ 103–1011/s for σc ∼ 80–200 mN/m). However, extending the fit to cover a large span in loading rate (e.g., 0.07–3 mN/m/s) significantly narrowed the range of acceptable values to σc ∼ 120–140 mN/m (i.e., ɛ ∼ 13 ± 0.5 pJ/m) and νδc ∼ 106–107/s. Using these parameter estimates and the Markov equations (Eq. 4), the final step in data analysis was to refine the values by matching the probability densities for failure to all of the histograms at different loading rates. Examples of tension distributions that result from this procedure are superposed on the histograms in Fig. 3 and the continuous spectra of rupture strength are plotted with the data for most frequent rupture tension in Fig. 4. Here, fits to tension distributions measured in the crossover region from the cavitation-limited to defect-limited regime were particularly useful for restricting the model parameters in difficult cases like diC13:0 and diC22:1. The reason is that in the crossover region, a distribution is narrow and rises steeply on the low tension side of the peak but is broadened significantly and falls more gradually on the high tension side. The asymmetry stems from a major difference in kinetic impedance between the two cavitation and defect barriers under tension.
FIGURE 6.
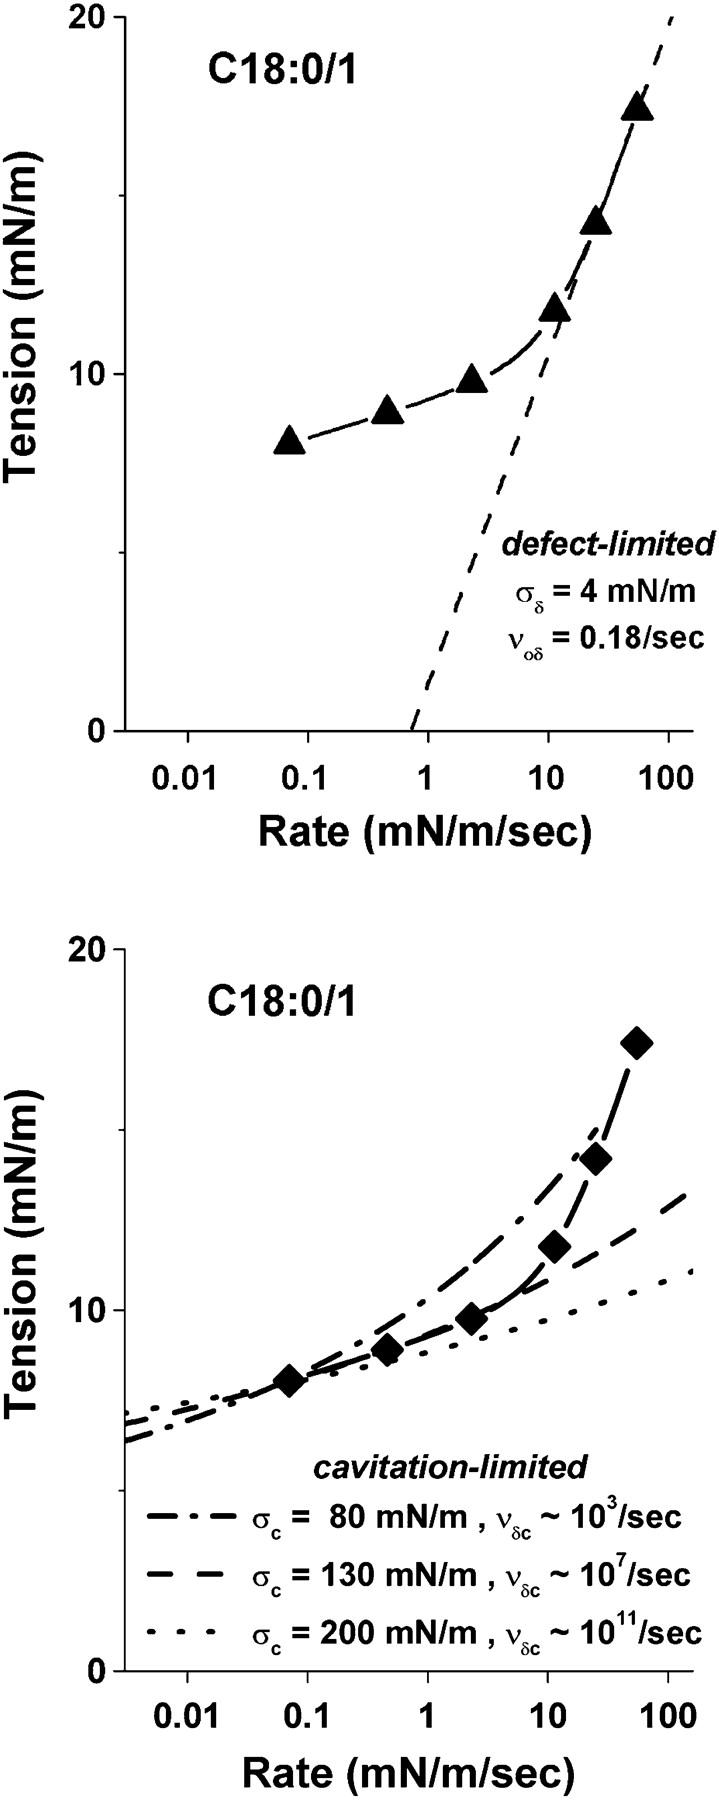
Demonstration of the initial step in analysis of DTS measurements using the spectrum from tests on C18:0/1 PC vesicles. (Top) A straight line fit to high strengths at fast loading rates represents defect-limited kinetics. The intercept and slope of this line reveal the spontaneous frequency for formation of defects, νoδ ∼ 0.18/s, and tension scale for rate exponentiation, σδ ∼ 4 mN, as set by defect area (i.e., σδ = kBT/πrδ2). (Bottom) Three shallow-curved regimes matched to the slowest loading rate result represent cavitation-limited kinetics. As noted on the figure and described in the text, each of these curves depends on a second tension scale, σc, which is set by hole edge energy (i.e., σc = πɛ2/kBT), and an attempt frequency, νδc, for passage of the cavitation barrier. To fit the data over an extended span in loading rate, the parameter values were restricted to σc ≈ 130 mN/m with corresponding rate scale νδc ∼ 107/s.
In the final step of fitting probability densities to the measured histograms of tension, the metastable state energy Eo became an additional parameter. Because of the enormous difference in timescales between cavitation-limited and defect-limited kinetics, the kinetics of hole opening are bounded by the lifetime of the metastable state, which is effectively determined by the reciprocal of the rate of defect annihilation, νo←* ≈ νo exp(Eo/kBT). Hence, the frequency scale for excitations local to the metastable state depends on the exponential weight, exp[−(Eδ − Eo)/kBT]. In matching all of the distributions for the five lipids, the only clear requirement for optimal fit was a lower bound of 0–3 kBT on the values of Eo relative to the defect-free ground state. As such, the distributions of rupture tension under slow loading were indistinguishable for any higher value of Eo given a commensurate increase in height of the defect barrier Eδ. Signified by the asterisk in Table 1, values of νδc are given for a lower bound of Eo ∼ 0 kBT; for Eo ∼ 3 kBT, the values shift upward by an order of magnitude.
TABLE 1.
Material parameters that govern strength of PC membranes
| νoδ s−1 | σδ mN/m | rδ nm | νδc* s−1 | σc mN/m | ɛ pJ/m | |
|---|---|---|---|---|---|---|
| diC13:0 | 8.0 | ∼3 | 0.66 | ∼1 × 10⁶ | 30 | 6.2 |
| diC18:2 | 2.0 | 3.5 | 0.61 | ∼1 × 10⁶ | 30 | 6.3 |
| diC18:1 | 0.22 | 4.0 | 0.57 | ∼3 × 10⁶ | 102 | 11.5 |
| C18:0/1 | 0.18 | 4.0 | 0.57 | ∼5 × 10⁶ | 130 | 13 |
| diC22:1 | 0.09 | 4.5 | 0.54 | ∼8 × 10⁶ | 220 | 17 |
The parameters listed in Table 1 were used to the compute the final tension distributions for each type of lipid bilayer as seen in Fig. 3 and the continuous DTS curves in Fig. 4. The most pronounced variations of parameters in Table 1 are among the values for spontaneous frequency of defect formation, νoδ, and edge energy, ɛ. Immediately apparent based on our previous measurements of membrane elasticity and thickness properties (Rawicz et al., 2000), the variations in edge energy, ɛ, and the barrier energy, Eδ, that governs frequency of defect formation, νoδ, can be correlated to changes in membrane bending stiffness (Fig. 7 top) and hydrocarbon thickness (Fig. 7 bottom), respectively. In the latter case, the barrier energies were calculated from the ratios of tension and frequency scales in Table 1 according to the relation, Eδ/kBT ≈ Loge(σδ/σc) + Loge(νδc/νoδ), which assumes that a common damping coefficient characterizes both defect and hole dynamics.
FIGURE 7.
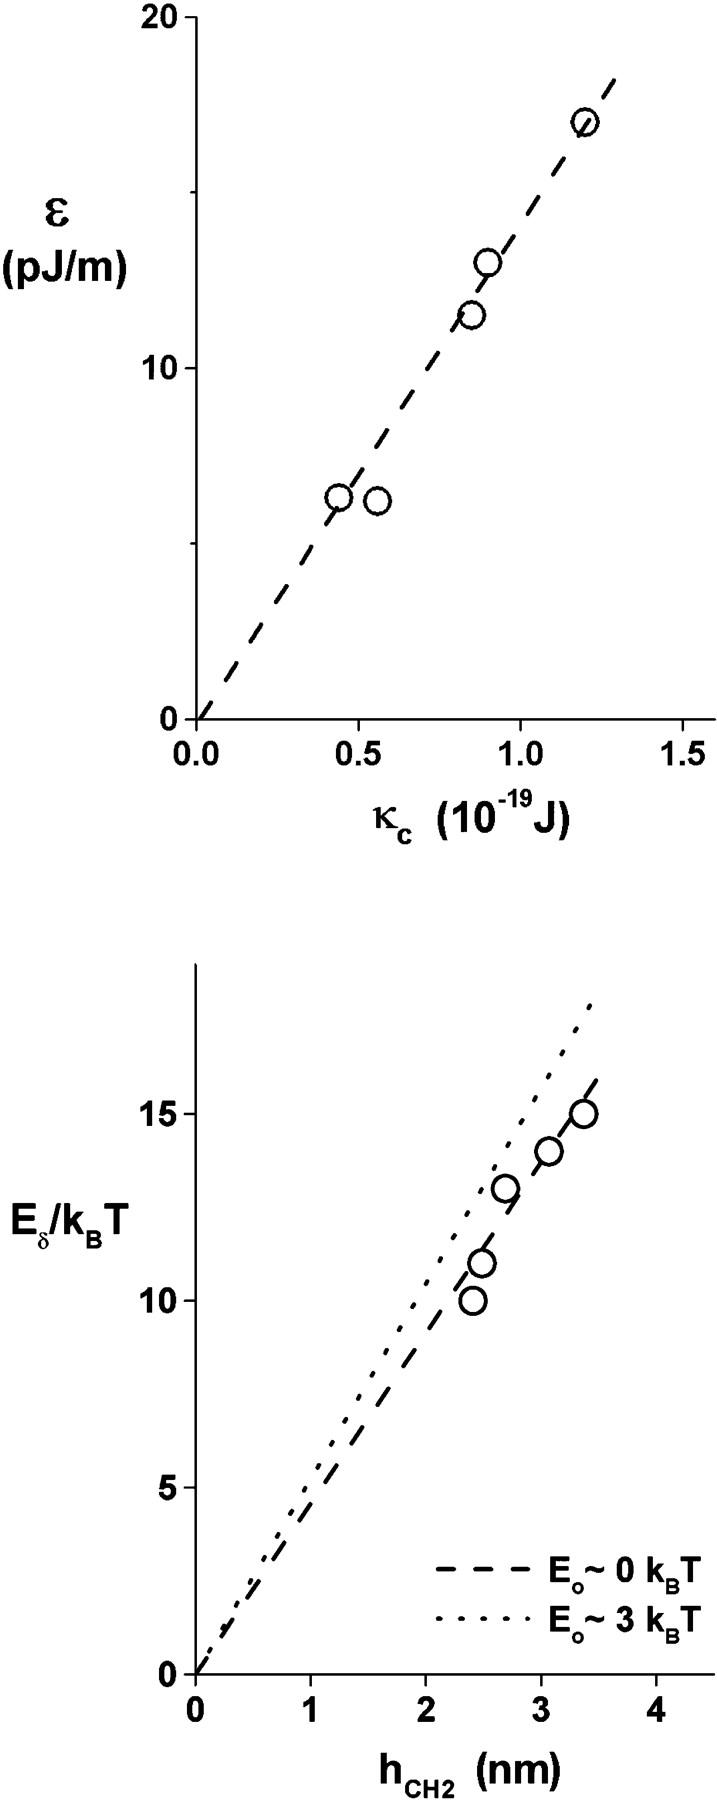
(Top) Correlation of hole edge energy from Table 1 to membrane elastic-bending stiffness as measured by micromechanical tests (Rawicz et al., 2000). (Bottom) Correlation of defect barrier energy estimated from the ratios of tension (σδ/σc) and frequency (νδc/νo) scales in Table 1 to membrane core-hydrocarbon thickness as derived from x-ray diffraction measurements (Rawicz et al., 2000). Described in the text, defect barrier energy is defined by Eδ/kBT ≈ Loge(σδ/σc) + Loge(νδc / νo). The open circles are values of νδc in Table 1 based on a lower bound of Eo ∼ 0 kBT. At Eo ∼ 3 kBT, values of νδc are increased 10-fold and barrier energies shift upward correspondingly.
CONCLUSIONS
For fluid membranes made from five diacyl PCs, we find two distinct regimes of rupture strength as a function of dynamic loading. Under very slow ramps of tension, a low strength regime appears where rupture tension increases weakly with ramp rate (i.e., only ∼1–2 mN/m over at least two orders of magnitude in rate) and the tension distributions are very narrow. But under fast ramps of tension, a high strength regime emerges where rupture tension rises dramatically (as much as 10 mN/m change for an order-of-magnitude increase in rate) and the tension distributions are significantly broadened. In earlier work (Evans and Ludwig, 2000), we tested rupture strength versus loading rate for three of these lipids up to ∼10 mN/m/s but were puzzled that predictions of the cavitation theory always failed to curve upward fast enough to match rupture tensions at the fastest rates as demonstrated in Fig. 6 bottom. Hence, our experimental system was redesigned to enable precision detection of vesicle boundary displacements at 50-fold faster video rates and to provide fivefold faster pressure ramps. Using the new apparatus, the original tests were redone with an increase in statistics from ∼40 to ∼100 vesicles at each rate and additional tests were performed at significantly faster loading rates (i.e., >20 mN/m/s in Figs. 4 and 6). Since the rupture strengths continued to depart from the cavitation prediction at the highest rates in direct proportion to log(loading rate), it was clear that some type of defect is nucleated before hole opening. As such, membrane rupture is most likely to occur when tension rises above the level where the time needed for passage of the cavitation barrier falls to within the lifetime of a defect. Based on this model, both the shape and functional form of each rupture distribution are well predicted by a Markov sequence where the rupture process begins with nucleation of a nanoscale defect that then either disappears or evolves to become an unstable hole.
As emphasized earlier, similar concepts arose from the early studies on electrical conductance, transient permeation, and breakdown of solvent-spread membranes under constant tension (Abidor et al., 1979; Chernomordik et al., 1985, 1987; Glaser et al., 1988; Barnett and Weaver, 1991). But the most relevant evidence in support of the stochastic events described by our model comes from the recent detailed study (Melikov et al., 2001) of fluctuations in membrane conductance under low voltages. Here, it was found that bursts of transient, ∼1-nm holes open and close within the lifetime of a pre-pore defect state (Melikov et al., 2001). Moreover, it was concluded that the pre-pore defect must be a local-isolated nonconductive state distinct from the closed ground state. Significantly, our DTS experiments imply that nucleation begins with a defect of ∼1-nm cross-section and that the defect lifetime ranges from ∼0.1 s to 10 s, which is similar to the survival of the pre-pore state deduced from bursts in electrical activity. Also consistent with other experiments, the edge energies in Table 1 are within the span of ∼10–20 pJ/m found in earlier studies using natural lecithins (Harbich and Helfrich, 1979; Chernomordik et al., 1985) and ∼10 pJ/m found in vesicle electroporation experiments using synthetic C18:0/1 PC (Zhelev and Needham, 1993). Given the added complexity of electric fields plus the presence of organic solvent in the case of the BLM experiments, the consistency between parameters obtained from electrical permeation and our mechanical DTS experiments (Table 1) strongly supports the efficacy of the simple kinetic model.
In addition to the consistency with electrical conductance and permeation experiments just described, correlations of edge energy and defect barrier energy to membrane elasticity and thickness reinforce basic tenets of the kinetic model and provide important insights into the material determinants of strength. First, for reasons noted earlier, edge energy is expected to depend in some way on membrane bending rigidity based on the traditional concept of a rounded-hydrophilic edge lined with lipid headgroups. But more subtle, the linear correlation between edge energy and bending stiffness in Fig. 7 top yields a length kc/ɛ ≈ 7 nm that is much larger than the ∼2-nm thickness for a monolayer. Based on simple energetic concepts, this length should characterize the effective radius of curvature for the edge. As such, the large length scale seems to indicate that the edge shape for a membrane hole is much flatter than a circular contour. Concomitantly, the acyl chains would deviate significantly from the surface normal and appear to be sheared relative to the membrane plane. Moreover, the edge region would encompass a large number of lipids. Perhaps coincidental, snapshots of pore formation obtained recently in molecular dynamics simulations of a membrane under mechanical stress seem to exhibit similar cusplike shapes (D. P. Tieleman, H. Leontiadov, A. E. Mark, and S.-J. Marrink, unpublished results). In addition, although the range is limited, it is interesting that the estimated heights of defect barriers increase in proportion to membrane-hydrocarbon thickness (compare to Fig. 7 bottom). Assuming that barrier energy vanishes at zero thickness, the proportionality is estimated to be ∼4–5 kBT per nm. This energy per length is severalfold less than expected for exposure of the acyl chains to water, which seems consistent with a hole edge bordered with lipid headgroups. As a corollary to the barrier heights plotted in Fig. 7 bottom, the ratios σc/νδc of tension scale to attempt frequency in Table 1 provide an upper bound on the coefficient for damping of Brownian excitations in lipid membranes. Because of the weak sensitivity of the cavitation-limited regime to changes in attempt frequency as shown in Fig. 6 bottom, the bound on damping coefficient can only be narrowed to an order-of-magnitude range, i.e., ζ ∼ 1 × 10⁻⁴ mN s/m (or ∼1 × 10⁻⁵ mN s/m for Eo ∼ 3 kBT).
In regard to dynamics, our observation that projection lengths always vanished within one video time step (∼0.005–0.010 s) sets an upper bound to hole opening time. If we neglect the drag of water on the membrane, a simple continuum model predicts the time, thole, for opening a hole. Under tension rising at rate ℜσ above the rupture level, σrupt, the opening time is easily shown to be approximately thole ∼ τm log[σrupt/(τmℜσ)], where the timescale, τm, is set by the ratio of surface viscosity to rupture tension, τm = (2ηm/σrupt). Based on the damping coefficient deduced from kinetics of rupture, ηm ≈ ζ/4π ∼ 10−5 mN s/nm, we would expect holes to open within ∼30–100 μs even at the slowest loading rate of ℜσ ∼ 0.01 mN/m/s and low rupture tensions of ∼2 mN/m (as for diC13:0). At the same time, disappearance of the vesicle projection length within the video observation time sets an upper bound of ∼10−3 mN s/m on surface viscosity.
Finally, in related work, Bermudez et al. (2002) reported interesting measurements of rupture strength under slow loading rates for polymersome membranes made with poly(elthyleneoxide)-poly(butadiene) diblock copolymers. These membranes were two- to fivefold thicker than the thickest (diC22:1) PC membrane tested here. In their study, Bermudez et al. (2002) concluded that rupture strength increased as a modest 1.6 power of polymersome-membrane thickness. By comparison, we find a much stronger increase of strength with lipid chain length at slow loading rates for thin PC bilayers (compare to Fig. 4). Although not a simple power law, rupture strengths of PC bilayers at slow rates of loading increase qualitatively as thickness to ∼4–5 power, which is expected from the dependence of the cavitation-limited regime on square of edge energy and the dependence of edge energy on square of thickness. However, as indicated by the results for diC22:1, we expect rupture strength of thick membranes to shift upward mainly through a shift of the defect-limited regime to slower loading rates, i.e., an increase in defect energy barrier. Hence, the observation by Bermudez and co-workers that the strength of polymersome membranes increases modestly with thickness would be consistent with our finding that the defect energy barrier increases in approximate proportion to thickness.
Acknowledgments
This work was supported by Canadian Institutes for Health Research grant MT7477.
References
- Abidor, I. G., V. B. Arakelyan, L. V. Chernomordik, Y. A. Chizmadzhev, V. F. Pastushenko, and M. R. Tarasevich. 1979. Electric breakdown of bilayer lipid membranes. I. The main experimental facts and their qualitative discussion. J. Electroanal. Chem. 104:37–52. [Google Scholar]
- Barnett, A., and J. Weaver. 1991. Electroporation: a unified, quantitative theory of reversible electrical breakdown and mechanical rupture in artificial planar bilayer membranes. Bioelectrochem. Bioenerg. 21:163–182. [Google Scholar]
- Bermudez, H., A. K. Brannan, D. A. Hammer, F. S. Bates, and D. E. Discher. 2002. Molecular weight dependence of polymersome membrane structure, elasticity, and stability. Macromolecules. 35:8203–8208. [Google Scholar]
- Bloom, M., E. Evans, and O. G. Mouritsen. 1991. Physical properties of the fluid lipid bilayer component of cell membranes. Quart. Rev. Biophys. 24:293–397. [DOI] [PubMed] [Google Scholar]
- Brochard-Wyart, F., P.-G. de Gennes, and O. Sandre. 2000. Transient pores in stretched vesicles: role of leak-out. Physica A. 278:32–51. [Google Scholar]
- Chernomordik, L. V., M. M. Kozlov, G. B. Melikyan, I. G. Abidor, V. S. Markin, and Y. A. Chizmadzhev. 1985. The shape of lipid molecules and monolayer membrane fusion. Biochim. Biophys. Acta. 812:643–655. [Google Scholar]
- Chernomordik, L. V., S. I. Sukharev, S. V. Popov, V. F. Pastushenko, A. V. Sokirko, I. G. Abidor, and Y. A. Chizmadzhev. 1987. The electrical breakdown of cell and lipid membranes: the similarity of phenomenologies. Biochim. Biophys. Acta. 902:360–373. [DOI] [PubMed] [Google Scholar]
- Deryagin, B. V., and Y. V. Gutop. 1962. Theory of the breakdown (rupture) of free films. Kolloidn. Zh. 24:370–374. [Google Scholar]
- Evans, E., and F. Ludwig. 2000. Dynamic strengths of molecular anchoring and material cohesion in fluid biomembranes. J. Phys. Condens. Matter. 12:A315–A320. [Google Scholar]
- Evans, E., and D. Needham. 1987. Physical properties of surfactant bilayer membranes composed of lipids, cholesterol and polypeptides: thermal transitions, elasticity, cohesion and colloidal interactions. J. Phys. Chem. 91:4219–4228. [Google Scholar]
- Glaser, R. W., S. L. Leikin, L. V. Chernomordik, V. F. Pastushenko, and A. I. Sokirko. 1988. Reversible electrical breakdown in lipid bilayers: formation and evolution of pores. Biochim. Biophys. Acta. 940:275–287. [DOI] [PubMed] [Google Scholar]
- Hallett, F. R., J. Marsh, B. G. Nickle, and J. M. Wood. 1993. Mechanical properties of vesicles. II. A model for osmotic swelling and lysis. Biophys. J. 64:435–442. [DOI] [PMC free article] [PubMed] [Google Scholar]
- Hanggi, P., P. Talkner, and M. Borkovec. 1990. Reaction-rate theory: fifty years after Kramers. Rev. Mod. Phys. 62:251–342. [Google Scholar]
- Harbich, W., and W. Helfrich. 1979. Alignment and opening of giant lecithin vesicles by electric fields. Z. Naturforsch. 34a:1063–1065. [Google Scholar]
- Helfrich, W. 1974. The size of bilayer vesicles generated by sonication. Phys. Lett. 50A:115–116. [Google Scholar]
- Kramers, H. A. 1940. Brownian motion in a field of force and the diffusion model of chemical reactions. Physica A. 7:284–304. [Google Scholar]
- Kwok, R., and E. Evans. 1981. Thermoelasticity of large lecithin bilayer vesicles. Biophys. J. 35:637–652. [DOI] [PMC free article] [PubMed] [Google Scholar]
- Melikov, K. C., V. A. Frolov, A. Shcherbakov, A. V. Samsonov, Y. A. Chizmadzhev, and L. V. Chernomordik. 2001. Voltage-induced nonconductive pre-pores and metastable single pores in unmodified planar lipid bilayer. Biophys. J. 80:1829–1836. [DOI] [PMC free article] [PubMed] [Google Scholar]
- Mui, B. L.-S., P. R. Cullis, E. A. Evans, and T. D. Madden. 1993. Osmotic properties of large unilamellar vesicles prepared by extrusion. Biophys. J. 64:443–453. [DOI] [PMC free article] [PubMed] [Google Scholar]
- Needham, D., T. J. McIntosh, and E. Evans. 1988. Thermomechanical and transition properties of DMPC: cholesterol bilayers. Biochemistry. 27:4668–4673. [DOI] [PubMed] [Google Scholar]
- Needham, D., and R. S. Nunn. 1990. Elastic deformation and failure of lipid bilayer membranes containing cholesterol. Biophys. J. 58:997–1009. [DOI] [PMC free article] [PubMed] [Google Scholar]
- Olbrich, K., W. Rawicz, D. Needham, and E. Evans. 2000. Water permeability and mechanical strength of polyunsaturated phosphatidylcholine bilayers. Biophys. J. 79:321–327. [DOI] [PMC free article] [PubMed] [Google Scholar]
- Rawicz, W., K. Olbrich, T. McIntosh, D. Needham, and E. Evans. 2000. Effect of chain length and unsaturation on lipid bilayer elasticity. Biophys. J. 79:328–339. [DOI] [PMC free article] [PubMed] [Google Scholar]
- Sandre, O., L. Moreaux, and F. Brochard-Wyart. 1999. Dynamics of transient pores in stretched vesicles. Proc. Natl. Acad. Sci. USA. 96:10591–10596. [DOI] [PMC free article] [PubMed] [Google Scholar]
- Zeldovich, J. B. 1943. On the theory of new phase formation; cavitation. Acta Physicochim. URSS. 18:1–22. [Google Scholar]
- Zhelev, D. V., and D. Needham. 1993. Tension-stabilized pores in giant vesicles: determination of pore size and pore line tension. Biochim. Biophys. Acta. 1147:89–104. [DOI] [PubMed] [Google Scholar]