

Abstract
The depth of insertion of an antimicrobial peptide, protegrin-1 (PG-1), in lipid bilayers is investigated using solid-state NMR. Paramagnetic Mn2+ ions bind to the surface of lipid bilayers and induce distance-dependent dipolar relaxation of nuclear spins. By comparing the signal dephasing of the peptide with that of the lipids, whose segmental depths of insertion are known, we determined the depths of several residues of PG-1 in 1,2 dilauryl-sn-glycero-3-phosphotidylcholine (DLPC) bilayers. We found that residues G2 at the N-terminus and F12 at the β-turn of the peptide reside near the membrane surface, whereas L5 and V16 are embedded in the acyl chain region. The depths increase in the order of G2 < F12 < L5 < V16. These intensity-dephasing results are confirmed by direct measurement of the paramagnetically enhanced 13C transverse relaxation rates. The relative depths indicate that PG-1 is tilted from the bilayer normal, which is consistent with independent solid-state NMR measurements of PG-1 orientation in the same lipids (Yamaguchi et al., 2001). They also indicate that PG-1 is fully immersed in the lipid bilayer. However, a quantitative mismatch between the bilayer thickness and PG-1 length suggests a local thinning of the DLPC bilayer by 8–10 Å. The depth sensitivity of this Mn2+ dephasing technique is tunable with the Mn2+ concentration to focus on different regions of the lipid bilayer.
INTRODUCTION
Protegrin-1 (PG-1, MW 2154 Da) is an 18-residue broad-spectrum antimicrobial peptide found in porcine leukocytes (Kokryakov et al., 1993). It is effective against Gram-positive bacteria, Gram-negative bacteria and fungi (Steinberg et al., 1997), and exhibits modest antiviral activities against HIV-1 (Tamamura et al., 1995). In solution, PG-1 adopts an antiparallel β-strand structure (Aumelas et al., 1996; Fahrner et al., 1996), where the two strands are stabilized by two disulfide bonds between the four Cys residues in the molecule. Like many other antimicrobial peptides, PG-1 is rich in cationic residues. A total of six positively charged Arg residues are located at the N- and C-termini of the molecule and at the β-turn. Such a disulfide-stabilized β-sheet conformational motif is common to a number of other antimicrobial peptides such as human defensins and tachyplesin (Hancock and Lehrer, 1998).
The three-dimensional structure of membrane peptides and proteins in the lipid bilayer, manifested as the orientation, depth of insertion, and backbone conformation, provides important insights into the function of these molecules. For antimicrobial peptides that spontaneously insert into bacterial membranes, the orientation and depth of insertion are particularly useful for determining the mechanism of membrane disruption. For example, the barrel-stave model of antimicrobial activity requires a transmembrane orientation (He et al., 1996), whereas the carpet mechanism dictates an in-plane orientation (Pouny et al., 1992). Such orientation information can be readily determined using solid-state NMR spectroscopy (Wu et al., 1994), because nuclear spin frequencies are inherently dependent on molecular orientations relative to the magnetic field. In comparison, site-specific knowledge of the depth of insertion of peptides in lipid bilayers is more limited. A 1H spin diffusion NMR technique was recently developed to probe membrane protein topology and obtain semiquantitative depth information (Huster et al., 2002; Kumashiro et al., 1998). This technique detects the rate of 1H magnetization transfer from mobile lipids to the rigid protein. Because the magnetization transfer is driven by distance-dependent 1H-1H dipolar couplings, the transfer rate yields the proximity of the protein from the lipid segments. However, this technique requires the protein to have suitable mobility in the bilayer: mobile peptides have inefficient magnetization transfer rates from the lipids. Beyond NMR, electron paramagnetic resonance spectroscopy and optical spectroscopic methods such as fluorescence resonance energy transfer are well established for investigating the depth of insertion of membrane peptides (Altenbach et al., 1994; Lakey et al., 1993; Ogawa et al., 2001; Shin et al., 1993). However, these approaches require the use of bulky and often dynamic spin probes, which complicate the extraction of the immersion depth.
Paramagnetic ions such as Mn2+, Gd2+ (Dwek, 1973; Jacob et al., 1999; Peters et al., 1995), and nitroxide spin labels have long been used in high-resolution solution NMR for depth determination. The paramagnetic species, incorporated at well-defined locations relative to the lipid molecules, enhance the relaxation of the nuclear spins. The resulting line broadening or peak suppression has been exploited to determine the location of small peptides in lipid-mimetic media such as detergents and micelles (Brown et al., 1982; Esposito et al., 1992; Franklin et al., 1994; Jacob et al., 1999; Papavoine et al., 1994). Paramagnetic effects have also been exploited in the solid state. For example, comparison of the 13C spin-lattice relaxation rates of lipids and cholesterol in the presence of paramagnetic Gd3+ yielded quantitative information on the location of cholesterol in model membranes (Villalain, 1996). Site-specific dynamics of bacteriorhodopsin was studied by monitoring Mn2+-induced dephasing of 13C signals in solid-state magic-angle spinning (MAS) spectra (Tuzi et al., 2001). Prosser and coworkers utilized the increasing solubility of paramagnetic O2 from the membrane surface to the bilayer center to achieve depth-dependent spin-lattice relaxation of 19F labels incorporated into detergents and membrane peptides, thereby determining the immersion depth (Prosser et al., 2000; Prosser et al., 2001). Paramagnetic Dy3+ has also been used to estimate the depth of insertion of the M13 coat protein, by observing distance-dependent differential quenching of the lipid and peptide resonances (Grobner et al., 1999).
The aim of the current work is to determine the depth of insertion of PG-1 in lipid bilayers and to explore the general utility of paramagnetic Mn2+ for depth determination. Our recent orientation study using 13C and 15N NMR established that PG-1 is tilted in 1,2 dilauryl-sn-glycero-3-phosphotidylcholine (DLPC) bilayers, with the β-strand axis at ∼55° from the bilayer normal. This orientation favors the hydrophobic part of PG-1 to be embedded in the bilayer, with the Arg-rich ends of the antiparallel β-sheet close to the phosphate headgroups. However, this depth of insertion model has not been directly tested. To obtain this information, we utilize Mn2+ as a paramagnetic relaxation agent. Paramagnetic Mn2+ induces distance-dependent line broadening of the nuclear spin signals by enhancing the spin-spin relaxation rate ( ). We show here that Mn2+ binding at the membrane surface dephases the lipid 13C signals, and the amount of dephasing decreases monotonically with increasing depths of the lipid functional groups, which are well known from neutron and x-ray diffraction studies (White and Wimley, 1999; Wiener and White, 1992). Thus, by comparing the intensity dephasing or T2 relaxation enhancement of PG-1 carbons with that of the lipid carbons, the relative depth of the peptide with respect to the lipid moieties can be extracted. We measured both the intensity dephasing and the 13C T2 relaxation rates of PG-1 in DLPC bilayers. The two results consistently place PG-1 completely in the DLPC bilayer, with L5 and V16 residues closest to the center of the bilayer. The relatively thin DLPC bilayer was chosen both to compliment our previous orientation measurements and because the mobility of the peptide and lipids are comparable in this bilayer. In the longer-chain POPC lipids, however, PG-1 is mostly immobilized (J. J. Buffy, A. Waring, R. I. Lehrer, and M. Hong, unpublished results), making a comparison of the peptide and lipid paramagnetic T2 relaxation rates unsuitable. For that case, the depth information is best obtained using other methods such as 1H spin diffusion (Huster et al., 2002).
MATERIALS AND METHODS
Materials
DLPC was purchased from Avanti Polar Lipids (Alabaster, AL) and stored as a powder at −30°C. The main-phase transition temperature for DLPC is −1°C. Trifluoroethanol, chloroform, and MnCl2 were purchased from Aldrich Chemicals (Milwaukee, WI). 15N-labeled and 13CO-labeled L-valine were obtained from Cambridge Isotope Laboratories (Andover, MA) and converted to the Fmoc derivative by AnaSpec, Inc. (San Jose, CA). Citric acid and NaOH were purchased from Fischer Scientific (Pittsburgh, PA) and used without further purification.
PG-1 was synthesized according to previously published procedures (Yamaguchi et al., 2002). Fig. 1 shows the amino acid sequence of the peptide and the labeled residues. Four 13C labels were incorporated either singly or doubly in several samples: 1), G2 Cα; 2), L5 Cα; 3), F12 C′; and 4), V16 C′. The labeled sites were chosen to cover the two ends of the long molecule, which include the N- and C-termini and the β-turn, as well as the central hydrophobic β-strand region.
FIGURE 1.

Amino acid sequence of PG-1. Dashed lines denote residues labeled with 13C, either at the Cα or the CO position. The Arg residues are indicated with a cross.
NMR sample preparation
Unoriented peptide-lipid mixtures for MAS experiments were prepared by codissolving appropriate amounts of PG-1 and lipids in trifluoroethanol and chloroform to achieve a peptide/lipid molar ratio (P/L) of 1:20. The combined solution was dried under a stream of N2 gas and the resulting membrane film was redissolved in a small amount of cyclohexane. This was lyophilized. The mixture was then redissolved in 4 mL of a citrate buffer (10 mM citrate, 10 mM KCl, pH 4.8) and extruded across polycarbonate membranes with a pore size of 1 μm to obtain relatively uniform vesicles. For the Mn2+-bound samples, a MnCl2 solution in citrate buffer was then added to the extruded vesicles and stored for 2 h at 4°C to equilibrate. The aqueous solution was then ultracentrifuged at 150,000 g for 2 h, the pellet was lyophilized until dry and then rehydrated to 35% (w/w). Lyophilization of the pellet allows us to pack more sample into the rotor as well as have a well-defined hydration level. As a result of lyophilization, the Mn2+ ions are on both surfaces of the lipid bilayer. This does not affect the current depth study, because the peptide can also insert from both sides. The membrane samples typically contained ∼5 mg PG-1 and 29 mg DLPC. The Mn2+ concentration is reported in mol percentages relative to the lipid amount.
Determination of manganese binding concentration
After ultracentrifugation the Mn2+ ions remaining in the supernatant were oxidized to permanganate, MnO4−, by addition of periodate (IO4−) and heating gently for 10 min. Supernatant containing Mn2+ yielded a pale pink solution after treatment with periodate. UV-visible (UV/VIS) absorption at 525 nm was measured on a ThermoSpectronic Genesys 10UV (Waltham, MA) to yield the amount of unbound Mn2+. The difference from the initially added Mn2+ was calculated to give the amount of bound Mn2+.
Solid-state NMR spectroscopy
The NMR experiments were carried out on a Bruker Avance DSX-400 spectrometer (Karlsruhe, Germany) operating at a resonance frequency of 162.12 MHz for 31P and 100.72 MHz for 13C (9.4 Tesla magnetic field). The samples were packed into 4-mm zirconia rotors and placed in the spinning module of a MAS probe. All experiments were carried out at room temperature (292 ± 3 K). Typical pulse lengths were 5.0 μs for 13C and 31P and 4 μs for 1H. A cross-polarization (CP) contact time of 0.5 ms was used to optimize the peptide signal while still retaining much of the lipid signals. The spinning speed was 4 kHz, regulated to within 3 Hz by a Bruker pneumatic control unit. Between the control and Mn2+-dephased spectra, the same experimental conditions were used. The typical recycle delay was 2 s. The 13C carrier frequency was chosen to be between the aliphatic and the carbonyl region, at 134 ppm (relative to TMS), for the intensity dephasing experiments, but shifted to 57 ppm in the aliphatic region for the 13C T2 measurements. The same 13C carrier frequency was used for the control and the dephased spectra to minimize intensity differences due to excitation bandwidth effects. The 13C and 31P chemical shifts were referenced externally to the glycine carbonyl signal (176.4 ppm) and the 31P signal of liquid phosphoric acid (0 ppm), respectively. 13C T2 relaxation times were measured using a Hahn-echo sequence, where the central 180° pulse was phase-cycled using the EXORCYCLE scheme (Bodenhausen et al., 1977) to minimize the offset dependence of the T2 measurement. Before the Hahn echo, 13C magnetization was established either by a 90° pulse, or direct polarization (DP), or cross polarization from the protons. Thus, the sequence is (13C) 90° − τ − 180° − τ − FID for the DP experiment, and (1H) 90° − (1H,13C) spin lock − τ − (13C) 180° − τ − FID for the CP experiment.
The paramagnetic contribution to dipolar transverse relaxation,  , depends on the average electron-nucleus distance (r) according to (Bloembergen, 1957; Solomon, 1955):
 |
(1) |
where the correlation time τs is the inverse sum of the electronic spin-lattice relaxation time  the rotational correlation time of the molecule
  and the residence time of the Mn2+ near the nuclear spin
 |
(2) |
In Eq. 1, W is the local concentration of the Mn2+ ions, γc is the gyromagnetic ratio of 13C spin, μ0 is the vacuum permeability, μeff is the effective magnetic moment of Mn2+ ions, and β is the Bohr magneton. ωc and ωe represent the 13C and electron Larmor frequencies, respectively. Assuming that the rotational correlation time and the Mn2+ residence time are comparable for DLPC lipids and PG-1, which is a reasonable approximation (see Discussion), the paramagnetic enhanced relaxation of a peptide 13C site should be comparable to that of a lipid carbon if the two spins are equidistant from Mn2+.
RESULTS
Depth-dependent Mn2+ dephasing curves for DLPC
To test the utility of Mn2+-induced T2 relaxation enhancement for depth determination, we first examined the lipid 13C signal dephasing in the presence of varying concentrations of Mn2+. A representative pair of 13C direct-polarization spectra, without Mn2+ (lower spectrum, S0) and with 12 mol % Mn2+ (top spectrum, S), is shown in Fig. 2. As a consequence of paramagnetic T2 relaxation, the Mn2+-containing sample exhibits reduced intensities, or increased line widths, compared to the control spectrum, S0. To guide the eye, the S0 intensities are shown as horizontal lines for the corresponding peaks in the dephase spectrum. The increase in the full-width at half-maximum (FWHM) varies with the proximity of the segment to the Mn2+ ions. For example, the lipid chain segments from the methyl end to C3 show no increase of FWHM at this low Mn2+ concentration, whereas the chain carbonyl C1, glycerol G2, and the headgroup Cα show an increase of 5 Hz, 20 Hz, and 48 Hz, respectively. However, the true paramagnetic contribution to T2,  must be measured by a spin-echo experiment (see below). Here, we first report the Mn2+-induced line broadening in terms of intensity dephasing, S/S0. The degree of dephasing varies for different segments of the lipid molecule and also depends on the Mn2+ concentration. The most upfield lipid 13C signals (<25 ppm), which result from the acyl chain ends near the center of the bilayer, show the least dephasing, whereas the glycerol backbone and the headgroup resonances between 50 and 70 ppm suffer the largest intensity loss. Higher concentrations of Mn2+ dephase the signals more significantly. At 50–100 mol %, many peaks in the glycerol backbone and headgroup are broadened to the point of being barely observable.
FIGURE 2.

13C direct-polarization MAS spectra of DLPC. (a) Without Mn2+; (b) with 12 mol % Mn2+. Peak assignment is indicated, along with the structure and nomenclature of DLPC lipids. Horizontal bars in b denote the heights of the corresponding peaks in the Mn2+-free control sample. Note the increasing amount of signal reduction from the acyl chain end to the glycerol region.
Fig. 3 summarizes the Mn2+-induced intensity reduction for DLPC segments with Mn2+ molar concentrations of 12%, 15%, 20%, 50%, and 100%. The intensity dephasing of the individual segments, S/S0, is normalized with respect to the maximum S/S0 value, which typically belongs to the acyl chain end methyl group ω. Thus, the y axis is the relative intensity dephasing  This is reasonable because the acyl chain ends at the center of the lipid bilayer are on average the furthest from the surface-bound Mn2+ and should experience the least paramagnetic line broadening. This normalization procedure factors out differences in sample amounts and numbers of scans for signal averaging between the control and the Mn2+-bound samples. The
  values are plotted as a function of the lipid moieties from the phosphate group at the membrane surface to the ω group in the bilayer center. It can be seen that the residual 13C intensities increase monotonically with increasing separation from the membrane surface, where the Mn2+ ions bind. The dephasing also becomes more severe with increasing Mn2+ concentration. At the lowest Mn2+ concentration of 12%, the curve rises most steeply in the glycerol backbone region but is relatively flat in the acyl chains, indicating that the intensity is most sensitive to distance variations at the membrane-water interface. At intermediate Mn2+ concentrations of 15–20 mol %, the largest slope and the strongest distance sensitivity occur at the beginning of the acyl chains, between C1 and C3 carbons. Finally, at the highest Mn2+ concentrations of 50–100 mol %, the normalized dephasing curves rise most sharply near the ends of the acyl chains while the signals of the glycerol moieties have nearly completely dephased. Thus, the highest Mn2+ concentrations are not sensitive to the depth of peptide residues at the membrane-water interface. The signals of the choline headgroup α, β, and γ carbons, which can be detected at low Mn2+ concentrations, are not shown here because their positions are less important for the depth determination compared to the other functional groups. As expected, the error bars in the relative dephasing are the largest for the highest Mn2+ concentrations and for the interfacial segments closest to the Mn2+ ions.
FIGURE 3.

13C dephasing for various lipid segments, obtained as the ratio of the peak heights between the Mn2+-bound sample and the Mn2+-free sample. The ratios are normalized with respect to the maximum acyl chain signal, which is typically the methyl carbon, ω. The dephasing curves for several Mn2+ concentrations are shown. Error bars smaller than the symbols are not shown.
Although the average depths of lipid segments are well known from x-ray and neutron diffraction data of liquid-crystalline bilayers (White and Wimley, 1999), we plot the Mn2+ calibration curves with respect to the functional groups rather than their presumed depths. This better reflects the comparative nature of the paramagnetic relaxation enhancement approach for determining the immersion depth of membrane peptides.
In addition to 13C spectra, 31P spectra of the lipid headgroup were also measured for representative lipid/Mn2+ samples to verify Mn2+ binding to the lipid bilayer. Samples containing 50% or more Mn2+ showed no 31P intensities, whereas samples with lower Mn2+ concentrations showed markedly reduced intensities compared to pure DLPC without Mn2+. Therefore, all Mn2+ dephasing curves treat the phosphate group as the point of Mn2+ binding.
UV/VIS analysis of the supernatant after ultracentrifugation of the membrane samples strongly suggests that Mn2+ bind to lipids in a 1:2 stoichiometric ratio at the saturation limit. This is based on the observation that lipid samples prepared at 100 mol % Mn2+ had about half of the initial amount of Mn2+ left in the supernatant, whereas samples prepared with 50 mol % or less Mn2+ had negligible ions remaining in the supernatant. This is consistent with previous studies of the binding of divalent cations to lipid bilayers (Altenbach and Seelig, 1984; Lehrmann and Seelig, 1994). The similarity of the dephasing curves for 50 mol % and 100 mol % Mn2+ in Fig. 3 further supports the stoichiometry of binding.
Depth of PG-1 insertion from intensity dephasing
The distance-dependent dephasing of the lipid 13C signals by Mn2+ indicates that it is possible to measure, at least semiquantitatively, the depth of membrane-bound peptides with comparable mobility as the lipid molecules. This can be achieved by referencing the dephasing of the peptide signals with that of the lipids. Several PG-1 samples containing four 13C labeled residues were synthesized (Fig. 1): G2 Cα, L5 Cα, F12 C′, and V16 C′. These labeled sites are chosen to cover all regions of the β-strand molecule and to avoid chemical shift overlap with the lipid 13C signals. Mn2+-free and Mn2+-bound membrane mixtures were prepared in parallel. 31P spectra were acquired on representative peptide-containing samples to ensure Mn2+ binding. As seen with the pure DLPC samples without PG-1, 50 mol % or higher Mn2+ content completely dephased the 31P signal. PG-1 exhibits stronger intensities in the CP spectra than in the DP spectra due to its restricted mobility. Thus, the CP experiment was conducted to obtain the  values of the lipid and the peptide. The lipid depth profiles from the CP and DP experiments were verified to be similar.
Representative 13C MAS spectra of several PG-1/DLPC samples in the presence and absence of Mn2+ are shown in Fig. 4. The L5 Cα (Fig. 4 a) and G2 Cα (Fig. 4 b) signals are well resolved from the lipid 13C signals, and show good S/N in the absence of Mn2+. The carbonyls of F12 and V16 are also sufficiently resolved from the lipid carbonyl signals to allow the peak maxima to be defined unambiguously (Fig. 4, a and c). For the two Cα sites, the L5 signal is partially retained in the Mn2+-bound sample whereas the G2 peak is completely dephased. For the V16 and F12 carbonyl carbons, the F12 signal is suppressed more strongly than the lipid carbonyl, whereas the V16 carbonyl signal is better retained than the lipid carbonyl peak. Qualitatively, these indicate that G2 is located closest to the membrane surface, whereas V16 is most deeply inserted in the bilayer.
FIGURE 4.
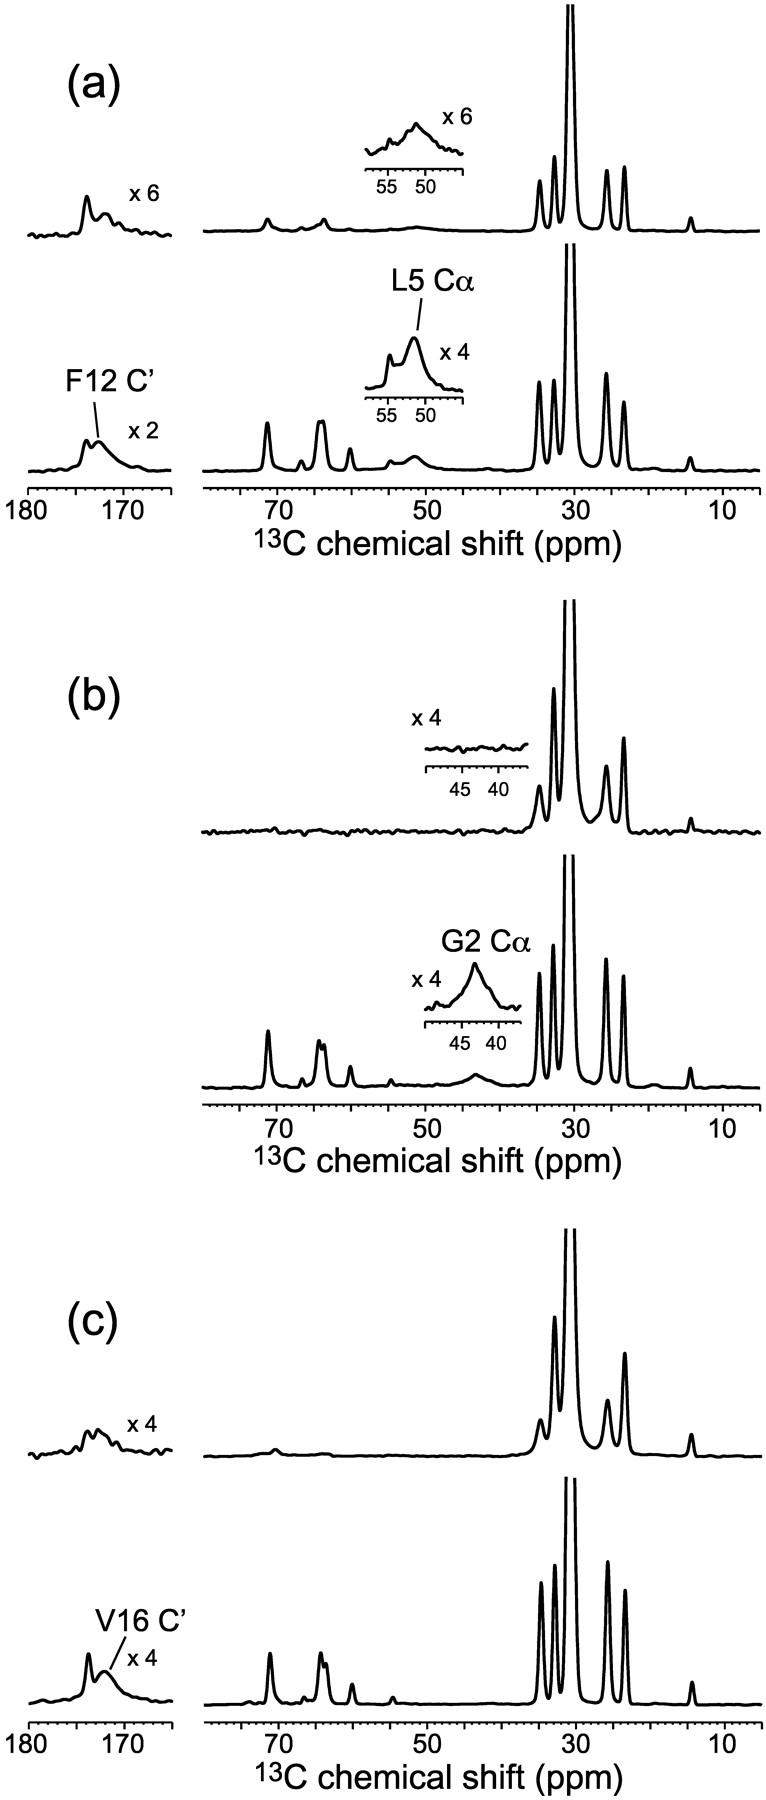
13C CP-MAS spectra of DLPC mixed with various 13C-labeled PG-1. (a) L5 Cα, F12C′-labeled PG-1. (b) G2 Cα labeled PG-1. (c) V16C′-labeled PG-1. P/L = 1:20. Bottom and top spectra correspond to the Mn2+-free and Mn2+-bound samples, respectively. The Mn2+ concentrations relative to DLPC are 15 mol % in a, 10 mol % in b, and 100 mol % in c.
More precise information on the depths of these residues is obtained from the Mn2+-dephasing curves. Fig. 5 a displays the  dephasing curves for L5 Cα and F12 C′. Three samples incorporating 15%, 50%, and 100% Mn2+ were measured. The L5 Cα signal consistently falls between the glycerol G1 and C1 (carbonyl) of the lipid. However, the F12 C′ dephasing is comparable to the glycerol carbon G3 in the 15% Mn2+ sample but shifts to that between G1 and C1 for the 50% Mn2+ sample. Because the 15% data show higher S/N and resolution than the 50% sample, the peak intensities are more reliable. However, this dephasing difference may partly reflect real differences in the depth of F12 between the two samples: the Arg-rich β-turn where F12 is located may be repelled by higher concentrations of the cationic Mn2+, thus becoming more deeply inserted compared to low Mn2+ concentrations. The F12 C′ dephasing at 100% Mn2+ is not analyzed for this reason, in addition to the fact that the peptide signal has coalesced with the lipid carbonyl peak. To ascertain the F12 C′ insertion in the dilute Mn2+ limit, we prepared another PG-1/DLPC mixture with F12 C′ and G2 Cα labels containing only 10 mol % Mn2+. The well-resolved 13C spectra at this low Mn2+ concentration confirmed that F12 C′ is located near the G3 carbon of the glycerol backbone.
FIGURE 5.

(a) Relative dephasing of L5 Cα and F12C′ in L5 Cα, F12C′-labeled PG-1, superimposed onto the lipid dephasing curves with 100 mol % (▴), 50 mol % (•), and 15 mol % (▪) Mn2+. (b) Relative dephasing of G2 Cα-labeled PG-1 with 10 mol % Mn2+ (▴) and V16C′-labeled PG-1 with 15 mol % (•) and 100 mol % Mn2+ (▪).
The V16 C′ and G2 Cα dephasing are shown in Fig. 5 b. Both the 100% and 15% Mn2+ data show that V16 C′ signal is well retained and its dephasing falls between that of the acyl chain C2 and C3. In contrast, the G2 Cα signal is completely dephased even at a low Mn2+ concentration of 10%, indicating that this N-terminal residue is located very close to the phosphate group.
Depth of PG-1 from 13C T2 relaxation enhancement
To confirm the intensity dephasing results, we directly measured the Mn2+-enhanced 13C spin-spin relaxation times of DLPC and PG-1,  Fig. 6 shows representative T2 decays of the lipid (CH2)n and C2 signals of pure DLPC lipids without PG-1. The intensities as a function of echo delays are well fit to single exponential functions. In the absence of Mn2+, the decay constants are similar for the different acyl chain segments. The addition of Mn2+ increased both T2 relaxation rates, but more significantly for C2 than for CH2. This is expected because C2 is closer to the bilayer surface than the average methylene carbons. A low Mn2+ concentration of 15% was used in this case to achieve good depth resolution in the glycerol backbone region of the bilayer. Addition of PG-1 did not affect the trend of lipid 13C T2. Fig. 7 plots the 13C T2 relaxation times of PG-1-bound DLPC lipids without Mn2+ and with 15% Mn2+. Although the T2 values of Mn2+-free DLPC molecules are relatively invariant with the segmental depths, the T2 values in the presence of the Mn2+ show a clear monotonic decrease toward the surface of the bilayer. The T2 values are shown on a log scale to emphasize the differences among the segments.
FIGURE 6.

Intensity decays of (CH2)n (▪, □) and C2 (•, ○) carbons of DLPC as a function of the Hahn echo delays in the absence (□, ○) and presence (▪, •) of Mn2+. Note the larger increase of the decay rate of C2 than (CH2)n in the presence of Mn2+. A direct-polarization experiment was used.
FIGURE 7.

13C T2 relaxation times of DLPC without Mn2+ (•) and with 15 mol % Mn2+ (▪, □). CP (▪) and DP (□) experiments showed roughly the same T2 times in the Mn2+-bound sample. The depth-dependent T2 relaxation enhancement by Mn2+ is evident. Both the control and Mn2+ bound samples contain PG-1 at P/L = 1:20. The T2 values are plotted on a log scale to emphasize the differences between segments.
From the T2 relaxation times in the absence of Mn2+,  and in the presence of Mn2+,
  we can calculate the paramagnetic contribution to spin-spin relaxation,
  according to:
 |
(3) |
Fig. 8 shows the  values for L5α and F12C′ in PG-1 in 15 mol % Mn2+, superimposed onto the lipid
  curve. The L5
  value is comparable to the lipid carbonyl carbon C1, whereas F12 C′ has a relaxation time comparable to the glycerol G2. These are consistent with the intensity dephasing measurements within experimental uncertainties. The
  value for the lipid G3 carbon was difficult to measure due to its proximity to the phosphate group. Moreover, the glycerol G3 and G1 chemical shifts are within 0.5 ppm of each other. Although the two signals are resolved in Mn2+-free samples, even a low concentration of Mn2+ causes sufficient line broadening to merge the two peaks. Thus, the measured
  for G1 is biased to lower values. This creates an anomalous dip in the lipid
  curve. This factor is taken into account when estimating the peptide depth.
FIGURE 8.

The Mn2+ contribution to 13C spin-spin relaxation,  for DLPC carbons and for L5 Cα and F12 C′. The F12 C′ position is shaded to indicate the uncertainty associated with measuring the lipid glycerol signal G1.
Heterogeneous lipid motions in the presence of PG-1
The 13C T2 relaxation times of pure DLPC in the absence of PG-1 show little difference whether they are measured using the CP or the DP experiment (Fig. 9 a). This is true except for the most mobile ends of the molecule such as the headgroup γ carbon and the acyl chain ω and ω-1 carbons. The lack of distinction between CP and DP is expected for molecules with homogeneous motional characteristics. Even after the addition of Mn2+ ions, little heterogeneous lipid motion is detected across the bilayer (Fig. 7), indicating that Mn2+ does not cause any change in the lipid dynamics or phase separation.
FIGURE 9.
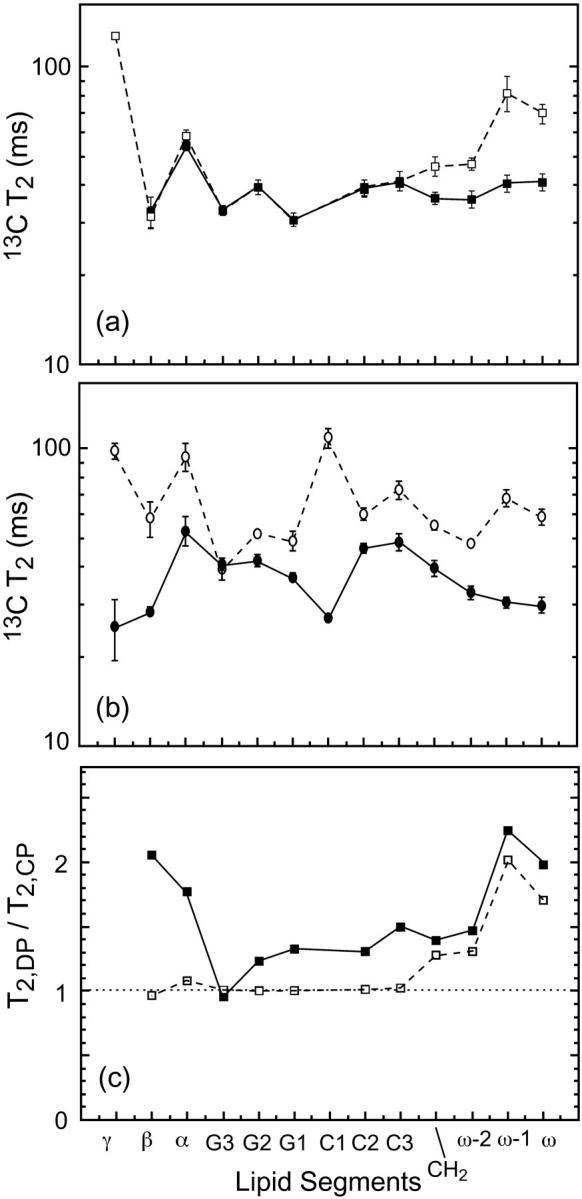
13C T2 of DLPC segments (a) in the absence of PG-1 and (b) in the presence of PG-1. P/L = 1:20. No Mn2+ is added. DP results (open symbols); CP results (filled symbols). (c) Ratio of DP and CP T2 values. The addition of PG-1 reduces the CP T2 values compared to DP for most carbons in DLPC. Lines guide the eye for the T2 trends.
In comparison, upon PG-1 binding, the 13C T2 times of most of the DLPC moieties displayed noticeable differences between the CP and the DP measurements (Fig. 9 b). The T2 relaxation times are shorter in the CP experiment. The reduction is largest for the mobile ends of the lipid but is also significant for the core of the molecule, including the glycerol backbone and the beginning of the acyl chains. The ratios of lipid T2 values, T2,DP/T2,CP are shown in Fig. 9 c to better indicate this discrepancy between the CP and DP T2 values. It can be seen that this discrepancy occurs only for peptide-bound DLPC bilayers. The T2 difference ranges from ∼25% for the glycerol backbone sites to a maximum of ∼120% for the ω-1 group. However, when PG-1 is absent, the T2 ratios for the most rigid part of the lipid molecules are consistently equal to one.
The different lipid T2 values between CP and DP indicate heterogeneous motions of the DLPC lipids in the presence of PG-1. This heterogeneous dynamics gives rise to a distribution of T2 relaxation times. The CP experiment selectively detects the more rigid molecules with stronger 13C-1H dipolar couplings, which exhibit shorter T2 relaxation times compared to molecules in the fast motional limit. A possible cause of this motional heterogeneity is that PG-1 reduces the mobility of its neighboring “boundary” lipids, through electrostatic attractions between the anionic phosphate groups and the cationic Arg residues. It is tempting to speculate that PG-1 may in this way facilitate the formation of ordered domains in lipid bilayers (Edidin, 2003), which can restrict the mobility of not only the lipids but also the peptide. However, further experiments are needed to characterize the peptide dynamics and its implication for aggregation (J. J. Buffy, A. Waring, R. I. Lehrer, and M. Hong, unpublished results). It is noteworthy that similar lipid ordering effects have been reported for gramicidin A (Cornell et al., 1988; Davis, 1986; Ge and Freed, 1999) and for water-soluble polymers such as polyethylene glycol and dextran (Boni et al., 1984). In the case of gramicidin A bound to DPPC lipids, at low concentrations of the peptide (P/L < 1:15), both electron paramagnetic resonance spectra of spin-labeled lipids and 2H and 13C NMR spectra of lipid acyl chains showed increased anisotropies with increasing peptide concentrations. Among the various models proposed to explain this effect, a partial dehydration of the headgroup (McIntosh and Simon, 1994) and a negative hydrophobic mismatch between the lipid and the peptide (i.e., the bilayer is thicker than the peptide) were suggested (Ge and Freed, 1999). The latter mechanism has particular relevance to the current PG-1/DLPC system (see Discussion).
13C isotropic chemical shifts of labeled PG-1 sites
The isotropic chemical shifts ( ) of the four labeled 13C sites are obtained from the control spectra of peptide-lipid mixtures. From these isotropic shifts, conformation-dependent secondary shifts,
  can be calculated using the random coil chemical shifts (
 ) of Wishart et al (1995). As shown in Table 1, all labeled residues except for G2 exhibit strongly β-sheet secondary shifts. This confirms that PG-1 adopts a well-defined β-sheet secondary structure in the lipid bilayer.
TABLE 1.
Experimental 13C isotropic chemical shifts of four labeled sites in PG-1
| Residue | δexp (ppm) | δrc (ppm) | Δexp (ppm) | Δβ-sheet (ppm) |
|---|---|---|---|---|
| G2 Cα | 43.3 | 43.4 | −0.1 | −0.9 |
| L5 Cα | 51.5 | 53.4 | −1.9 | −0.2 |
| F12 C′ | 172.6 | 174.1 | −1.5 | −1.2 |
| V16 C′ | 172.1 | 174.6 | −2.5 | −1.2 |
The corresponding secondary shifts, relative to random coil chemical shifts, are compared with the average secondary shifts of β-sheet structures in proteins.
DISCUSSION
The purpose of this study is to determine the depth of insertion of PG-1 in DLPC bilayers. Our previous orientational study, which found the β-strand axis of PG-1 to be tilted from the bilayer normal (Yamaguchi et al., 2002) in DLPC membranes, favors the peptide to be fully inserted in the bilayer because this optimizes attractive electrostatic interactions. However, this depth hypothesis had not been proven experimentally. The peptide could be partially inserted, and may be inserted asymmetrically with respect to the center of the bilayer. Given the distribution of the charged Arg residues at the two long ends of the molecule, a partial exposure of the peptide to the aqueous phase may be energetically possible. To address these questions, direct site-specific measurement of the depth of insertion is desirable. The use of Mn2+-induced distance-dependent T2 relaxation enhancement for depth determination bears resemblance to the previous studies of the locations of Ala residues in bR (Tuzi et al., 2001), and of the membrane insertion of M13 coat protein (Grobner et al., 1999). However, we have measured not only the intensity dephasing, but also the 13C T2 values in the absence and presence of Mn2+, thus are able to extract the direct paramagnetic contribution to T2, 
The measured Mn2+-induced intensity dephasing of PG-1 relative to that of lipids and the 13C T2 relaxation times indicate that PG-1 is nearly completely immersed in DLPC bilayers and that the β-strand axis cannot be parallel to the bilayer plane. The S/S0 value decreases, or the Mn2+-induced T2 relaxation rate ( ) increases, in the order of V16 < L5 < F12 < G2. This places V16 as the most deeply embedded residue and G2 as the closest to the membrane surface phosphate groups. Because the two most-dephased residues, G2 and F12, are located at the opposite ends of the long β-sheet molecule, whereas the two better-retained residues are positioned in the middle of each β-strand, a collinear orientation of the β-sheet axis with the bilayer surface can be ruled out unambiguously. This is depicted in Fig. 10 a for several depths of PG-1, all with the β-sheet axis parallel to the plane of the bilayer. A position of PG-1 at the surface of the bilayer would result in complete dephasing of the signals from all labeled sites, which contradicts the experimental results. The β-sheet peptide must be at least partly immersed to exhibit measurable signals. If PG-1 is inserted at the membrane-water interface but still has its β-sheet axis parallel to the plane of the bilayer, then one would expect G2 and L5 on the same strand to show similar dephasing while the F12 and V16 residues on the other strand have comparable dephasing. Rotation about the β-strand axis that tilts the plane of the β-sheet away from the bilayer plane should only result in different dephasing between (G2, L5) as a pair and (F12, V16) as a group, but should maintain similar dephasing within each pair of residues. This is also inconsistent with the experimental observation. Finally, if PG-1 is completely immersed in the hydrophobic core of the bilayer but remains coplanar to the bilayer plane, then all labeled sites should retain their signals nearly completely. The experimental dephasing of the four labeled residues rule out any of these possibilities as long as the β-sheet axis is parallel to the membrane plane.
FIGURE 10.

(a) Collinear orientation of PG-1 with the membrane surface at varying depths of insertion, represented by arrows. These possibilities are all ruled out by the current Mn2+ experiments. (b) Proposed depth of insertion of PG-1 based on Mn2+ dephasing. The depths of the four labeled residues increase in the order of G2 (phosphate) < F12 (glycerol G2) < L5 (acyl C1) < V16 (acyl C3). These indicate a tilted orientation for PG-1, consistent with previous experiments (Yamaguchi et al., 2002), as well as report the absolute depths. DLPC bilayers may be thinned locally to better match the PG-1 length.
Instead, the relative dephasing of the four labeled sites dictates that the β-sheet axis of the peptide must be tilted from the bilayer normal, such that a line connecting V16 and L5 is approximately parallel to the plane of the bilayer. In this way, these two residues are nearly equidistant from the membrane surface and experience comparable Mn2+-induced T2 relaxation enhancement (Fig. 10 b). The possibility that V16 and L5 are located in the opposing monolayers rather than the same monolayer can be reasonably ruled out, because that would force the F12 or G2 residues away from the glycerol backbone region, as dictated by the intensity dephasing data. Therefore, the relative Mn2+ dephasing not only confirms the previously measured orientation of the peptide as tilted from the bilayer normal (Yamaguchi et al., 2002), but also places the G2 and F12 residues in the two opposing monolayers of the lipid bilayer. Although the dephasing experiments do not distinguish the two membrane surfaces, which both contain Mn2+, the stronger dephasing of G2 Cα compared to F12 C′ suggests that the peptide is somewhat asymmetrically inserted, with V16 and L5 likely in the same monolayer as the N-terminus G2 residue.
More quantitatively, by comparing the peptide and lipid 13C dephasing and T2 relaxation times, we found that V16 C′ dephasing is between that of C2 and C3 of the lipid chains, L5 Cα is between the glycerol G1 and the carbonyl group C1, and F12 C′ is in the middle of the glycerol backbone region. The G2 Cα signal is completely dephased both in a 10% Mn2+ sample and in a 100% Mn2+ sample, indicating that it is very close to the phosphate group, possibly on the other side of the glycerol backbone. Interestingly, these absolute depths result in a quantitative mismatch between the DLPC bilayer thickness and the peptide length. The solution structure of PG-1 shows the peptide backbone to have a total length of ∼30 Å. When it is constrained in a tilted fashion by the previous orientation measurements and by the current Mn2+ dephasing, the projected backbone length onto the bilayer normal is roughly 20 Å. The phosphate-to-phosphate distance of pure liquid-crystalline DLPC bilayers is ∼30 Å. This is estimated from the thickness of DOPC bilayers as measured by x-ray and neutron diffraction (White and Wimley, 1999). Thus, PG-1 is 8–10 Å shorter than the thickness of pure DLPC bilayers. More specifically, the projection of the G2α-F12C′ internuclear vector onto the bilayer normal is roughly 13 Å. This is also 8–10 Å shorter than the distance between the glycerol backbones of the two opposing monolayers, where the two labeled carbons are located. Fig. 10 b illustrates this apparent mismatch between the PG-1 hydrophobic length and the DLPC bilayer thickness.
This apparent mismatch may be explained by several factors. First, the lipid bilayers and the peptide may be flexible enough to adapt to the hydrophobic thickness of each other and reduce the mismatch. Membrane thinning has been detected for several antimicrobial peptides, including PG-1, by lamellar x-ray diffraction (Heller et al., 2000; Ludtke et al., 1996). The average thinning was found to be 1–2 Å. More dramatic local thinning of the membrane, by as much as 1.5 nm, was reported for DPPC bilayers in the presence of an α-helical peptide, γ1 (Janshoff et al., 1999). This significant thinning, detected by scanning force microscopy, was attributed to interdigitation of the lipid chains. In the current study, there is no direct evidence for such a large bilayer thinning effect. However, in general there has been growing evidence that lipid bilayers are remarkably plastic to accommodate peptides with differing hydrophobic lengths. A number of systematic studies using synthetic peptides were recently carried out to address the problem of hydrophobic mismatch (Harzer and Bechinger, 2000; Strandberg et al., 2002). In one study, synthetic Lys-flanking α-helical peptides with varying hydrophobic lengths were incorporated into the lipid bilayer. When these Lys-containing peptides are significantly shorter than the bilayer thickness, nonlamellar lipid phases were formed, as detected from 31P NMR spectra (Strandberg et al., 2002).
Independently, PG-1 may respond to a thicker bilayer by adopting a more ordered structure. It should be kept in mind that the β-sheet structure used in the present depth modeling was determined in water (Aumelas et al., 1996; Fahrner et al., 1996). In the aqueous environment, the peptide has a disordered N-terminus and a small but noticeable curvature in the backbone. The lipid bilayer differs significantly from the aqueous phase, so the peptide may well become more ordered by straightening the β-sheet, thus lengthening the backbone. Structural differences of small peptides between the solution state and the lipid bilayers have been documented before (Chou et al., 2002; Yamaguchi et al., 2001). The strongly β-sheet chemical shifts measured for the four 13C-labeled sites broadly support this hypothesis of a more ordered and possibly elongated β-sheet structure in the membrane.
Finally, we examine the validity of the approximation that the lipids and PG-1 have comparable  in Eqs. 1 and 2, which enables the comparison of their
  values. The typical Mn2+ electronic relaxation time is 3 × 10⁻⁹ s (Abragam, 1961; Tuzi et al., 2001) and the lipid rotational correlation times in the fully hydrated liquid-crystalline state is ∼1 ns. Our previous orientation study of PG-1 found the peptide to execute uniaxial motions in DLPC bilayers around the bilayer normal at a rate faster than 10−5 s, which averages the 15N and 13C chemical shift interaction (Yamaguchi et al., 2002). However, this rotation is likely to have a correlation time longer than nanoseconds. Thus, for PG-1, the
  term in Eq. 2 may be much smaller than the
  term, and thus may be neglected. There is no reason to assume the residence time of the Mn2+ ion to differ between the lipid and the peptide. Based on these approximations, we find that
  differs by a factor of 2.3 between the lipid and the peptide. This translates to a distance difference of ∼15%, due to the r6 dependence of
  in Eq. 1. Thus, the higher rigidity of PG-1 compared to the lipids would cause larger T2 relaxation enhancements even for comparable depths. This would underestimate the peptide distance from the membrane surface; however, this correction factor is small, only ∼15%.
These considerations show that a local thinning of DLPC bilayers at the PG-1 binding site is energetically possible, and would explain our depth data well. Because DLPC bilayers are relatively thin, the hydrophobic mismatch with PG-1 is not large, thus such local thinning may occur without significantly perturbing the 31P powder spectra from the axially symmetric lineshape (Yamaguchi et al., 2002). This thinning of DLPC bilayers could be the precursor to toroidal pores that have been proposed to form in the thicker POPC bilayers upon PG-1 insertion (Heller et al., 2000; Yamaguchi et al., 2002).
The shallow insertion of G2 and F12 residues in PG-1 at the membrane-water interface places the Arg residues close to the anionic phosphate groups and water. This is consistent with the “snorkeling model,” postulated for transmembrane peptides containing charged Arg and Lys residues (Segrest et al., 1990). The model states that it is energetically favorable to have the long hydrophobic side chains of Arg and Lys surrounded by the hydrophobic part of the bilayer and the positively charged chain ends solvated by the aqueous phase. A molecular dynamics simulation of a 17-residue α-helical cationic peptide in DMPC bilayers resulted in such a “snorkeling” of the guanidinium group of Arg residues, thus stabilizing the short helix in the DMPC bilayer (Sankararamakrishnan and Weinstein, 2000).
The use of Mn2+ paramagnetic dephasing as a probe for the immersion depth of membrane peptides is effective given a caveat. In general, low Mn2+ concentrations should be used to induce dipolar dephasing. This reduces resonance overlap of the lipid signals as well as retaining sufficient spectral sensitivity. Our study suggests that a Mn2+ concentration of 10–15 mol % is optimal. Use of low Mn2+ concentrations can also prevent the potential problem of charge repulsion between the cationic peptide side chains and the Mn2+ ions, which may perturb the orientation and depth of the peptides of interest. The lower charge of the divalent Mn2+ ion compared to trivalent lanthanide ions such as Dy3+ and Eu3+ thus provides an advantage in terms of minimizing perturbations to the membrane mixture.
Acknowledgments
The authors thank E. M. Johnson and M. McCormick for experimental assistance, and Professor K. Schmidt-Rohr for useful discussions.
This research is supported by the National Institutes of Health (grant GM-066976 to M.H., and grants AI-22839 and AI-37945 to A.W. and R.I.L.). M.H. would like to thank the Alfred P. Sloan Foundation for a research fellowship.
References
- Abragam, A. 1961. Principles of Nuclear Magnetism. Clarendon Press, Oxford.
- Altenbach, C., D. A. Greenhalgh, H. G. Khorana, and W. L. Hubbell. 1994. A collision gradient method to determine the immersion depth of nitroxides in lipid bilayers: application to spin-labeled mutants of bacteriorhodopsin. Proc. Natl. Acad. Sci. USA. 91:1667–1671. [DOI] [PMC free article] [PubMed] [Google Scholar]
- Altenbach, C., and J. Seelig. 1984. Ca2+ binding to phosphatidylcholine bilayers as studied by deuterium magnetic resonance. Evidence for the formation of a Ca2+ complex with two phospholipid molecules. Biochemistry. 23:3913–3920. [DOI] [PubMed] [Google Scholar]
- Aumelas, A., M. Mangoni, C. Roumestand, L. Chiche, E. Despaux, G. Grassy, B. Calas, and A. Chavanieu. 1996. Synthesis and solution structure of the antimicrobial peptide protegrin-1. Eur. J. Biochem. 237:575–583. [DOI] [PubMed] [Google Scholar]
- Bloembergen, N. 1957. Proton relaxation times in paramagnetic solutions. J. Chem. Phys. 27:572–573. [Google Scholar]
- Bodenhausen, G., R. Freeman, and D. L. Turner. 1977. Suppression of artifacts in two-dimensional spectroscopy. J. Magn. Reson. 27:511–514. [Google Scholar]
- Boni, L. T., T. P. Stewart, and S. W. Hui. 1984. Alterations in phospholipid polymorphism by polyethylene glycol. J. Membr. Biol. 80:91–104. [DOI] [PubMed] [Google Scholar]
- Brown, L. R., W. Braun, A. Kumar, and K. Wuthrich. 1982. High resolution nuclear magnetic resonance studies of the conformation and orientation of melittin bound to a lipid-water interface. Biophys. J. 37:319–328. [DOI] [PMC free article] [PubMed] [Google Scholar]
- Chou, J. J., J. D. Kaufman, S. J. Stahl, P. T. Wingfield, and A. Bax. 2002. Micelle-induced curvature in a water-insoluble HIV-1 Env peptide revealed by NMR dipolar coupling measurement in stretched polyacrylamide gel. J. Am. Chem. Soc. 124:2450–2451. [DOI] [PubMed] [Google Scholar]
- Cornell, B. A., L. E. Weir, and F. Separovic. 1988. The effect of gramicidin A on phospholipid bilayers. Eur. Biophys. J. 16:113–119. [DOI] [PubMed] [Google Scholar]
- Davis, J. H. 1986. The influence of membrane proteins on lipid dynamics. Chem. Phys. Lipids. 40:223–258. [DOI] [PubMed] [Google Scholar]
- Dwek, A. D. 1973. Nuclear Magnetic Resonance in Biochemistry: Applications to Enzyme Systems. Oxford University Press, London.
- Edidin, M. 2003. The state of lipid rafts: from model membranes to cells. Annu. Rev. Biophys. Biomol. Struct. 32:257–283. [DOI] [PubMed] [Google Scholar]
- Esposito, G., A. M. Lesk, H. Molinari, A. Motta, N. Niccolai, and A. Pastore. 1992. Probing protein structure by solvent perturbation of nuclear magnetic resonance spectra. Nuclear magnetic resonance spectral editing and topological mapping in proteins by paramagnetic relaxation filtering. J. Mol. Biol. 224:659–670. [DOI] [PubMed] [Google Scholar]
- Fahrner, R. L., T. Dieckmann, S. S. Harwig, R. I. Lehrer, D. Eisenberg, and J. Feigon. 1996. Solution structure of protegrin-1, a broad-spectrum antimicrobial peptide from porcine leukocytes. Chem. Biol. 3:543–550. [DOI] [PubMed] [Google Scholar]
- Franklin, J. C., J. F. Ellena, S. Jayasinghe, L. P. Kelsh, and D. S. Cafiso. 1994. Structure of micelle-associated alamethicin from 1H NMR. Evidence for conformational heterogeneity in a voltage-gated peptide. Biochemistry. 33:4036–4045. [DOI] [PubMed] [Google Scholar]
- Ge, M., and J. H. Freed. 1999. Electron-spin resonance study of aggregation of gramicidin in dipalmitoylphosphatidylcholine bilayers and hydrophobic mismatch. Biophys. J. 76:264–280. [DOI] [PMC free article] [PubMed] [Google Scholar]
- Grobner, G., C. Glaubitz, and A. Watts. 1999. Probing membrane surfaces and the location of membrane-embedded peptides by (13)C MAS NMR using lanthanide ions. J. Magn. Reson. 141:335–339. [DOI] [PubMed] [Google Scholar]
- Hancock, R. E., and R. Lehrer. 1998. Cationic peptides: a new source of antibiotics. Trends Biotechnol. 16:82–88. [DOI] [PubMed] [Google Scholar]
- Harzer, U., and B. Bechinger. 2000. Alignment of lysine-anchored membrane peptides under conditions of hydrophobic mismatch: a CD, 15N and 31P solid-state NMR spectroscopy investigation. Biochemistry. 39:13106–13114. [DOI] [PubMed] [Google Scholar]
- He, K., S. J. Ludtke, W. T. Heller, and H. W. Huang. 1996. Mechanism of alamethicin insertion into lipid bilayers. Biophys. J. 71:2669–2679. [DOI] [PMC free article] [PubMed] [Google Scholar]
- Heller, W. T., A. J. Waring, R. I. Lehrer, T. A. Harroun, T. M. Weiss, L. Yang, and H. W. Huang. 2000. Membrane-thinning effect of the b-sheet antimicrobial protegrin. Biochemistry. 39:139–145. [DOI] [PubMed] [Google Scholar]
- Huster, D., X. L. Yao, and M. Hong. 2002. Membrane protein topology probed by 1H spin diffusion from lipids using solid-state NMR spectroscopy. J. Am. Chem. Soc. 124:874–883. [DOI] [PubMed] [Google Scholar]
- Jacob, J., B. Baker, R. G. Bryant, and D. S. Cafiso. 1999. Distance estimates from paramagnetic enhancements of nuclear relaxation in linear and flexible model peptides. Biophys. J. 77:1086–1092. [DOI] [PMC free article] [PubMed] [Google Scholar]
- Janshoff, A., D. T. Bong, C. Steinem, J. E. Johnson, and M. R. Ghadiri. 1999. An animal virus-derived peptide switches membrane morphology: possible relevance to nodaviral transfection processes. Biochemistry. 38:5328–5336. [DOI] [PubMed] [Google Scholar]
- Kokryakov, V. N., S. S. Harwig, E. A. Panyutich, A. A. Shevchenko, G. M. Aleshina, O. V. Shamova, H. A. Korneva, and R. I. Lehrer. 1993. Protegrins: leukocyte antimicrobial peptides that combine features of corticostatic defensins and tachyplesins. FEBS Lett. 327:231–236. [DOI] [PubMed] [Google Scholar]
- Kumashiro, K. K., K. Schmidt-Rohr, O. J. Murphy, K. L. Ouellette, W. A. Cramer, and L. K. Thompson. 1998. A novel tool for probing membrane protein structure: solid-state NMR with proton spin diffusion and X-nucleus detection. J. Am. Chem. Soc. 120:5043–5051. [Google Scholar]
- Lakey, J. H., D. Duche, J. Gonzalez-Manas, D. Baty, and F. Pattus. 1993. Fluorescence energy transfer distance measurements: the hydrophobic helical hairpin of colicin A in the membrane-bound state. J. Mol. Biol. 230:1055–1067. [DOI] [PubMed] [Google Scholar]
- Lehrmann, R., and J. Seelig. 1994. Adsorption of Ca2+ and La3+ to bilayer membranes: measurement of the adsorption enthalpy and binding constant with titration calorimetry. Biochim. Biophys. Acta. 1189:89–95. [DOI] [PubMed] [Google Scholar]
- Ludtke, S. J., K. He, W. T. Heller, T. A. Harroun, L. Yang, and H. W. Huang. 1996. Membrane pores induced by magainin. Biochemistry. 35:13723–13728. [DOI] [PubMed] [Google Scholar]
- McIntosh, T. J., and S. A. Simon. 1994. Hydration and steric pressures between phospholipid bilayers. Annu. Rev. Biophys. Biomol. Struct. 23:27–51. [DOI] [PubMed] [Google Scholar]
- Ogawa, Y., W. Hahn, P. Garnier, N. Higashi, D. Massotte, M. Metz-Boutigue, B. Rousseau, J. Sunamoto, G. Ourisson, and Y. Nakatani. 2001. Mid-membrane photolabeling of the transmembrane domain of glycophorin A in phospholipid vesicles. Angew. Chem. Int. Ed. 40:944–946. [DOI] [PubMed] [Google Scholar]
- Papavoine, C. H., R. N. Konings, C. W. Hilbers, and F. J. vandeVen. 1994. Location of M13 coat protein in sodium dodecyl sulfate micelles as determined by NMR. Biochemistry. 33:12990–12997. [DOI] [PubMed] [Google Scholar]
- Peters, J. A., J. Huskens, and D. J. Raber. 1995. Lanthanide induced shifts and relaxation rate enhancements. Progress in NMR Spectroscopy. 28:283–350. [Google Scholar]
- Pouny, Y., D. Rapaport, A. Mor, P. Nicolas, and Y. Shai. 1992. Interaction of antimicrobial dermaseptin and its fluorescently labeled analogues with phospholipid membranes. Biochemistry. 31:12416–12423. [DOI] [PubMed] [Google Scholar]
- Prosser, R. S., P. A. Luchette, and P. W. Westerman. 2000. Using O2 to probe membrane immersion depth by 19F NMR. Proc. Natl. Acad. Sci. USA. 97:9967–9971. [DOI] [PMC free article] [PubMed] [Google Scholar]
- Prosser, R. S., P. A. Luchette, P. W. Westerman, A. Rozek, and R. E. W. Hancock. 2001. Determination of membrane immersion depth with O2: a high-pressure 19F NMR study. Biophys. J. 80:1406–1416. [DOI] [PMC free article] [PubMed] [Google Scholar]
- Sankararamakrishnan, R., and H. Weinstein. 2000. Molecular dynamics simulations predict a tilted orientation for the helical region of dynorphin A(1–17) in dimyristoylphosphatidylcholine bilayers. Biophys. J. 79:2331–2344. [DOI] [PMC free article] [PubMed] [Google Scholar]
- Segrest, J. P., H. De Loof, J. G. Dohlman, C. G. Brouillette, and G. M. Anantharamaiah. 1990. Amphipathic helix motif: classes and properties. Proteins. 8:103–117. [DOI] [PubMed] [Google Scholar]
- Shin, Y., C. Levinthal, F. Levinthal, and W. L. Hubbell. 1993. Colicin E1 binding to membranes: time-resolved studies of spin-labeled mutants. Science. 259:960–963. [DOI] [PubMed] [Google Scholar]
- Solomon, I. 1955. Relaxation processes in a system of two spins. Phys. Rev. 99:559–565. [Google Scholar]
- Steinberg, D. A., M. A. Hurst, C. A. Fujii, A. H. C. Kung, J. F. Ho, F. C. Cheng, D. J. Loury, and J. C. Fiddes. 1997. Protegrin-1: a broad-spectrum, rapidly microbicidal peptide with in vivo activity. Antimicrob. Agents Chemother. 41:1738–1742. [DOI] [PMC free article] [PubMed] [Google Scholar]
- Strandberg, E., S. Morein, D. T. S. Rijkers, R. M. J. Liskamp, P. C. A. vanderWel, and J. A. Killian. 2002. Lipid dependence of membrane anchoring properties and snorkeling behavior of aromatic and charged residues in transmembrane peptides. Biochemistry. 41:7190–7198. [DOI] [PubMed] [Google Scholar]
- Tamamura, H., T. Murakami, S. Horiuchi, K. Sugihara, A. Otaka, W. Takada, T. Ibuka, M. Waki, N. Yamamoto, and N. Fujii. 1995. Synthesis of protegrin-related peptides and their antibacterial and anti-human immunodeficiency virus activity. Chem. Pharm. Bull. 43:853–858. [DOI] [PubMed] [Google Scholar]
- Tuzi, S., J. Hasegawa, R. Kawaminami, A. Naito, and H. Saito. 2001. Regio-selective detection of dynamic structure of transmembrane alpha-helices as revealed from (13)C NMR spectra of [3–13C]Ala-labeled bacteriorhodopsin in the presence of Mn2+ ion. Biophys. J. 81:425–434. [DOI] [PMC free article] [PubMed] [Google Scholar]
- Villalain, J. 1996. Location of cholesterol in model membranes by magic-angle-sample-spinning NMR. Eur. J. Biochem. 241:586–593. [DOI] [PubMed] [Google Scholar]
- White, S. H., and W. C. Wimley. 1999. Membrane protein folding and stability: physical principles. Annu. Rev. Biophys. Biomol. Struct. 28:319–365. [DOI] [PubMed] [Google Scholar]
- Wiener, M. C., and S. H. White. 1992. Structure of a fluid DOPC bilayer determined by joint refinement of x-ray and neutron diffraction data. III. Complete structure. Biophys. J. 61:434–447. [DOI] [PMC free article] [PubMed] [Google Scholar]
- Wishart, D. S., C. G. Bigam, A. Holm, R. S. Hodges, and B. D. Sykes. 1995. 1H, 13C and 15N random coil NMR chemical shifts of the common amino acids. I. Investigations of nearest neighbor effects. J. Biomol. NMR. 5:67–81. [DOI] [PubMed] [Google Scholar]
- Wu, C. H., A. Ramamoorthy, and S. J. Opella. 1994. High-resolution heteronuclear dipolar solid-state NMR spectroscopy. J. Magn. Reson. A. 109:270–272. [Google Scholar]
- Yamaguchi, S., D. Huster, A. Waring, R. I. Lehrer, B. F. Tack, W. Kearney, and M. Hong. 2001. Orientation and dynamics of an antimicrobial peptide in the lipid bilayer by solid-state NMR. Biophys. J. 81:2203–2214. [DOI] [PMC free article] [PubMed] [Google Scholar]
- Yamaguchi, S., A. Waring, T. Hong, R. Lehrer, and M. Hong. 2002. Solid-state NMR investigations of peptide-lipid interaction and orientation of a b-sheet antimicrobial peptide, protegrin. Biochemistry. 41:9852–9862. [DOI] [PubMed] [Google Scholar]