

Abstract
In the recently solved structure of TMR-modified ADP-G-actin, the nucleotide cleft is in a closed state conformation, and the D-loop contains an α-helix (L. R. Otterbein, P. Graceffa, and R. Dominguez, 2001, Science, 293:708–711). Subsequently, questions were raised regarding the possible role of the TMR label on Cys374 in determining these aspects of G-actin structure. We show here that the susceptibility of D-loop on G-actin to subtilisin cleavage, and ATP/ADP-dependent changes in this cleavage, are not affected by TMR-labeling of actin. The TMR modification inhibits nucleotide exchange, but has no effect on DNase I binding and the fast phase of tryptic digestion of actin. These results show an absence of allosteric effects of TMR on subdomain 2, while confirming ATP/ADP-dependent changes in D-loop structure. In conjunction with similar results obtained on actin-gelsolin segment 1 complex, this works reveals the limitations of solution methods in probing the putative open and closed nucleotide cleft states of G-actin.
INTRODUCTION
It is well recognized that the actin molecule undergoes significant conformational rearrangements during ATP hydrolysis and after the release of inorganic phosphate. However, the details of such conformational changes are not well established. By analogy with other proteins from the actin-fold family (Flaherty et al., 1991; Bennett and Steitz, 1980), it has been proposed that the G-actin molecule can exist in two different conformations—with an open and closed nucleotide-binding cleft. A comparison of two profilin-actin crystal structures (Schutt et al., 1993; Chik et al., 1996) supported this supposition and showed that the major domains of actin can rotate with respect to one another by nearly 10°, resulting in the opening of the nucleotide-binding cleft and an ∼25% increase in solvent accessibility of the bound nucleotide (Chik et al., 1996).
Several approaches of solution biochemistry indirectly indicated that the transition from the ATP- to ADP-G-actin involves the opening of the nucleotide cleft on actin. Thus, significantly faster rates of ADP compared to ATP release, in both Ca2+ and Mg2+ states of G-actin (Kinosian et al., 1993), suggest a more open conformation of the nucleotide cleft in ADP-G-actin. The binding of DNase I to the interface between subdomains 2 and 4 of actin favors a closed cleft conformation (Polzar et al., 1989; Kabsch et al., 1990). Therefore, lower affinity of DNase I to ADP-G-actin compared to ATP-G-actin (Schuler et al., 2000b) correlates with the proposed states of the nucleotide cleft. In addition, the susceptibility of the cleft region of subdomain 2 (residues Arg62 and Lys68) to trypsin is higher in ADP-G-actin, suggesting a less protected, and apparently more open, conformation of this actin than that of ATP-G-actin (Strzelecka-Golaszewska et al., 1993). In F-actin, electron microscopy reconstructions of filaments by Egelman's group (Belmont et al., 1999) also suggested a more open conformation for ADP-F-actin than for ADP-BeFx-F-actin, which is recognized as a stable structural analog of ADP-Pior ATP-actin.
In view of these data, Sablin et al. (2002) questioned the origin of the closed nucleotide cleft conformation in the recently published structure of TMR modified (on Cys374) ADP-G-actin (Otterbein et al., 2001). These authors suggested that the closed conformation of the TMR-actin stems from label intercalation between subdomains 1 and 3. A similar mechanism was also suggested for the actin cleft closure by gelsolin-S1. To test this supposition, we compared the properties of TMR-labeled actin, unlabeled actin, and actin-gelsolin-S1 complex using several assays, believed to be sensitive to the nucleotide cleft conformation. These included the measurements of nucleotide exchange rates, collisional quenching of the bound nucleotide, affinity of actin to DNase I, and the proteolytic susceptibility of the subdomain 2 region to trypsin. Our results do not yield a uniform description of changes in the cleft state (open or closed) in TMR-actin and actin-gelsolin-S1 complex. Thus, it is possible that the above methods monitor local conformational changes, rather than reporting on the open-closed transitions of the cleft.
In the atomic structure of ADP-TMR-actin, the DNase I-binding loop is in an α-helical conformation (Otterbein et al., 2001), in contrast to its disordered or β-sheet conformation in several ATP-actin structures. It has been proposed that this α-helical structure of D-loop results from either allosteric changes due to TMR-labeling of Cys374 (Egelman, 2001), or from actin contacts in the crystal (Sablin et al., 2002). To test whether TMR modification of Cys374 or ADP bound in the nucleotide cleft are responsible for the observed conformational shifts within subdomain 2, we probed the conformation of the DNase I-binding loop on actin by subtilisin. We compared the digestions of unmodified and modified actins in the ADP and ATP states. We found that the TMR-labeling of actin did not result in any significant changes in the susceptibility of the DNase I-binding loop to digestion by subtilisin under different nucleotide-cation conditions. Our results suggest that the TMR probe does not change significantly the conformation of the DNase I-binding loop, at least in terms of its susceptibility to subtilisin, and does not prevent the conformational rearrangement of this loop by ATP and ADP.
MATERIALS AND METHODS
Reagents
TMR, ɛ-ATP, and ɛ-ADP were obtained from Molecular Probes (Junction City, OR). Subtilisin (Type VIII bacterial protease), diphenyl-carbamoyl chloride-treated trypsin, hexokinase, ATP, ADP phenylmethylsulfonyl fluoride, EGTA, and double-stranded DNA from calf thymus were purchased from Sigma Chemical (St. Louis, MO). DNase I was purchased from Worthington Biochemical (Lakewood, NJ). DTT and HEPES were from Merck (Darmstadt, Germany). PD-10 gel filtration columns were purchased from Amersham Pharmacia Biotech (Uppsala, Sweden). Millipore-filtered water and analytical grade reagents were used in all experiments.
Proteins
Actin from rabbit back muscle was prepared according to Spudich and Watt (1971). Recombinant human gelsolin-S1 was expressed in Escherichia coli and purified as described in Goldsmith et al. (2001). Protein concentrations were determined from their absorption by assuming A (1%) at 290 nm of 11.5 cm−1 for actin, and A (1%) at 280 nm of 14.3 cm−1 and 11.1 cm−1 for gelsolin-S1 and DNase I, respectively. Molecular masses were assumed to be 42.3 kDa for actin, 14.2 kDa for gelsolin-S1, and 31 kDa for DNase I.
Preparation of various forms of actin
Cys374 TMR modification of actin was performed according to the protocol of Otterbein et al. (2001), with minor modifications. Briefly, G-actin (7–9 mg/ml) was incubated for 1 h in the presence of 10 mM DTT. Actin was passed then two times through PD-10 columns to remove DTT and was incubated overnight with a two molar excess of TMR. The labeling reaction was stopped with 2 mM DTT. The unlabeled actin was removed from this preparation by polymerizing it with 2 mM MgCl2 (for 45 min, at room temperature) and pelleting at 150,000 × g. The TMR-labeled actin remaining in the supernatant was transferred to the G-buffer (0.2 mM ATP, 0.2 mM CaCl2, 1 mM DTT, and 5 mM HEPES/NaOH, pH 7.5) by passing it through a PD-10 column preequilibrated with this buffer. The labeled and unlabeled actin were stored in the G-buffer.
Mg-ADP-G-actin was prepared essentially as in Gershman et al. (1989), with slight modifications. Ca-ATP-G-actin was passed through a PD-10 gel filtration column equilibrated with 0.4 mM EGTA, 50 μM MgCl2, 0.5 mM ADP, 1 mM DTT, and 5 mM HEPES, pH 7.5. Actin was supplemented with 8 units/ml hexokinase and 1 mM D-glucose, and incubated at 4°C for 2 h to ensure complete nucleotide exchange in TMR-actin. Ca-ADP-G-actin was prepared from Ca-ADP-F-actin as previously described (Kinosian et al., 1993). Mg-ATP- and Mg-ADP-G-actin with two and three residues truncated from the C-terminus were prepared as described before (Strzelecka-Golaszewska et al., 1995).
Proteolytic digestions
All digestions of actin (5.0 μM) were carried out at 25°C; other conditions are specified in the figure legends. Aliquots were removed from reaction mixtures at the desired time points, and the digestions were terminated with either 2.0 mM PMSF or with 1 μM soybean trypsin inhibitor, for subtilisin and tryptic digestions, respectively. These reaction aliquots were analyzed by SDS-PAGE.
Fluorescence measurements
All fluorescence measurements were made in a PTI spectrofluorometer (Photon Technology Industries, South Brunswick, NJ). Measurements of ɛ-ATP and ɛ-ADP release and their quenching by nitromethane were performed with the excitation and emission wavelengths set at 350 nm and 412 nm, respectively.
Nucleotide release measurements
The rate of nucleotide exchange in G-actin was observed by monitoring the decay or rise in fluorescence upon release or binding of etheno-nucleotides (ɛ-ATP and ɛ-ADP) to actin at 20°C. Excess ATP was removed from monomeric actin by gel-filtration on a PD-10 column, after which the protein was supplemented with a 10- to 20-fold molar excess of the corresponding etheno-nucleotide. For ɛ-ADP-actin preparations, 1 mM glucose and 8 units/ml hexokinase were added at this stage. After incubation for 1 h on ice, the actin was gel-filtrated on a PD-10 column for transfer into the G-buffer containing 10 μM of the desired etheno-nucleotide (instead of ATP). The release of nucleotides from the nucleotide-binding cleft on actin was monitored after addition of 20-fold molar excess of ATP over etheno-nucleotide in G-actin, or after addition of a 20-fold excess of ɛ-ATP to ATP- and ADP-G-actin.
Collisional quenching measurements
ɛ-ATP and ɛ-ADP actins used in collisional quenching experiments were prepared in the same way as for the nucleotide exchange experiments, except that the final buffer did not contain any free nucleotide. To avoid nitromethane-induced oligomerization of Mg-ɛ-ATP-actin and prevent leakage of ɛ-ADP from actin, quenching experiments were performed with 10 μM actin at 10°C and were completed within 10 min from the beginning of the nitromethane titrations. The titrations were done in 10 mM increments, up to a final concentration of 100 mM nitromethane. No oligomers were produced under such conditions as confirmed by 1), rapid and complete etheno-nucleotide release from actin upon addition of a 20-fold molar ATP excess at the end of each titration; and 2), analytical ultracentrifugation of actin under similar conditions. The quenching data were analyzed by Stern-Volmer plots (Ando and Asai, 1980).
Electrophoresis
SDS-PAGE on 10% gel slabs was performed according to Laemmli (1970). Gels with TMR-actin were visualized under UV light in Alpha-Imager (Alpha Innotech, San Leandro, CA) to reveal the TMR-label, and then stained with Coomassie blue R-250 to reveal the total protein. The stained gels were scanned in a Scan Premio ST scanner and quantified using the Sigma-Gel software (Jandel Scientific, Chicago, IL).
DNase I inhibition assay
The DNase I binding to actin was measured by DNase I inhibition assay as previously described (Schuler et al., 2000a).
RESULTS
TMR modification of Cys374 inhibits nucleotide release from G-actin
The crystal structure of TMR-actin with the bound ADP shows the nucleotide-binding cleft in a closed conformation (Otterbein et al., 2001). This is in contrast with interpretations of solution studies which suggest that ADP-G-actin adopts an open cleft conformation (Kinosian et al., 1993; Strzelecka-Golaszewska, 2001; Schuler et al., 2000b). To test whether TMR modification of Cys374 affects the cleft conformation, we measured the rates of nucleotide release from intact and TMR-modified actin in the ATP- and ADP-G-actin (Fig. 1). Nucleotide exchange rates were measured by following the increase in ɛ-ATP and ɛ-ADP fluorescence upon their binding, and a signal decrease upon their release from the nucleotide-binding site on actin.
FIGURE 1.
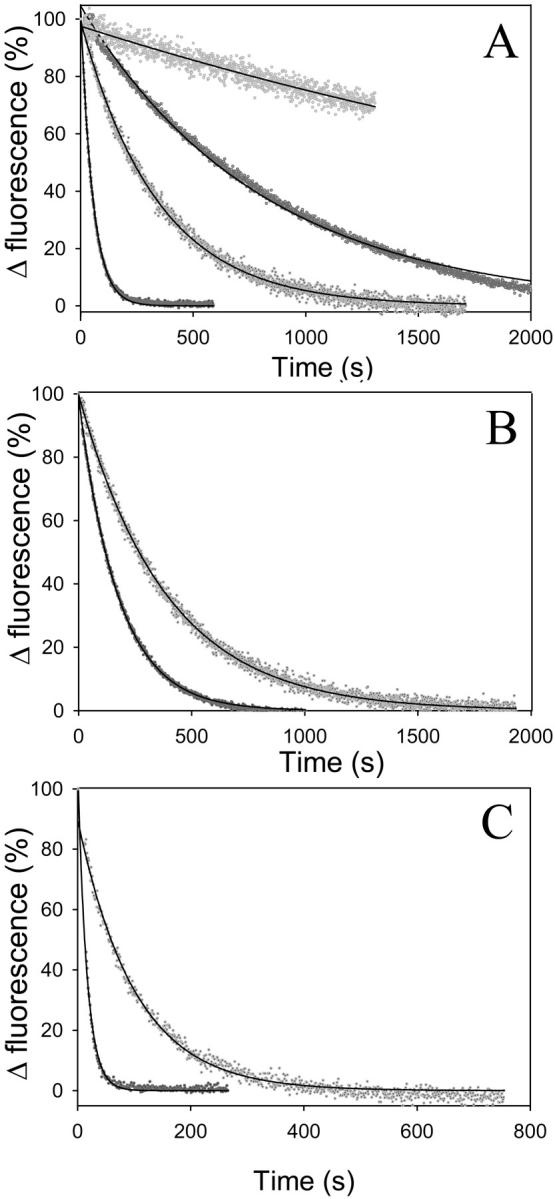
Nucleotide release from TMR-labeled and unlabeled actin. The release of Ca-ɛ-ATP (A), Mg-ɛ-ATP (B) and Mg-ɛ-ADP (C) from 2.0 μM actin (5.0 μM ɛ-ATP or ɛ-ADP) was initiated by the addition of 100 μM ATP. Etheno-nucleotide off-rates were monitored via fluorescence decay due to ɛ-ATP or ɛ-ADP release from the nucleotide cleft of G-actin into the medium. The dots represent normalized experimental data (TMR-actin, gray; unlabeled actin, black); the solid lines show the single exponential descriptions of these data. The mean values of ɛ-ATP (k-ɛ-ATP) and ɛ-ADP (k-ɛ-ADP) release rates obtained in this way are listed in Table 1. Fluorescence intensities of etheno-nucleotides bound to TMR-actin were quenched by ∼60% due to energy transfer to the TMR label. Two different Ca2+ concentrations—25 μM (two lower curves) and 125 μM (two upper curves)—were used in (A) to show similar TMR-induced inhibition of nucleotide release under different conditions (see text).
Nucleotide release rates from actin depend on the nature of the divalent cation (Ca2+ or Mg2+) and nucleotide (ATP or ADP) bound at the high affinity site (for review see Gershman et al., 1994). We found that TMR-labeling of actin inhibited etheno-nucleotide release and its incorporation under all conditions tested (Fig. 1, A–C; Table 1). TMR-actin showed more than sixfold smaller rates of nucleotide exchange (k-ɛ-ATP and k-ATP) compared to control actin in the Ca-ATP state, and about a twofold lower rate in the Mg-ATP state (Fig. 1; Table 1). The modification of actin by TMR slowed also about six- to sevenfold the nucleotide exchange rates in Mg-ADP-G-actin (Table 1).
TABLE 1.
Nucleotide exchange rates in TMR-labeled and unlabeled actin under different nucleotide-cation conditions
|
k-ɛ-ATP or k-ɛ-ADP(s−1)
|
k-ATP or k-ADP(s−1)
|
||||||
|---|---|---|---|---|---|---|---|
| Nucleotide-cation | Unlabeled actin | TMR-actin | Unlabeled/TMR | Unlabeled actin | TMR-actin | Unlabeled/TMR | |
| ATP | Ca(1)* | 0.019† | 0.0029 | 6.6 ± 0.3 | 0.017 | 0.0025 | 6.9 ± 0.5 |
| Ca(2) | 0.0017 | 0.00026 | 6.5 ± 0.6 | ||||
| Mg | 0.0058 | 0.0024 | 2.4 ± 0.2 | 0.005 | 0.0021 | 2.4 ± 0.4 | |
| ADP | Mg | 0.056 | 0.0088 | 6.4 ± 0.4 | 0.028 | 0.0041 | 6.8 ± 0.7 |
Two different Ca2+ concentrations—25 μM and 125 μM—are referred as Ca(1) and Ca(2), respectively.
The exchange rates are the average of at least three determinations. Standard deviations are given next to the rate ratios.
It has been shown before that at relatively low concentrations of divalent cation the dissociation of nucleotide from G-actin is rate-limited by the dissociation of divalent cation from its high affinity site on actin (Kinosian et al., 1993). When the divalent cation dissociates from actin, the affinity of actin for nucleotide is greatly reduced (Waechter and Engel, 1975). At high concentrations of cations, the nucleotide dissociation apparently corresponds to that of the cation-nucleotide complex. Thus, the rate of nucleotide release from actin depends on the concentration of free Ca2+ or Mg2+ cation in solution. As expected, an increase in the free Ca2+ concentration resulted in a decrease in the nucleotide exchange rate (Fig. 1 A). Under these conditions, both the unlabeled and TMR-labeled actin exchange ɛ-ATP at ∼10-fold slower rates than at low Ca2+ concentrations, but the ratio of their ɛ-ATP exchange rates (kactin/kTMR-actin) remains ∼6.5 (Fig. 1 A; Table 1).
TMR-actin affinity to DNase I is similar to that of unlabeled actin
The affinity of G-actin to DNase I was shown to depend on the nucleotide and divalent cation bound to actin (Schuler et al., 2000b), presumably correlating with the conformation of the nucleotide cleft. The affinity of these two proteins for each other can be measured by monitoring the inhibition of DNase I activity by actin (Schuler et al., 2000b). We compared in this way the binding of TMR-actin and unlabeled actin to DNase I and found them to be very similar both in the Mg-ATP (Kd equal to 0.59 ± 0.07 and 0.67 ± 0.07 nM, respectively) and Mg-ADP G-actin (Kd = 1.68 ± 0.12 and 1.55 ± 0.11 nM, respectively).
Gelsolin-S1 abolishes ATP/ADP exchange for both Ca- and Mg-G-actin but does not affect the accessibility of the bound nucleotide to collisional quenchers
The N-terminal 14-kDa fragment of gelsolin (gelsolin-S1) binds to actin at the interface between subdomains 1 and 3 (McLaughlin et al., 1993). It has been suggested that the intercalation of TMR group and gelsolin-S1 between subdomains 1 and 3 of actin may have a similar effect on the stabilization of the closed conformation of actin (Sablin et al., 2002). Since opening the cleft by the clamshell-like mechanism (for review, see Schuler, 2001) involves motions in the shear and hinge regions of actin, between subdomains 1 and 3, the above intercalation may restrain such an opening of the nucleotide cleft (Sablin et al., 2002) and, consequently, inhibit the rate of nucleotide release. Indeed, it has been shown that the binding of gelsolin-S1 to G-actin abolishes ɛ-ATP exchange in the presence of a Ca2+/Mg2+ cation mixture (Bryan, 1988). Under these conditions, the high affinity cation binding site is occupied predominantly by Ca2+ (Kinosian et al., 1993), whereas the physiologically relevant high affinity cation is Mg2+ (Kitazawa et al., 1982). Thus, we reexamined here the effect of gelsolin-S1 on nucleotide exchange in other G-actin states. Under all conditions (Ca-ATP, Mg-ATP, and Mg-ADP), gelsolin-S1 effectively blocked the exchange of nucleotides (Fig. 2, Mg-ATP data are not shown). Therefore, our data suggest that gelsolin-S1 abolishes nucleotide exchange on actin, irrespective of its nucleotide-divalent cation state.
FIGURE 2.

Nucleotide exchange inhibition by gelsolin-S1. Nucleotide exchange in the gelsolin-S1 complex with Ca-ATP-actin (A) and Mg-ADP-actin (B) was monitored via changes in fluorescence intensity upon ɛ-nucleotide release from, or incorporation into, the nucleotide-binding cleft on actin. 100 μM ɛ-ATP (A) or ɛ-ADP (B) was added at the zero time to 2.0 μM actin in 10 mM HEPES buffer, at pH 7.5, containing 1 mM DTT, and either 30 μM CaCl2 and 5.0 μM ATP in A, or 30 μM MgCl2 and 5.0 μM ADP in B. Etheno-nucleotide release was initiated by the addition of 1.0 mM ATP (marked by arrowheads above curves a and b). Curve a, data in gray; no gelsolin-S1 present. Curve b, data in black; 4.0 μM gelsolin-S1 was added to this sample after the fluorescence increase due to etheno-nucleotide incorporation reached a plateau (indicated by the arrow). Curve c, data in dark gray; 4.0 μM gelsolin-S1 was added 5 min before the addition of ɛ-ATP or ɛ-ADP to G-actin (at the zero time). In all cases nucleotide exchange was abolished in the presence of gelsolin-S1.
Collisional quenching of the bound ɛ-ATP by nitromethane was very similar for the two cation states of actin, yielding the Stern-Volmer coefficients Ksv = 1.37 ± 0.1 and 1.30 ± 0.15 for the Mg- and Ca-ATP-G-actin, respectively. In contrast to its strong inhibition of nucleotide release from actin, gelsolin-S1 had virtually no effect on the accessibility of ɛ-ATP to this collisional quencher (Ksv = 1.45 ± 0.15 and 1.33 ± 0.06 M−1 for Ca- and Mg-ɛ-ATP, respectively). Moreover, gelsolin-S1 had also no effect on the quenching of Mg-ɛ-ADP on actin (Ksv = 2.2 ± 0.2 M−1).
TMR modification does not affect the digestion of actin by subtilisin
In the atomic structure of ADP-TMR-actin, the D-loop is in an α-helical conformation (Otterbein et al., 2001), in contrast to its disordered or β-sheet conformation in several ATP-actin structures. This difference between TMR-actin and other actin structures, if attributed to their different nucleotide states, correlates well with the observed protection of the D-loop in G-actin from subtilisin cleavage when ATP is replaced with ADP (Strzelecka-Golaszewska et al., 1993). However, it has been proposed also that the α-helical D-loop structure results from allosteric changes due to TMR-labeling of Cys374 rather than from ADP substitution for ATP on G-actin (Egelman, 2001). Such a possibility is indicated by the well-documented conformational coupling between subdomains 1 and 2 on actin (DalleDonne et al., 1999; Strzelecka-Golaszewska et al., 1993; Kuznetsova et al., 1996; Kim and Reisler, 1996, 2000). To test whether TMR modification of Cys374 might be responsible for a change in D-loop structure, we used subtilisin cleavage as a conformation-sensitive probe of this loop, and compared the digestions of unmodified and modified actins in the ADP and ATP states.
Subtilisin digestions of TMR-modified and unmodified actin were monitored by SDS-PAGE (Fig. 3 A). The rates of actin cleavage were determined from the time-dependent decrease in the intensity of intact actin (upper band in Figs. 3 and 4), which in all cases followed a single exponential process (Fig. 3 B) and yielded the first-order rate constants. The digestions of unlabeled and TMR-labeled Ca-ATP-G-actin were very similar (Fig. 3), with the ratio of their corresponding cleavage rates kTMR/kControl = 0.92 ± 0.15 (n = 5). The replacement of Ca2+ with Mg2+ does not result in any significant changes in the subtilisin digestion of either TMR-actin (data not shown) or the unlabeled actin. The digestion rates of TMR-actin and control actin in the Mg-ADP state were also very similar (kTMR/kControl = 0.96 ± 0.11; n = 3); both rates were about threefold slower than the corresponding digestion rates of ATP-actin.
FIGURE 3.

Subtilisin digestion of TMR-labeled and unlabeled actin. TMR-labeled and unlabeled G-actin were cleaved by subtilisin at an enzyme/protein mass ratio of 1:1670 at 25°C. (A) Representative Coomassie blue stained polyacrylamide gel of Ca-ATP-TMR-actin digestion. Times of digestion (in minutes) are indicated under the protein bands. The upper bands correspond to intact actin; lower bands correspond to the 35-kDa fragment of actin. (B) Semilogarithmic plots of TMR-labeled and unlabeled actin cleavage by subtilisin. SDS-PAGE patterns were analyzed, and the decreasing densities of intact actin bands were plotted versus time of digestion. All data fitted well to a single exponential expression (solid black lines in semilogarithmic plots), yielding the first-order rate constants for the digestion reaction. The rates of cleavage were 2.1 and 1.8 s−1 for Ca-ATP-G-actin (closed circles) and Ca-ATP-TMR-G-actin (open circles), respectively; and 0.63 and 0.6 s−1 for Mg-ADP-G-actin (closed triangles) and Mg-ADP-TMR-G-actin (open triangles), respectively. Although the individual cleavage rates varied somewhat in several independent experiments, the ratios of these rates were highly reproducible (see text). Other conditions were as described in the Materials and Methods section.
FIGURE 4.

Effect of TMR and gelsolin-S1 on the cleavage of Ca-ATP-actin by trypsin. 5.0 μM Ca-ATP unlabeled G-actin (closed circles), TMR-actin (open circles), and actin-gelsolin-S1 complex (closed triangles) were digested by trypsin at an enzyme/protein mass ratio of 1:25 at 25°C. (A) Semilogarithmic plots of intact actin band decay as a function of digestion time. (Inset) Representative SDS-PAGE patterns of Ca-ATP-TMR-actin digestion by trypsin stained for total protein with Coomassie blue (a, upper image), and visualized under UV light to reveal the TMR label (b, lower image). Note that the TMR label remains attached to both intact actin and its 33-kDa fragment throughout the entire course of digestion. Gelsolin-S1 was not cleaved by trypsin during the time of this experiment. (B) Accumulation of the 33-kDa actin fragment as a function of the intact actin band decay. Relative amounts of the 33-kDa fragment were corrected for the 18% difference in the molecular weights between this fragment and intact actin. The linear relationship indicates a cleavage of intact actin into the 33-kDa fragment, without a significant degradation of this fragment to smaller products.
Tryptic digestions of Ca-ATP-G-actin
The digestion of ATP-G-actin by trypsin at Arg62 and Lys68 within subdomain 2 was shown to be strongly inhibited by the replacement of the high affinity Ca2+ with Mg2+ (Strzelecka-Golaszewska et al., 1993). The exchange of ATP for ADP in Mg-G-actin abolished this cleavage inhibition. It has been suggested that these changes in the susceptibility of Arg62 and Lys68 to tryptic cleavage are correlated with a transition between the open and closed states of the nucleotide cleft that was observed in profilin-actin crystals (Schutt et al., 1993; Chik et al., 1996). If this interpretation is correct, and assuming that the inhibition of nucleotide exchange by TMR-labeling and by gelsolin-S1 binding result from the cleft closure, we would expect a corresponding protection of subdomain 2 from tryptic digestion in these actins. To test this prediction, we performed tryptic digestions of TMR-G-actin and the actin-gelsolin-S1 complex. The cleavage rate of Ca-ATP-TMR-actin was virtually indistinguishable from that of control actin (kTMR/kControl = 1.19 ± 0.09; n = 3), whereas the digestion of Ca-ATP-G-actin complex with gelsolin-S1 was even faster (k+GS1/kControl = 1.6 ± 0.2; n = 3) (Fig. 4 A).
Because tryptic cleavage at the C-terminus of actin (resulting in the release of residues 374–375 or 373–375) is faster than that within subdomain 2 (Mossakowska et al., 1993; Strzelecka-Golaszewska et al., 1995), we tested the possible link between these two cleavage reactions. Digestions of Cys374-AEDANS-labeled actin did not reveal any protection of the C-terminus by gelsolin-S1 (data not shown). In contrast, the TMR label at Cys374 impeded the tryptic digestion at the C-terminus. This can be seen from comparing the decay of the fluorescent and Coomassie blue stained actin bands in Fig. 4 A. The presence of the TMR label on intact actin and on its 33-kDa fragment (apparent molecular weight) throughout the entire digestion course shows that little, if any, C-terminal cleavage occurs in the labeled protein. Clearly, the tryptic cleavage in subdomain 2 of G-actin is not necessarily coupled to the C-terminal cleavage. Gelsolin-S1 activates the former but has no effect on the latter, whereas the TMR label inhibits the latter but has no effect on subdomain 2 digestion in Ca-ATP-G-actin.
Mg-G-actin digestions with trypsin do not follow a first-order process
In contrast to Ca-ATP-G-actin cleavage by trypsin, the digestions of Mg-ATP- and Mg-ADP-G-actin could not be described by a single exponential process (Figs. 5 and 6), revealing a greater complexity of these reactions. Curves showing the decay of intact actin were described well by a two-exponential rate expression (solid lines on Figs. 5 A and 6 A), but the reactions are probably more complex. In the presence of Mg2+ (ATP or ADP), TMR-modified actin and actin-gelsolin-S1 complex were more susceptible to tryptic attack than control actin. However, double-exponential fits of these tryptic digestions show virtually the same fast cleavage rates (k1) for the Ca-ATP- and Mg-ATP-G-actin states (TMR or gelsolin-S1; Table 2). The overall faster digestions of TMR-actin and gelsolin-S1-actin complex were due to shifts in the amplitudes of the two cleavage phases and some acceleration of the second, slow phase of the reaction. Notably, also, the rate constants of the fast reaction in Mg-ATP-G-actin were similar to the rate constants of the Ca-ATP-G-actin digestion (Table 2). The fast cleavage step was severalfold faster in Mg-ADP-G-actin and very similar to the digestion rate of Ca-ADP-G-actin (Table 2). These results reveal that TMR-labeling of actin or gelsolin-S1 binding, which are proposed to promote the closed cleft state of actin (Sablin et al., 2002), do not produce the expected inhibition of Mg-ATP- and Mg-ADP-actin cleavage by trypsin. Instead, these reactions are accelerated by the increased rates of their slow phase component. This effect raises questions both about the possibility of allosteric effects on subdomain 2 due to Cys374 TMR-labeling and gelsolin-S1 binding, and/or the interpretation of the tryptic digestions of actin.
FIGURE 5.

Effect of TMR modification on the digestion of Mg-ATP and Mg-ADP-G-actin by trypsin. TMR-labeled (open symbols) and unlabeled (closed symbols) actin (5 μM) was digested by trypsin at 1:12.5 and 1:25 enzyme/protein mass ratios in the Mg-ATP (circles) and Mg-ADP (triangles) states, respectively. (A) Semilogarithmic plots of the time course of intact actin disappearance (on SDS-PAGE) in these digestion reactions. Solid lines show the fit of the intact actin decay data to a two-exponential rate expression. The corresponding cleavage rate constants, k1 and k2, and standard deviations of the cleavage rates, are given in Table 2. (B) Accumulation of the 33-kDa actin fragment as a function of cleavage time. (Inset) The data from B plotted as a function of the intact actin band decay. Note the correlation between the reduced accumulation (i.e., increased degradation) of the 33-kDa fragment and the increased inhibition of the intact actin band decay.
FIGURE 6.

Effect of gelsolin-S1 on tryptic digestion of Mg-ATP and Mg-ADP-G-actin. Actin (closed symbols) and gelsolin-S1–actin complex (open symbols) were digested by trypsin at an enzyme/protein mass ratios of 1:25 and 1:12.5 in Mg-ATP (circles) and Mg-ADP (triangles) states of actin (5.0 μM), respectively. (A) Time course of the intact actin band decay on SDS-PAGE. (B) Accumulation of the 33-kDa actin fragment as a function of digestion time. (Inset) The data from (B) plotted as a function of the intact actin band decay. Note that gelsolin-S1, like TMR-labeling (Fig. 5), significantly protects the 33-kDa actin fragment from degradation by trypsin. Symbols represent experimental data; solid lines show their fit to a two-exponential rate expression. The cleavage rate constants are listed in Table 2.
TABLE 2.
Rates of tryptic digestion of unlabeled actin, TMR-actin, and gelsolin-S1 complex under different nucleotide-cation conditions
| Condition | k1 (s−1)* | A1 (%)† | k2 (s−1) | A2 (%) | n‡ | |
|---|---|---|---|---|---|---|
| Ca2+-ATP | Control | 0.052 ± 0.013 | >90% | 6 | ||
| TMR-actin | 0.062 ± 0.016 | >90% | 3 | |||
| +GS1 | 0.083 ± 0.02 | >90% | 3 | |||
| Ca2+-ADP | Control | 0.26 ± 0.05 | >90% | 2 | ||
| Mg2+-ATP | Control | 0.054 ± 0.01 | 38.4 ± 8.5 | 0.0021 ± 0.0019 | 60.2 ± 14.5 | 9 |
| TMR-actin | 0.056 ± 0.01 | 46.6 ± 10.4 | 0.0078 ± 0.0016 | 52.4 ± 16.8 | 6 | |
| +GS1 | 0.057 ± 0.02 | 45.3 ± 16 | 0.0041 ± 0.0026 | 49.2 ± 14.1 | 6 | |
| Mg2+-ADP | Control | 0.23 ± 0.1 | 52.5 ± 21.5 | 0.011 ± 0.008 | 47.4 ± 21.5 | 6 |
| TMR-actin | 0.18 ± 0.03 | 82 ± 10 | 3 | |||
| +GS1 | 0.23 ± 0.03 | 31 ± 9 | 0.054 ± 0.018 | 76 ± 11 | 3 | |
k1 and k2 (mg of actin digested per mg of trypsin per second) were obtained from a single- or double-exponential description of experimental data.
A1 and A2, amplitudes (%) of the fast and slow phases of digestion reactions, respectively.
n, number of reaction repetitions.
Do tryptic digestions of Mg-G-actin reveal allosteric effects of gelsolin-S1 and actin labeling by TMR?
The complex kinetic profile of tryptic digestions of Mg-G-actin, which to a first approximation are described here by a two-exponential process, may be indicative of either the presence of several subpopulations of actin or the inhibition of tryptic activity over the course of this reaction. Accordingly, TMR-labeling and gelsolin-S1 may increase the tryptic susceptibility of the slowly cleaved actin population either by an allosteric mechanism or by slowing the inhibition of tryptic activity. The obvious sources of Mg-G-actin heterogeneity could be an incomplete exchange of Ca2+ to Mg2+ on G-actin and the presence of Mg-G-actin oligomers. Incomplete divalent cation exchange has been ruled out by using for that purpose different ratios of EGTA (between 50 and 200 μM) to Ca2+ (20 μM) and Mg2+ (50 and 100 μM), and observing in each case the same tryptic digestion patterns of Mg-G-actin. To avoid Mg-G-actin oligomers, the actin concentration (5 μM) was kept much below the critical concentration for oligomerization (∼12.5 μM (Attri et al., 1991)), and all experiments were completed within 1 h from the beginning of the Ca2+ to Mg2+ exchange. Moreover, preincubations of Mg-G-actin up to 1 h, at room temperature, before trypsin addition did not change the results of digestions, revealing little, if any, oligomer formation. Finally, sedimentation velocity experiments carried out with 10 μM Mg-ATP G-actin revealed also that actin oligomers, if present, were below our detection level (2–3%).
Another potential source of actin heterogeneity might be its rapid C-terminal cleavage by trypsin, if such a truncation alters the cleavage rate of subdomain 2. This possibility was ruled out by preparing the C-terminally truncated actin (with the last two or three residues removed) and observing that the digestions of such Mg-G-actin and intact actin were indistinguishable.
The alternative possibility, that the kinetic complexity of Mg-G-actin digestions arises from trypsin inhibition in these reactions, has been tested in two ways. In the first experiment, a fresh aliquot of intact actin was added to the tryptic digestion reaction of actin that has proceeded for 30 min. Virtually no digestion of the new actin was observed in this case (Fig. 7), showing a strong inhibition of the initial activity of trypsin. In a second experiment, trypsin was incubated for 30 min in the Mg-G-actin buffer, at which point actin was added to this solution. Although the overall extent of actin digestion appeared to be reduced somewhat by such trypsin preincubation, the cleavage reaction showed a similar kinetic profile to that of control actin digestion (Fig. 7). These experiments suggest that trypsin is progressively inhibited by the products of actin degradation. Such degradation is notable, in particular, in Mg-G-actin, for which a stable 33- to 35-kDa fragment does not accumulate as seen in the tryptic digestions of Ca-G-actin (Fig. 4 B). The degradation of this fragment by trypsin (without the appearance of other stable, smaller intermediates) is demonstrated in the plot monitoring the percentage of intact actin (band) converted to the 33-kDa fragment (Figs. 5 B and 6 B).
FIGURE 7.

Inactivation of trypsin in the course of Mg-ATP G-actin digestion. The decay of intact actin in Mg-ATP-G-actin (5.0 μM) digestion with trypsin. In all cases trypsin was added to actin (open and closed circles) or to Mg-G-actin buffer (triangles) at a 1/12.5 mass ratio of enzyme/protein. Aliquots (time points) of the cleavage reaction were analyzed on SDS-PAGE. (Closed circles) the progress of Mg-ATP-G-actin digestion. (Open circles) After 30 min of Mg-ATP-G-actin digestion, a single aliquot of the reaction was withdrawn (indicated by the arrow) to confirm its progress (by SDS-PAGE) and new (open circles), undigested Mg-ATP-G-actin (4.0 μM) was added to the digestion reaction. No cleavage of this actin was observed. (Closed triangles) Trypsin was preincubated for 30 min in the Mg-ATP-G-actin buffer; 5.0 μM fresh Mg-ATP-G-actin was added at this time to the solution of trypsin in G-actin buffer. Digestion aliquots of subsequent time points were analyzed on SDS-PAGE.
Irrespective of specific reasons for faster degradation of the 33-kDa actin fragment in Mg- than in Ca-G-actin, these differences make it difficult to correlate the rates of Mg- and Ca-G-actin tryptic cleavage with the closed and open cleft conformations. On the other hand, the stabilization of the 33-kDa actin fragment (by TMR-labeling and gelsolin-S1) against tryptic degradation correlates in most cases with the apparent acceleration of the slow phase of intact Mg-G-actin digestions (Table 2; Figs. 5 B and 6 B). If, indeed, as indicated by Fig. 7, actin degradation products inhibit the proteolytic activity of trypsin, then by slowing this process gelsolin-S1 and the TMR label can enhance the tryptic attack in subdomain 2 of actin. Thus, the tryptic digestion results can be rationalized without evoking allosteric changes in subdomain 2 due to gelsolin-S1 binding and TMR-labeling of actin. Nevertheless, it is plausible that the complex kinetic profile of tryptic digestions of G-actin results from a combination of factors, including trypsin inhibition and the presence of several subpopulations of actin states.
DISCUSSION
Three aspects of the crystal structure of the TMR-labeled ADP-G-actin (Otterbein et al., 2001) merit special attention. This is the first atomic structure of G-actin solved for this protein alone, without using actin-binding proteins to block the polymerization reaction. Importantly, except for the subdomain 2 region, this structure is remarkably similar to those solved earlier for ATP-G-actin bound to other proteins.
The second and most intriguing aspect of the TMR-ADP-G-actin structure is the α-helical conformation of its D-loop, which has not been observed in prior ATP-G-actin structures. If this loop indeed undergoes a disorder to α-helix transition between the ATP and ADP states of actin, the finding of Otterbein et al. (2001) would provide an elegant structural explanation for the ability of some actin-binding proteins to recognize the ATP and ADP actin states. However, the significance of the α-helical D-loop in TMR-ADP-G-actin has been questioned in recent publications. It has been suggested that this D-loop conformation may arise either from allosteric, long-range effects of TMR attachment to Cys374 or, alternatively, from the crystal packing contacts of the labeled actin (Sablin et al., 2002; Egelman, 2001).
The third, unexpected aspect of the TMR-ADP-G-actin structure is its closed nucleotide cleft conformation. Whereas all ATP-G-actin structures, with the exception of a single profilin-actin complex (Chik et al., 1996), have been solved in the closed nucleotide cleft state, it has been expected that this cleft would be open in the ADP-G-actin structure. Thus, the closed cleft state in the TMR-ADP-G-actin was attributed recently to the probe blocking the opening of the cleft (Sablin et al., 2002).
Because of the structural and functional importance of the last two aspects of TMR-ADP-G-actin structure, and in view of the questions raised about its interpretation, we examined here by solution methods the conformational states of TMR-G-actin and actin bound to gelsolin-S1.
The TMR modification does not affect nucleotide-induced conformational changes in the D-loop of actin
To test whether TMR modification might allosterically affect the conformation of the D-loop, we examined the subtilisin cleavage of labeled and unlabeled actin in their ATP and ADP states. Although the cleavage rates for ADP-actins were severalfold slower than those of ATP actins, we found no significant difference between the digestions of TMR-actin and unlabeled actin (Fig. 3). Similar to unlabeled actin cleavage (Strzelecka-Golaszewska et al., 1993), subtilisin digestion of TMR-ATP-actin was not sensitive to the exchange of Ca2+ for Mg2+. Therefore, our data suggest that the TMR-probe does not change the conformation of the D-loop, at least in terms of its susceptibility to subtilisin cleavage, and, moreover, does not prevent the nucleotide-dependent rearrangement of this loop.
Although these results do not identify the nature of D-loop transition upon ATP to ADP switch in G-actin, they, as well as the original results of Strzelecka-Golaszewska et al. (1993), are consistent with the TMR-G-actin structure (Otterbein et al., 2001). Any alternative interpretation of the D-loop structure in TMR-G-actin would still need to account for the different subtilisin cleavage of this loop in ATP- and ADP-G-actin.
The closed and open states of the nucleotide cleft in G-actin
To date, solution evidence linking the ATP- and ADP-G-actin to the closed and open nucleotide cleft states, respectively, has been indirect and open to alternative explanations. In general, the open actin conformation is believed to be associated with a faster nucleotide exchange, increased accessibility of etheno-nucleotides to collisional quenchers, increased susceptibility of Arg62 and Lys68 to trypsin, and a decreased DNase I binding. This is indeed observed for ADP-G-actin. Yet, it is possible that each of the above changes alone, but perhaps even collectively, might be caused by local conformational transitions, without an actual opening of the nucleotide cleft region. To test the predictive power of the solution approaches to probing the nucleotide cleft state in G-actin, we examined the G-actin–gelsolin-S1 complex. Whereas the expected closing of actin cleft (Sablin et al., 2002) was indicated by the complete inhibition of ɛ-ADP (and ɛ-ATP) exchange by gelsolin-S1, this protein had no effect on the collisional quenching of ɛ-ADP (and ɛ-ATP) and the fast phase of tryptic cleavage of ADP- and ATP-G-actin. In the absence of these other changes, the inhibition of nucleotide exchange is insufficient to indicate a shift between the open and closed states of G-actin due to gelsolin-S1 binding.
Similarly, solution methods do not provide conclusive evidence for the proposed “closing” of the nucleotide cleft by TMR-labeling of actin (Sablin et al., 2002). As in the case of gelsolin-S1, the inhibition of nucleotide exchange in TMR-actin (much smaller than in actin–gelsolin-S1) is not accompanied by other changes. Neither DNase I binding nor the fast phase of tryptic cleavage in subdomain 2 is altered by the TMR label. The lack of such changes strengthens the evidence discussed above against long-range allosteric effects of the TMR label on subdomain 2 in actin. It is more difficult to interpret these results in terms of the proposed cleft closure by TMR (Sablin et al., 2002), albeit our data do not support such a possibility.
The inadequacy of the available solution methods for testing the actin cleft states is indicated also by prior observations on the actin-profilin complex. Although profilin accelerates nucleotide exchange on G-actin, which would be consistent with the nucleotide cleft opening, it has no effect on DNase I binding to actin (Schuler et al., 2000a). The well-established faster release of ADP than ATP from G-actin does not necessarily show a more open conformation of ADP-actin. The γ-phosphate in ATP has a number of additional electrostatic interactions with actin, as compared to ADP, which should result in slower nucleotide release. The same also may be true for Mg2+ versus Ca2+. These two cations are coordinated differently (octahedral versus heptacoordination (Vorobiev et al., 2003)) and interact differently with actin (Kinosian et al., 1993). These examples raise concerns that even in the case of collective changes observed upon ATP/ADP switch in G-actin, their interpretation in terms of nucleotide cleft closing and opening may not be fully justified. Intriguingly, the only conclusive structural evidence for a discrete open nucleotide cleft conformation of G-actin is that obtained from the atomic structure of the ATP-G-actin–profilin complex in the presence of a high phosphate concentration (Chik et al., 1996). The crystal lattice trapping of two states of actin, with the open and closed nucleotide cleft, does not preclude the existence of more dynamic equilibria in solution.
Acknowledgments
We thank Dr. S. Almo (Albert Einstein College of Medicine, New York) for a generous gift of a vector for bacterial expression of gelsolin segment 1.
This work was supported by grants from the U.S. Public Health Service (AR 22031) and National Science Foundation (MCB 9904599).
Abbreviations used: DTT, dithiothreitol; D-loop, DNase I-binding loop; ɛ-ADP, 1,N,6-ethenoadenosine 5′-diphosphate; ɛ-ATP, 1,N,6-ethenoadenosine 5′-triphosphate; gelsolin-S1, gelsolin segment 1; SDS-PAGE, sodium dodecylsulphate polyacrylamide gel electrophoresis; TMR, tetramethylrhodamine-5-maleimide.
References
- Ando, T., and H. Asai. 1980. Charge effects on the dynamic quenching of fluorescence of 1,N6-ethenoadenosine oligophosphates by iodide, thallium (I) and acrylamide. J. Biochem. (Tokyo). 88:255–264. [PubMed] [Google Scholar]
- Attri, A. K., M. S. Lewis, and E. D. Korn. 1991. The formation of actin oligomers studied by analytical ultracentrifugation. J. Biol. Chem. 266:6815–6824. [PubMed] [Google Scholar]
- Belmont, L. D., A. Orlova, D. G. Drubin, and E. H. Egelman. 1999. A change in actin conformation associated with filament instability after Pi release. Proc. Natl. Acad. Sci. USA. 96:29–34. [DOI] [PMC free article] [PubMed] [Google Scholar]
- Bennett, W. S., Jr., and T. A. Steitz. 1980. Structure of a complex between yeast hexokinase A and glucose. II. Detailed comparisons of conformation and active site configuration with the native hexokinase B monomer and dimer. J. Mol. Biol. 140:211–230. [DOI] [PubMed] [Google Scholar]
- Bryan, J. 1988. Gelsolin has three actin-binding sites. J. Cell Biol. 106:1553–1562. [DOI] [PMC free article] [PubMed] [Google Scholar]
- Chik, J. K., U. Lindberg, and C. E. Schutt. 1996. The structure of an open state of beta-actin at 2.65 A resolution. J. Mol. Biol. 263:607–623. [DOI] [PubMed] [Google Scholar]
- DalleDonne, I., A. Milzani, and R. Colombo. 1999. The tert-butyl hydroperoxide-induced oxidation of actin Cys-374 is coupled with structural changes in distant regions of the protein. Biochemistry. 38:12471–12480. [DOI] [PubMed] [Google Scholar]
- Egelman, E. H. 2001. Actin allostery again? Nat. Struct. Biol. 8:735–736. [DOI] [PubMed] [Google Scholar]
- Flaherty, K. M., D. B. McKay, W. Kabsch, and K. C. Holmes. 1991. Similarity of the three-dimensional structures of actin and the ATPase fragment of a 70-kDa heat shock cognate protein. Proc. Natl. Acad. Sci. USA. 88:5041–5045. [DOI] [PMC free article] [PubMed] [Google Scholar]
- Gershman, L. C., L. A. Selden, H. J. Kinosian, and J. E. Estes. 1989. Preparation and polymerization properties of monomeric ADP-actin. Biochim. Biophys. Acta. 995:109–115. [DOI] [PubMed] [Google Scholar]
- Gershman, L. C., L. A. Selden, H. J. Kinosian, and J. E. Estes. 1994. Actin-bound nucleotide/divalent cation interactions. Adv. Exp. Med. Biol. 358:35–49. [DOI] [PubMed] [Google Scholar]
- Goldsmith, S. C., J. Q. Guan, S. Almo, and M. Chance. 2001. Synchrotron protein footprinting: a technique to investigate protein-protein interactions. J. Biomol. Struct. Dyn. 19:405–418. [DOI] [PubMed] [Google Scholar]
- Kabsch, W., H. G. Mannherz, D. Suck, E. F. Pai, and K. C. Holmes. 1990. Atomic structure of the actin:DNase I complex. Nature. 347:37–44. [DOI] [PubMed] [Google Scholar]
- Kim, E., and E. Reisler. 1996. Intermolecular coupling between loop 38–52 and the C-terminus in actin filaments. Biophys. J. 71:1914–1919. [DOI] [PMC free article] [PubMed] [Google Scholar]
- Kim, E., and E. Reisler. 2000. Intermolecular dynamics and function in actin filaments. Biophys. Chem. 86:191–201. [DOI] [PubMed] [Google Scholar]
- Kinosian, H. J., L. A. Selden, J. E. Estes, and L. C. Gershman. 1993. Nucleotide binding to actin. Cation dependence of nucleotide dissociation and exchange rates. J. Biol. Chem. 268:8683–8691. [PubMed] [Google Scholar]
- Kitazawa, T., H. Shuman, and A. P. Somlyo. 1982. Calcium and magnesium binding to thin and thick filaments in skinned muscle fibres: electron probe analysis. J. Muscle Res. Cell Motil. 3:437–454. [DOI] [PubMed] [Google Scholar]
- Kuznetsova, I., O. Antropova, K. Turoverov, and S. Khaitlina. 1996. Conformational changes in subdomain I of actin induced by proteolytic cleavage within the DNase I-binding loop: energy transfer from tryptophan to AEDANS. FEBS Lett. 383:105–108. [DOI] [PubMed] [Google Scholar]
- Laemmli, U. K. 1970. Cleavage of structural proteins during the assembly of the head of bacteriophage T4. Nature. 227:680–685. [DOI] [PubMed] [Google Scholar]
- McLaughlin, P. J., J. T. Gooch, H. G. Mannherz, and A. G. Weeds. 1993. Structure of gelsolin segment 1-actin complex and the mechanism of filament severing. Nature. 364:685–692. [DOI] [PubMed] [Google Scholar]
- Mossakowska, M., J. Moraczewska, S. Khaitlina, and H. Strzelecka-Golaszewska. 1993. Proteolytic removal of three C-terminal residues of actin alters the monomer-monomer interactions. Biochem. J. 289:897–902. [DOI] [PMC free article] [PubMed] [Google Scholar]
- Otterbein, L. R., P. Graceffa, and R. Dominguez. 2001. The crystal structure of uncomplexed actin in the ADP state. Science. 293:708–711. [DOI] [PubMed] [Google Scholar]
- Polzar, B., E. Nowak, R. S. Goody, and H. G. Mannherz. 1989. The complex of actin and deoxyribonuclease I as a model system to study the interactions of nucleotides, cations and cytochalasin D with monomeric actin. Eur. J. Biochem. 182:267–275. [DOI] [PubMed] [Google Scholar]
- Sablin, E. P., J. F. Dawson, M. S. VanLoock, J. A. Spudich, E. H. Egelman, and R. J. Fletterick. 2002. How does ATP hydrolysis control actin's associations? Proc. Natl. Acad. Sci. USA. 99:10945–10947. [DOI] [PMC free article] [PubMed] [Google Scholar]
- Schuler, H. 2001. ATPase activity and conformational changes in the regulation of actin. Biochim. Biophys. Acta. 1549:137–147. [DOI] [PubMed] [Google Scholar]
- Schuler, H., U. Lindberg, C. E. Schutt, and R. Karlsson. 2000a. Thermal unfolding of G-actin monitored with the DNase I-inhibition assay stabilities of actin isoforms. Eur. J. Biochem. 267:476–486. [DOI] [PubMed] [Google Scholar]
- Schuler, H., C. E. Schutt, U. Lindberg, and R. Karlsson. 2000b. Covalent binding of ATPgammaS to the nucleotide-binding site in S14C-actin. FEBS Lett. 476:155–159. [DOI] [PubMed] [Google Scholar]
- Schutt, C. E., J. C. Myslik, M. D. Rozycki, N. C. Goonesekere, and U. Lindberg. 1993. The structure of crystalline profilin-beta-actin. Nature. 365:810–816. [DOI] [PubMed] [Google Scholar]
- Spudich, J. A., and S. Watt. 1971. The regulation of rabbit skeletal muscle contraction. I. Biochemical studies of the interaction of the tropomyosin-troponin complex with actin and the proteolytic fragments of myosin. J. Biol. Chem. 246:4866–4871. [PubMed] [Google Scholar]
- Strzelecka-Golaszewska, H. 2001. Divalent cations, nucleotides, and actin structure. Results Probl. Cell Differ. 32:23–41. [DOI] [PubMed] [Google Scholar]
- Strzelecka-Golaszewska, H., J. Moraczewska, S. Y. Khaitlina, and M. Mossakowska. 1993. Localization of the tightly bound divalent-cation–dependent and nucleotide-dependent conformation changes in G-actin using limited proteolytic digestion. Eur. J. Biochem. 211:731–742. [DOI] [PubMed] [Google Scholar]
- Strzelecka-Golaszewska, H., M. Mossakowska, A. Wozniak, J. Moraczewska, and H. Nakayama. 1995. Long-range conformational effects of proteolytic removal of the last three residues of actin. Biochem. J. 307:527–534. [DOI] [PMC free article] [PubMed] [Google Scholar]
- Vorobiev, S., B. Strokopytov, D. G. Drubin, C. Frieden, S. Ono, J. Condeelis, P. A. Rubenstein, and S. C. Almo. 2003. The structure of nonvertebrate actin: implications for the ATP hydrolytic mechanism. Proc. Natl. Acad. Sci. USA. 100:5760–5765. [DOI] [PMC free article] [PubMed] [Google Scholar]
- Waechter, F., and J. Engel. 1975. The kinetics of the exchange of G-actin-bound 1: N6-ethenoadenosine 5′-triphosphate with ATP as followed by fluorescence. Eur. J. Biochem. 57:453–459. [DOI] [PubMed] [Google Scholar]