

Abstract
Static and time-resolved two-dimensional x-ray diffraction patterns, recorded from the living mouse diaphragm muscle, were compared with those from living frog sartorius muscle. The resting pattern of mouse muscle was similar to that of frog muscle, and consisted of actin- and myosin-based reflections with spacings basically identical to those of frog. As a notable exception, the sampling pattern of the myosin layer lines (MLL's) indicated that the mouse myofilaments were not organized into a superlattice as in frog. The intensity changes of reflections upon activation were also similar. The MLL's of both muscles were markedly weakened. Stereospecific (rigorlike) actomyosin species were not significantly populated in either muscle, as was evidenced by the 6th actin layer line (ALL), which was substantially enhanced but without a shift in its peak position or a concomitant rise of lower order ALL's. On close examination of the mouse pattern, however, a few lower order ALL's were found to rise, slightly but definitely, at the position expected for stereospecific binding. Their quick rise after the onset of stimulation indicates that this stereospecific complex is generated in the process of normal contraction. However, their rise is still too small to account for the marked enhancement of the 6th ALL, which is better explained by a myosin-induced structural change of actin. Since the forces of the two muscles are comparable regardless of the amount of stereospecific complex, it would be natural to consider that most of the force of skeletal muscle is supported by nonstereospecific actomyosin species.
INTRODUCTION
Fiber x-ray diffraction has been a useful technique in elucidating the behavior of contractile and regulatory proteins in skeletal muscle during contraction. The use of synchrotron radiation has greatly facilitated diffraction recordings by improving the time resolution to the range of milliseconds (or submilliseconds) and allowing weak reflections to be recorded.
Most of the x-ray diffraction studies, especially those using living muscle specimens, have been done using isolated frog muscles or muscle fibers. Since the arrangement of the proteins in frog skeletal muscle fibers is similar to that in mammalian fibers, it is implicitly assumed that the results obtained from frog muscles are basically applicable to mammalian muscles. However, a number of differences in the behavior are known to exist between frog and mammalian contractile proteins (such as temperature dependence of reaction kinetics: e.g., Edman, 1979; Wray, 1987; Zhao and Kawai, 1994; He et al., 1997). Therefore, it is important to clarify the differences as well as the similarities between frog and mammalian muscles by means of x-ray diffraction experiments.
The specific aims of this study are as follows:
To establish a system in which x-ray diffraction studies can be done reliably using living, contracting mammalian muscle. Two-dimensional diffraction patterns have been recorded from some living mammalian muscles at rest (Zappe and Maeda, 1985; Wakabayashi et al., 1988a). As for diffraction patterns during contraction, it is more difficult to record them because isolated mammalian muscle specimens tend to contract less reproducibly, probably due to their higher metabolic rates. One may alternatively use skinned mammalian muscle fibers, but extreme care should be taken to avoid the formation of gradients in substrate and metabolite concentrations (see e.g., Cooke and Pate, 1985). This is particularly important in experiments to assess the amount of stereospecific actomyosin complexes (explained in more detail below). Here the problem was overcome by the use of isolated living mouse diaphragm muscle specimens, which have a very small tissue thickness so that oxygen should diffuse into the tissue with ease. Another merit of the use of mouse diaphragm is that it consists almost exclusively (98%) of fatigue-resistant, fast oxidative-glycolytic type of muscle fibers (Coirault et al., 1995), which is known to have a high phosphocreatine content (∼30 mM) (Kushmerick et al., 1992).
To make a general comparison between mouse and frog muscles under a variety of conditions of measurement. By using two charge-coupled device (CCD) detectors with different characteristics, we were able to obtain 1), high-spatial-resolution static patterns at rest or during contraction, and 2), medium-speed time-resolved measurements during the period of a contraction-relaxation cycle. Detailed comparisons were made between these experimental conditions.
-
To address a specific question as to what amount of stereospecific actomyosin complex is generated during contraction. It is generally believed that the contractile force of muscle is supported by myosin heads bound to actin in a rigorlike, stereospecific manner. Here the stereospecific interaction refers to a fashion of protein-protein interaction in which the spatial relation among the constituent proteins or subunits is defined by the three-dimensional complementarity of numerous contacts (numerous van der Waals contacts and fewer hydrogen bonds and salt bridges) (e.g., Perutz et al., 1968). Such interactions are entropically stabilized by hydrophobic association (loss of structured water from the protein surfaces) (Chothia and Janin, 1975). Such complementarity has not been proven for the actomyosin complex in rigor, but the well-defined spatial relation between the two proteins along with the presence of clusters of hydrophobic residues on both sides of the interface (Rayment et al., 1993b) and experimental evidence for the loss of structured water (Yamada, 1998) make it likely that the rigor complex is interacting in this manner. Because the entire mass of a myosin head is spatially well-defined with respect to an actin monomer, the actin-based layer line reflections are enhanced, including those between the 1st and 7th ALL's (Fig. 1, black curve; Iwamoto et al., 2001) (this nomenclature is based on a double-stranded long-pitch helix with an axial repeat of ∼35.5 nm). Notably, the peak of the 6th ALL (at 1/5.9 nm−1) markedly shifts inward as the reflection is enhanced. The advent of the crystal structures (Kabsch et al., 1990; Rayment et al., 1993a) transformed the widely believed swinging cross-bridge theory of muscle contraction (Huxley, 1969) into a swinging lever-arm theory (Rayment et al., 1993b), in which the light-chain binding domain of myosin swings over the motor domain. The motor domain is assumed to remain stereospecifically attached to actin, and this idea is epitomized by the model by Irving et al. (2000) who assumed that, during the working stroke, the interface between the motor domain and actin was the same as in the nucleotide-free (rigor) state. The solid gray curve in Fig. 1 shows that, if stereospecifically attached, the motor domain alone is sufficient to cause a substantial shift in the peak position of the 6th ALL along with the rise of lower order ALL's.
Despite these expectations, there has been little x-ray evidence that such a stereospecific complex is extensively formed in contracting frog muscle. Although the actin-based 6th ALL is markedly enhanced during contraction, it is a common observation that this occurs without a shift of its peak position toward the meridian (Huxley and Brown, 1967; Yagi and Matsubara, 1988, 1989; Wakabayashi et al., 1985; 1988b). The 5th and lower order ALL's do not even show the slightest sign of enhancement. It is therefore of interest to know whether this counterintuitive situation is specific to frog muscle or applies also to mammalian muscle.
To explore the mechanism responsible for the marked rise of the 6th ALL if there is insufficient stereospecific complex to explain it. From the estimated amount of the stereospecific actomyosin complex and the known relative intensities of actin-based ALL's in rigor, one can estimate the contribution of the stereospecific complex to the 6th ALL enhancement. Clues for the other factors that contribute to the enhancement may be obtained from the behavior of other reflections as well as information available in the literature.
FIGURE 1.
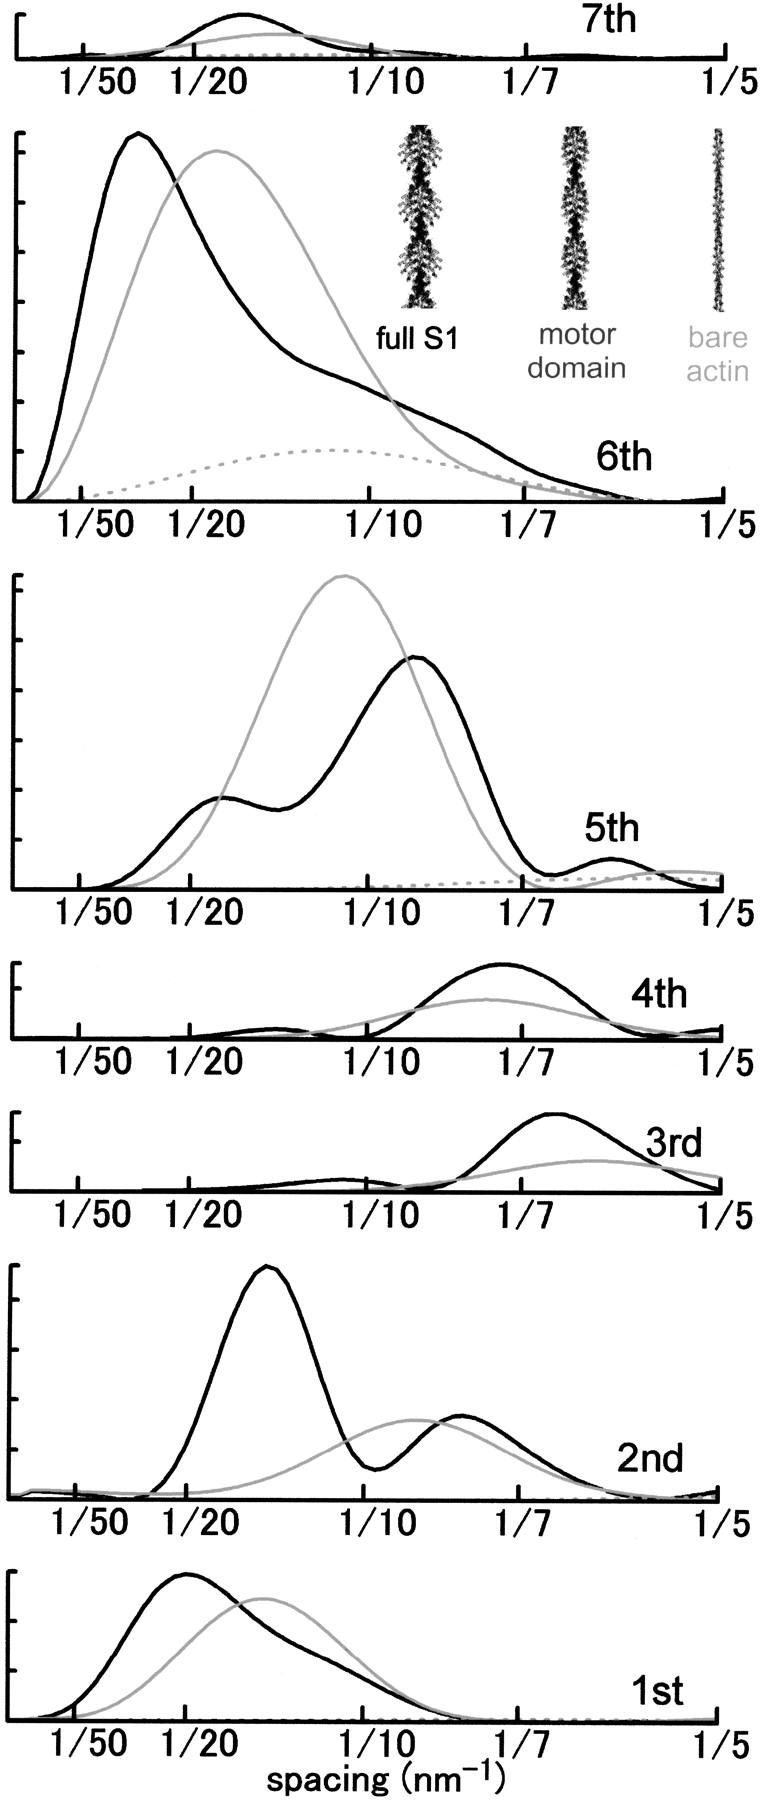
Intensity profiles of actin layer lines calculated from atomic coordinates of an actin filament fully decorated with myosin subfragment-1 (S1). (Black curve) Actin filament decorated with full, intact S1. (Solid gray curve) Actin filament decorated with truncated S1 from which the light-chain binding domain and the light chains are deleted. (Dotted gray curve) Bare actin filament. The intensity is in arbitrary unit and the scale for the 1st ALL is 1/10 of others. Calculated as described (Iwamoto et al., 2001) by using published coordinates and a docking model (Lorenz et al., 1993; Rayment et al., 1993a).
The study as conducted along these lines provided important information about the nature of the actomyosin complex that support force, and the allosteric effect of myosin binding on actin. Implications of the latter to the mechanism of thin filament regulation are also discussed. A preliminary account of a part of the results has appeared elsewhere (Iwamoto et al., 2003).
MATERIALS AND METHODS
Mouse diaphragm
Male mice (strain, BALB-C) were killed by cervical dislocation after stunning, in accordance with the guidelines set by the SPring-8 experimental animal care and use committee. The whole diaphragm was excised in a Krebs-Henseleit (KH) solution (Sigma-Aldrich, St. Louis, MO) with a piece of rib attached. A number of muscle strips (∼6 mm in length and up to 5 mm in width) were then excised by cutting the whole muscle along the grain and mounted to an experimental chamber as shown in Fig. 2.
FIGURE 2.

Schematic diagram showing the methods of preparing and mounting a muscle specimen from a mouse diaphragm. The isolated muscle strip was mounted between the extensions of the force transducer (f) and the servo motor (s). The muscle strip was stimulated by passing electrical current between two arrays of platinum wire electrodes (e). The beam path of x rays is shown as a gray arrow.
The experimental chamber was made of acrylic resin, and had two Kapton windows for x ray and two glass windows for monitoring sarcomere lengths by He-Ne laser light diffraction. The bone end of the specimen was connected to a force transducer consisting of two semiconductor strain gauges (KSPH-2000-E4, Kyowa Dengyo, Tokyo, Japan) attached to both sides of a 0.5-mm thick stainless-steel plate. The membranous central tendon on the other end was clamped to the extension of a servomotor (M3, GSI Lumonics, Ottawa, Canada), which was used to apply a step length change when needed (complete within 1 ms).
Experiments were done at room temperature (25°C) while circulating the KH solution with a peristaltic pump. In the first of the two static recording sessions, the sarcomere length was ∼2.8 μm. This relatively long sarcomere length was due to the somewhat oversized design of the experimental chamber. In the later experiments, this problem was solved and the muscles were made to contract with greater filament overlap (∼2.5 μm). The specimens were stimulated by passing electrical pulses (40 Hz, 0.5-ms pulse width) between two sets of platinum wire electrodes (Fig. 2).
The iodoacetic-acid rigor (IAA-rigor) was induced by soaking the muscle strips in the KH solution containing 1 mM monoiodoacetic acid and repetitively stimulating them 100 times at an interval of 5 s (Fig. 3 B). The KH solution was not bubbled with oxygen, and circulated at a minimal speed only to remove electrolytic products.
FIGURE 3.

Contractions of mouse diaphragm strips. (A) Isometric tension records from 10 consecutive tetanic contractions of a diaphragm strip. The strip was stimulated every 2 min while circulating a Krebs-Henseleit solution at 23°C. The scale bars represent 1 s and 100 mN. (B) Induction of monoiodoacetic acid rigor (IAA-rigor). The strip was stimulated every 5 s in a Krebs-Henseleit solution containing 1 mM IAA. The scale bars represent 10 s and 100 mN.
Frog muscle
Sartorius muscles were dissected from a bullfrog, Rana catesbeiana, and mounted on an experimental chamber similar to the one used previously (Iwamoto et al., 1995, 2000). The muscles were held at their just-taut length, ranging from 27 to 35 mm (sarcomere length, 2.2 ∼2.4 μm). The force transducer was again of semiconductor type (KSPH-2000-E4) but was attached to a 1-mm thick brass plate. Experiments were done while a cooled Ringer solution (NaCl, 115 mM; KCl, 1.8 mM; CaCl2, 2.5 mM; Tris-maleate, 10 mM; pH 7.2; 8°C) was circulated by a peristaltic pump. At this temperature the kinetics of contraction is equivalent to that of mouse muscle at 25°C.
X-ray diffraction studies
The x-ray diffraction experiments were conducted at the BL45XU beamline (Fujisawa et al., 2000) of the SPring-8 synchrotron radiation facility. The detectors were two-dimensional CCD cameras used in combination with image intensifiers (V5445P, Hamamatsu Photonics, Hamamatsu, Japan). Two types of CCD cameras were used, i.e., a cooled CCD camera (C4880-72, Hamamatsu Photonics, 1000 × 1018 pixels) and a fast CCD camera (C4880-80, Hamamatsu Photonics, 656 × 494 pixels but they were reduced to 328 × 246 pixels to achieve a time resolution of 18.67 ms) for high-resolution static recording and time-resolved recording, respectively. The specimen-to-detector distance was around 1.98 m and the x-ray wavelength was either 0.10 or 0.09 nm. The total exposure time for a single spot on the specimen was limited to a maximum of 2 s to avoid radiation damage.
Two methods of background subtraction were used: In one, the background scattering was roughly approximated as an exponential function and was fine-tuned by automatically detecting the peaks and troughs of reflections (Iwamoto et al., 2002). The diffraction patterns from which background was subtracted in this manner are shown in the right halves of Figs. 4, 6, and 7. In the second method, a rotationally symmetrical background was determined by connecting the lowest-count points for respective radii around the center. This procedure should effectively eliminate the scattering from soluble proteins and other amorphous scattering objects and takes much less computation time, but was less effective than the first method in visualizing weak reflections. The diffraction patterns from which their background was subtracted in this manner are shown in the left halves of Figs. 4, 6, and 7. For intensity integration, the background for each reflection was further redetermined by connecting both ends of the reflection with a straight line after the initial background subtraction. All the calculations except for the statistical analyses were carried out by using software developed in-house.
FIGURE 4.
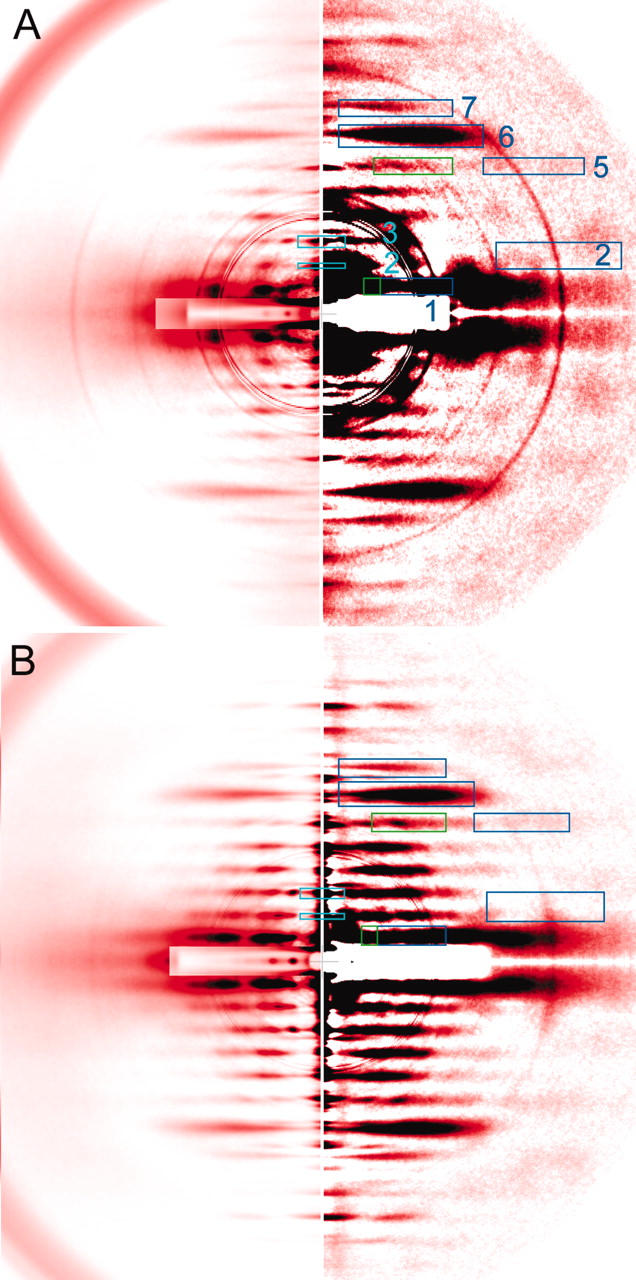
Static x-ray diffraction patterns at rest. (A) Mouse diaphragm; (B) frog sartorius. The (left half) low-gain picture and the (right half) high-gain picture. The colored boxes represent the area in which reflection intensities were integrated. (Blue boxes) Actin layer lines (the number on the right represents the order of reflection). In these boxes the intensity profiles were taken along the layer line. In the green boxes, the profiles were also taken across the layer line. The green box for the 1st ALL partially overlaps with the blue box. The blue and green boxes for the inner part of the 5th ALL completely overlap with each other. (Light blue boxes) Myosin meridional reflections. The four quadrants of the patterns were folded and averaged. The innermost group of overlapping circles are the edges of the round aluminum attenuator. Outer circles originate from the myelin sheath of the nerves and they are more conspicuous in mouse muscle. (A) Summed data from 7 muscles, 16 exposures. (B) Summed data from 6 muscles, 38 exposures.
FIGURE 6.
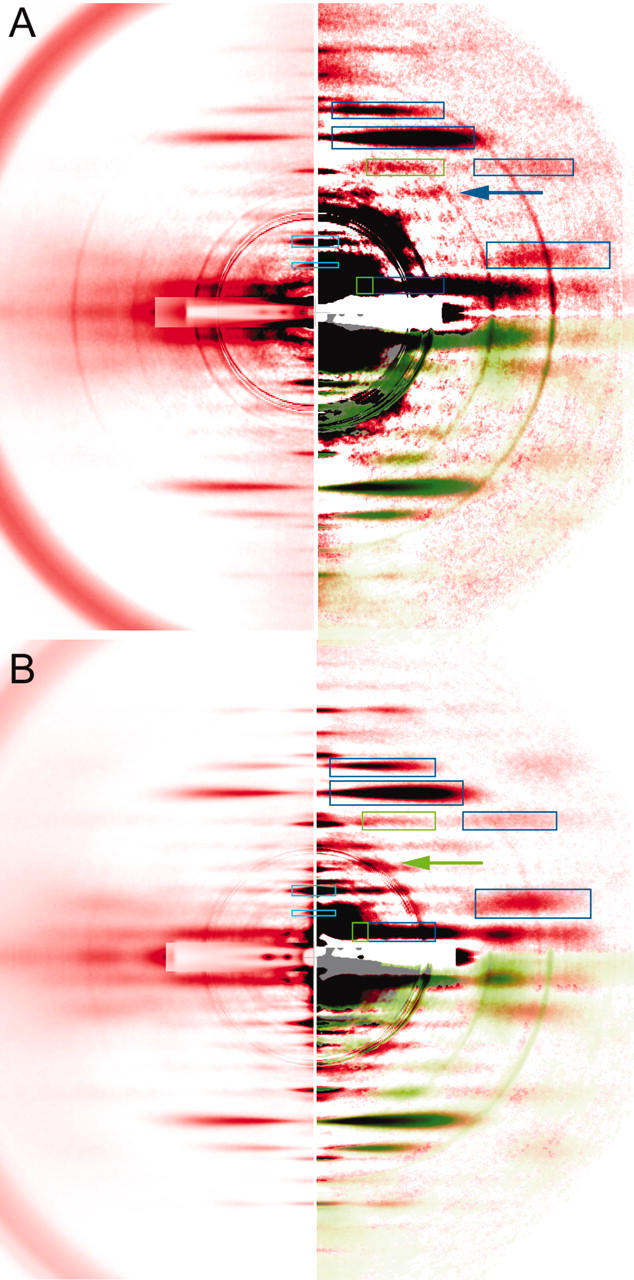
Static x-ray diffraction patterns during isometric contraction. (A) Mouse diaphragm; (B) frog sartorius. Taken from the same set of muscle specimens used for Fig. 4. The pictures were processed and presented in the same manner as in Fig. 4. For comparison, an IAA-rigor pattern (Fig. 7) is overlaid in the fourth quadrant (green shade). Note, in mouse muscle (A), that the 5th ALL (inner part) as well as 4th ALL (blue arrow) is enhanced when compared with the resting pattern (Fig. 4 A). In frog muscle (B), the intensities in these regions are weaker. An actin-based, myosin-modulated ALL is observed at 1/10.4 nm−1 (green arrow). Note also that the outer part of the actin 5th ALL is enhanced in both mouse and frog muscles. The boxes of integration for the MM's were moved automatically to track the shift of position upon activation.
FIGURE 7.

A static x-ray diffraction pattern from mouse diaphragm in monoiodoacetic acid rigor (IAA-rigor). The pattern is shown in two gradations as in Figs. 4 and 6. Summed data from four muscle strips, 169 exposures.
For comparison of intensities, the integrated intensity of the 6th ALL in the relaxed state was used as a standard. This reflection is the most suitable for a standard, because it is the only stable actin-based reflection in the resting patterns and originates exclusively from actin, whose primary structure is conserved among various animal species.
To obtain sufficient counting statistics for weak reflections, all the diffraction patterns that were recorded under identical conditions were summed and their four quadrants were folded and averaged before analysis. To evaluate the specimen-to-specimen consistency of subtle changes in reflection spacing (e.g., the combined 5th ALL/6th MLL as will be described below), diffraction patterns were summed for each muscle or animal. The data groups to be compared (e.g., resting, contracting, and IAA-rigor) were collected during the same beamtime by using an identical x-ray optics; therefore they were free of errors that might be caused by a slight difference in the specimen-to-detector distances if they were collected in separate beamtimes. The resting and contracting patterns were strictly paired, i.e., after recording each resting pattern, a contracting pattern was recorded without moving the beam position on the muscle. The statistical analyses were carried out by using a commercial software package (Prism, Graphpad, San Diego, CA). The p-values of less than 0.05 were considered statistically significant.
Model calculations
Diffraction patterns were calculated from an available docking model of skeletal myosin subfragment-1 (S1) and actin (Lorenz et al., 1993; Rayment et al., 1993a) as described (Iwamoto et al., 2001).
RESULTS
Contraction of diaphragm muscle
The diaphragm muscle specimens showed complete tetanic contractions in response to a train of electrical pulses (40 Hz, ∼1-s duration) at room temperature (23°C). Contractions can be repeated many times with only a small tension decline in a circulating KH solution (Fig. 3 A). The maximal number of contractions for a single specimen was limited to 10 or less in diffraction experiments.
Static diffraction pattern at rest
The background-subtracted image of mouse muscle at rest, shown in two different gradations (Fig. 4 A), is compared with that of frog muscle (Fig. 4 B). In the left of Fig. 4 A, a number of myosin- and actin-based layer line reflections are seen as well as mostly myosin-based meridional reflections (MM). The MLL's are sampled at specific row lines (Fig. 5). The MLL's in mouse muscle are sampled at positions indexable to the hexagonal myofilament lattice (Fig. 5 A). Up to the 5th order, the MLL's are sampled at the position of the 1,1 equatorial reflection and only the 3rd MLL has a peak at the 1,0 equatorial reflection. This manner of simple lattice sampling has also been reported for the ALL's in frog muscle treated with N-ethylmaleimide (Yagi, 1992). In frog muscle, at least the 1st and the 2nd MLL's are sampled at positions not indexable to the hexagonal myofilament lattice, but to a lager superlattice, with a unit cell size  times that of a normal lattice (Fig. 5 B) (Huxley and Brown, 1967).
FIGURE 5.

Intensity profiles of the myosin layer lines of resting muscles. (A) Mouse diaphragm; (B) frog sartorius. Taken from the patterns in Fig. 4. The intensities are expressed in terms of digits of the analog-to-digital converter output from the CCD detector. One digit corresponds to 0.039 photons. The vertical broken lines show the positions of the 1,0 and 1,1 (from left) reflections indexed to the normal (minimal) hexagonal myofilament lattice. The vertical dotted lines show the positions of the 2,0, 2,1, and 3,1 (from left) reflections indexed to the superlattice (unit cell size,  of that of the normal lattice).
As for the ALL's of mouse muscle, only the 6th and 7th ALL's at 1/5.9 and 1/5.1 nm−1, respectively, are clearly visible as in frog muscle.
The right side of Fig. 4 A is a high-gain picture of the left, to show weaker reflections. The 2nd ALL in the region 1/4–1/5 nm−1 as measured along the layer line (tropomyosin reflection) is very weak. A very diffuse spot is found outside this part of the 2nd ALL. Very faint, diffuse ALL's are also observed at around 1/7 nm−1 and 1/5.1 nm−1 as measured along the meridian and at high angles along the layer line. These reflections are considered to be parts of 5th and 7th ALL's, respectively, originating from bare actin, and are also found in the frog muscle pattern (Fig. 4 B) with similar intensities.
Static diffraction patterns during isometric contraction
The diffraction patterns recorded during isometric contraction of mouse (Fig. 6 A) and frog (Fig. 6 B) muscles shows a number of common features when compared with their resting patterns: To start with outer diffuse layer lines, the outer part of the 2nd ALL is now clearly visible. The integrated intensity of this part of the ALL is 22% of that of the 6th ALL at rest, comparable to the value for the skinned muscle fibers cross-linked in the open state (Iwamoto et al., 2002). In the case of frog, this value was 31% (cf. 40% in Popp et al., 1991). The outer 5th and 7th ALL's also seem to have enhanced.
As for inner layer line reflections, the 6th and 7th ALL's are visibly stronger in both muscles. In mouse muscle, the enhancement is 35%. In both muscles, the ALL's were enhanced without a shift of peak in the intensity profiles taken along the layer line (Fig. 8).
FIGURE 8.

Intensity profiles of the 6th ALL measured along the layer line. (A) Mouse diaphragm; (B) frog sartorius. Taken from Figs. 4 and 6. (Black line) During contraction; (gray line) at rest. The intensities are expressed in terms of digits of the analog-to-digital converter output from the CCD detector. One digit corresponds to 0.039 photons. Note that the centroid position (vertical short lines) does not move upon activation, either in mouse (A) or in frog (B) muscle.
In frog muscle, a layer line is observed at the axial position of 10.4 nm (green arrow in Fig. 4 B). This is considered to arise from myosin heads that are attached to actin but still maintain their 14.5-nm repeat (Yagi, 1996). In mouse muscle, this layer line is not clearly recognized.
When the rigor pattern recorded from mouse muscle in IAA-rigor (taken from Fig. 7) is superposed to the contracting patterns of frog and mouse (green shade in Fig. 6), it is noticed that intensities are present at positions expected for the ALL's observed in rigor (5th, 4th, 2nd inner part, and, very faintly, 3rd order). However, it would be premature at this point to conclude that this is evidence for stereospecific binding, since many of these ALL's could overlap with the remaining MLL's that have similar spacings. Therefore, we examined further the relative contribution of actin and myosin components to these intensities.
In mouse muscle, the intensities clearly remain at the positions for the 5th and 6th MLL's (indicated by a green box and a blue arrow in Fig. 6 A). However, the peak of one of these reflections (corresponding to the 6th MLL) has shifted away from the equator as is evident from its vertical profile shown in Fig. 9 A. Its mean centroid position during contraction was 7.12 nm−1, midway between the values for resting (7.16 nm−1, which corresponds to the 6th order of a 43.0-nm basic myosin repeat) and IAA-rigor (7.09 nm−1, which corresponds to the 5th order of a 35.5-nm basic actin repeat) (Fig. 10 A). Therefore, the layer line is considered to have (probably equal) contributions from both MLL and ALL (i.e., stereospecifically bound myosin heads) components, and should be referred to as a combined 5th actin/6th myosin layer line. The differences in the centroid positions are statistically significant. This combined 5th ALL/6th MLL tended to be enhanced upon activation (Fig. 9 A).
FIGURE 9.
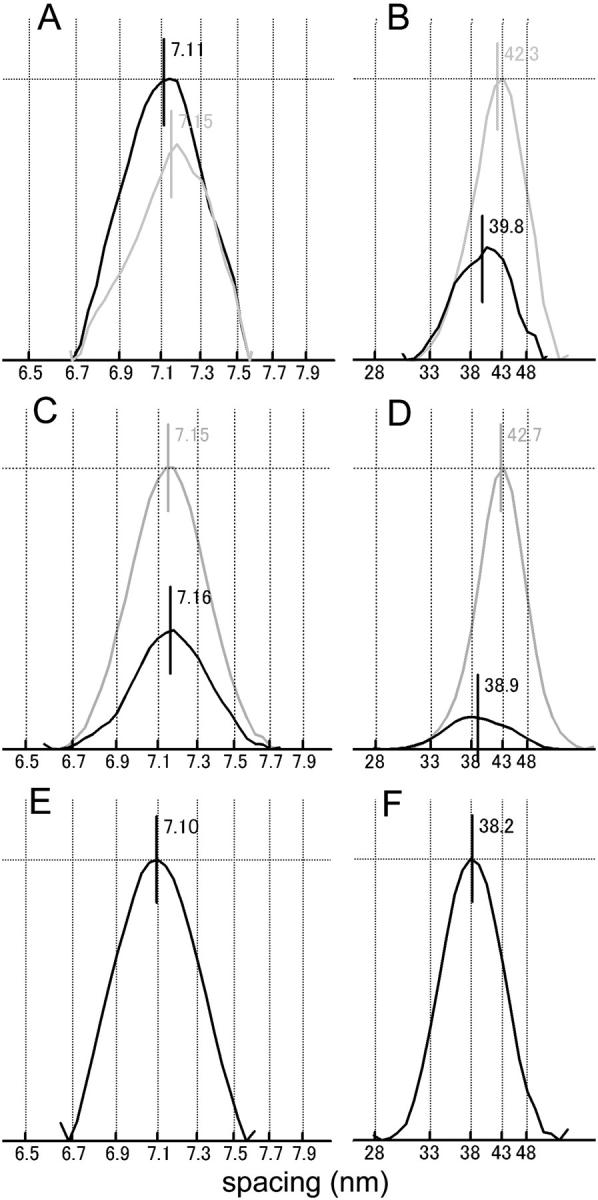
Intensity profiles of the combined 5th ALL/6th MLL (A, C, E), and 1st ALL/MLL (B, D, F) measured along the meridian (green boxes in Figs. 3 and 4). (A and B) Mouse diaphragm; (C and D) frog sartorius; (E and F) IAA-rigor of mouse. In A–D, the black and gray lines represent the profiles during contraction and at rest, respectively. The vertical lines near the peaks and the numbers show the position of the centroid. The intensities were normalized to the higher of the peak intensities. The values of the centroid positions were determined from the patterns summed for all muscles and are not necessarily identical to the mean values calculated from individual muscles (Fig. 10).
FIGURE 10.

Summary of centroid positions of combined actin/myosin layer lines. (A and C) Mouse diaphragm; (B and D) frog sartorius. (A and B) Combined 5th ALL/6th MLL; (C and D) 1st ALL/MLL. The data show the averages of the values determined individually for different animals (mouse) or muscles (frog and mouse in rigor). The error bars represent standard deviation. The data for resting (rest) and contraction (cont) are paired, so that they were subjected to a paired t-test. The data for rigor are not paired with other data, and an unpaired t-test was applied. The asterisks show that the difference is significant (*, p < 0.05; **, p < 0.01; ***, p < 0.001). Number of specimens: 5 (mouse rest and contraction), 4 (mouse, IAA-rigor), and 6 (frog).
In activated frog muscle (Fig. 6 B), the combined 5th ALL/6th MLL is also observed, but its centroid shifted toward the equator along with the 6th myosin meridional reflection (from 7.13 to 7.15 nm−1; this direction of shift is in accord with the well-documented small increase in the myosin repeat upon activation, e.g., Haselgrove, 1975) (Figs. 9 C and 10 B). The difference in the centroid positions is again statistically significant. Contrary to mouse, the intensity of the ALL decreased upon activation (Fig. 9 C). Thus, the contribution of the stereospecific interactions to this combined layer line should be much smaller than in mouse.
Static diffraction pattern recorded from mouse muscle in IAA-rigor
Fig. 7 shows the diffraction pattern recorded from mouse muscle rigorized as shown in the tension trace in Fig. 3 B. All the ALL's from the 1st to 7th are enhanced and the peak of the 6th ALL has visibly shifted inward. These features are consistent with rigorized frog muscle (Huxley and Brown, 1967; Takezawa et al., 1999) and rabbit skinned muscle fibers (Takezawa et al., 1999).
The combined first actin/myosin layer line reflection
The 1st MLL (at 1/42.9 nm−1) partially overlaps with the 1st ALL (at 1/36 nm−1). At rest, the combined peak was positioned at 1/42.3 nm−1 in mouse and at 1/42.7 nm−1 in frog (Fig. 9, B and D; probably these do not represent a true difference), whereas in rigor, the peak was positioned at 1/38.2 nm−1 (Fig. 9 F). Thus in both muscles, the myosin component dominates at rest. During contraction, the combined ALL becomes much weaker, and its peak has shifted to 1/39.8 and 1/38.9 nm−1 for mouse and frog muscles, respectively, i.e., midway between the myosin and actin values (Fig. 9, B and D). Again, the difference in the centroid positions is statistically highly significant for both muscles (Fig. 10, C and D). The integrated intensities of the combined peak during contraction were comparable for the two muscles (10 and 12% of the integrated intensities of the 6th ALL at rest for mouse and frog, respectively, in the integration area shown in Figs. 4 and 6).
Time course of the intensity changes of reflections
In the static patterns of contracting mouse muscle, we have seen an emergence of ALL's reminiscent of rigorlike actomyosin interactions. The next question to be answered is whether the emergence of these ALL's is due to gradual ATP exhaustion and/or metabolite buildup, or a result of normal contractile processes. This question is best addressed by time-resolved measurements (Figs. 11 and 12).
FIGURE 11.

Time courses of changes of the integrated intensities (B–E) and the centroid positions (F) of the major reflections as compared with that of tension (A) in mouse diaphragm. The tension record is the average for all muscles used (scale bar, 100 mN). The intensities are expressed in terms of digits of the analog-to-digital converter output from the CCD detector. One digit corresponds to 0.35 photons. The muscles were stimulated in the period between the two vertical gray lines. (B) Actin-based ALL's. (Black) 6th; (light gray) 7th; (dark gray) combined 5th ALL/6th MLL. Note that the combined 5th ALL/6th MLL increases during contraction. (C) Outer ALL's. (Gray) 2nd; (black) 5th. In C only, the levels before stimulation were set to zero. (D) Equatorial reflections (black, 1,1; gray, 1,0). (E) MM's. (Black) 3rd; (gray) 2nd. (F) Centroid positions of the combined 5th actin/6th myosin (black), and 1st ALL/MLL (gray) layer lines measured across the layer line (green boxes in Figs. 4 and 6). Expressed as the spacing in real space. The horizontal broken lines show the prestimulation levels. Note that the spacing for the combined 5th ALL/6th MLL tends to decrease during contraction (the ALL moves away from the equator). Summed data from 18 muscle strips, 114 contractions.
FIGURE 12.

Time courses of changes of the integrated intensities (B–E) and the centroid positions (F) of the major reflections as compared with that of tension (A) in frog sartorius. The data are presented in the same manner as in Fig. 11. The scale bar for tension is 0.5 N. (B) ALL's. (Black) 6th; (light gray) 7th; (dark gray) combined 5th actin/6th myosin (inner part). Note that the intensity of the last ALL tends to decrease during contraction. (C) Outer ALL's. (Gray) 2nd; (black) 5th. (D) Equatorial reflections (black, 1,1; gray, 1,0). (E) MM's. (Black) 3rd; (gray) 2nd. (F) Centroid positions of the combined 5th ALL/6th MLL (black), and 1st ALL/MLL (gray) measured along the meridian (green boxes in Figs. 4 and 6). Note that the spacing for the combined 5th ALL/6th MLL tends to increase during contraction (the ALL moves toward the equator). Summed data from four muscles, 40 contractions.
Figs. 11 and 12 compare the time courses of changes of intensities and spacings of representative reflections with that of tension in a single tetanic contraction-relaxation cycle. These reflections include the 6th and 7th ALL's, combined 5th ALL/6th MLL (B), the outer 2nd and 5th ALL's (C), the 1,1 and 1,0 equatorial reflections (D), and 3rd and 2nd myosin meridional reflections (E). Upon activation, all of the actin-based reflections shown here (except for the combined 5th ALL/6th MLL) increased their intensities ahead of tension (A) with similar time courses, as reported by Wakabayashi et al. (1985) and Kress et al. (1986). The decline of their intensities during relaxation seemed to follow closely the tension decay. These reflections showed little species-dependent differences.
By comparing the data in Figs. 11 and 12, it is clear that only the combined 5th ALL/6th MLL's of the two muscles are strikingly different in behavior: both their intensities (B, dark gray curve) and their centroid positions (F, black curve) move in opposite directions. It was difficult to determine their time courses accurately because of the small amount of change. However, the changes in mouse muscle seem to be complete within 100–120 ms, i.e., no later than the achievement of the tetanic plateau (Fig. 11, B and F). None of the combined 5th ALL/6th MLL or other ALL's showed a gradual increase of intensity indicative of ATP exhaustion and/or ADP buildup.
The shift of the peak of the combined 1st ALL/MLL was much clearer. As in frog muscle, the shift was quick, and was complete within ∼60 ms of stimulation (F, gray curve).
Taken together, the changes or emergence of these ALL's in mouse muscle were complete in an early phase of contraction, in which hardly a single turnover of actomyosin ATPase reaction would be possible. Since the concentration of myosin heads within the fiber is ∼190 μM (Yates and Greaser, 1983) whereas that of ATP is in a millimolar range (Kushmerick et al., 1992), it is concluded that the observed changes in these ALL's in mouse muscle are not the result of a lowered intracellular ATP concentration but reflect the structural changes inherent in contraction.
As for MM's, the intensity of the 3rd MM increased and that of the 2nd MM decreased upon activation in both muscles. The MM's generally moved toward the lower angle (greater spacing) as is well documented (Haselgrove, 1975). The intensity increase of the 3rd MM was much greater in mouse than in frog (E, black curve), and this is another major difference found between the two muscles. This is mainly due to the lower reflection intensity for mouse muscle at rest. During contraction, the intensity ratios of (3rd MM): (6th ALL at rest) were similar for both muscles (7.5–7.6).
DISCUSSION
Advantages in using mouse diaphragm
In the study, x-ray diffraction patterns were compared between living mouse and frog muscles under a variety of conditions. The experiments included high spatial resolution static patterns recorded either at rest or during contraction, and medium-speed time-resolved measurements (time resolution, 18.67 ms) to cover a whole contraction-relaxation cycle. These measurements were made possible by the use of living mouse diaphragm muscle, which was proven useful in physiological measurements. Its high content of phosphocreatine (∼30 mM) along with its low content of ADP (∼10 μM) (Kushmerick et al., 1992) would ensure constant substrate and metabolite levels at least in the small number of contractions used for x-ray recordings. The ease of dissection and utility in physiological experiments is comparable to that of frog sartorius. The establishment of an experimental system using a mouse muscle would also have significance in studying the effects of mutations in contractile and related proteins, because x-ray experiments can be coupled with the use of transgenic mice, which has become one of the most common tools used to study the functions of mammalian gene products.
General similarities in mouse and frog patterns
The myosin layer line reflections in skinned mammalian muscle fibers are known to be temperature sensitive (Wray, 1987). Here the patterns were recorded at 25°C, at which the MLL's should be intense. As a merit of using living muscles, we were able to compare the sampling pattern of the MLL's in the two muscles. Unlike in frog muscle, no superlattice structure was seen in mouse diaphragm. Apart from this, the resting pattern of mouse muscle was similar to that of frog muscle.
The changes of reflections associated with activation/relaxation and their time courses were also similar for both muscles, except for some quantitative differences. This applies to the reciprocal changes of equatorial reflections, general weakening of MLL's, enhancement of the 6th, 7th, and the outer part of the 2nd and 5th ALL's, and the rise of the 3rd and the fall of the 2nd MM's (Figs. 11 and 12). Notably the 6th ALL was enhanced without a change of its centroid position in either muscle type (Fig. 8).
Stereospecific actomyosin complex in mouse and frog muscles
Rise of reflections relevant to stereospecific binding
The major difference between the two muscles was found in a rather weak reflection. That is the weak layer line identified as the combined 5th ALL/6th MLL. In mouse, its intensity increased and its peak moved to a higher angle within a short period after onset of stimulus (Fig. 11). This behavior is consistent with the idea that a small amount of rigorlike, stereospecific actomyosin complexes are formed as a result of normal contractile activity. On the other hand, the corresponding layer line of frog muscle showed changes in the opposite direction (Fig. 12), and this behavior is what is expected for a pure MLL. On close examination this layer line of frog consists of two parts: a part sampled at the 1,1 row line and the remaining part stretching outside and axially located slightly away from the equator. A possibility is that this latter part represents the 5th ALL, but the result of the centroid analysis (Figs. 9 and 10) does not support this idea. In frog muscle, therefore, the myosin component is considered to have the major contribution to this combined layer line.
Evidence for myosin binding per se
The enhancement of the 1st ALL has been reported to accompany the temperature-induced force augmentation of rabbit skinned fibers (Bershitsky et al., 1997). In frog muscle, by using a long camera, Bordas et al. (1993) observed emergence of a new series of low-angle layer lines (at 37.0, 24.0, 21.8, 19.0, 18.0, 14.58, 10.9, and 10.4 nm) that they ascribed to attached myosin heads. These ALL's were analyzed in more detail by Yagi (1996), who interpreted these ALL's as arising from myosin heads attached to actin, although still maintaining their 14.5-nm periodicity of the thick filament (preliminary calculations showed that these reflections are resistant to myosin head disorder). Moreover, the response of the 6th ALL to a paired quick release/stretch suggests that a small fraction of its intensity comes from attached myosin heads whose structure can be distorted by the perturbation (our unpublished results). Therefore, there would be no room to dispute that myosin heads do attach to actin during contraction.
Evidence for stereospecific binding
To prove that the binding is stereospecific, however, it has to be shown that all of the series of ALL's up to the 6th and desirably beyond that, rise in parallel in a manner consistent with such a mode of binding (see Fig. 1). The enhancement of the 1st or the 6th ALL alone is not sufficient to prove that the myosin heads are bound stereospecifically. One reason for this is that, as a general rule, lower order reflections are less susceptible to disorder. Thus the 1st ALL is expected to be the most insensitive to the disorder of attached myosin heads. Even if the disorder is so extreme that no stereospecific interaction would be possible (like in the case of myosin subfragment-1 cross-linked to actin and then activated in the presence of ATP, or in the case of weakly binding myosin heads), model calculations predict that the 1st ALL is substantially enhanced whereas the 6th ALL is little affected (Iwamoto et al., 2001; Gu et al., 2002). Also, components other than myosin heads also contribute to the 1st ALL, including actin itself.
By the same logic, the strong enhancement of the 6th ALL without parallel enhancements of the lower order ALL's is also unlikely to be a manifestation of stereospecific binding. This is especially true if the enhancement occurs without a shift of the reflection peak, because any form of mass accretion to the outer surface of actin filament should inevitably result in an inward shift of its peak (see Fig. 1). Therefore, if the 6th ALL is enhanced in this manner, it is likely that factors other than stereospecific binding are responsible.
Therefore, the observed increase of the actin contribution to the combined 5th ALL/6th MLL in contracting mouse muscle is an important indication for stereospecific binding. The ALL's of contracting mouse muscle did not show signs of myosin head disorder as predicted by the model calculation mentioned above (i.e., lower order reflections have higher intensities; Iwamoto et al., 2001), suggesting that the stereospecifically attached myosin heads in contracting mouse muscle are as well ordered as in rigor. Such an ordered complex may be produced by the mechanical constraint within the filament lattices of isometrically contracting muscle.
Estimated amount of stereospecific complex
The amount of the stereospecific complex formed during contraction may be estimated by comparing the integrated intensities of the ALL's with those in IAA-rigor, in which all the myosin heads should be attached to actin. The fraction of attached myosin heads has previously been estimated on the basis of the square law, in which the reflection intensity is assumed proportional to the square of the number of diffractors (see e.g., Huxley and Kress, 1985). However, this treatment is shown to be theoretically incorrect, leading to a substantial overestimate (Tsaturyan, 2002). A caged-ATP experiment (Iwamoto et al., 2003) and other unpublished results rather suggest a linear relationship between the number of attached heads and reflection intensities. Here we assume a linear relationship between them. During contraction of mouse muscle, the intensity of the 1st ALL integrated within the green box as shown in Figs. 4 and 6 was ∼10% of the value in rigor. If half of this intensity originated from the stereospecific complex, then ∼5% of the myosin heads should be attached to actin in a stereospecific form.
Likewise, the fraction of the myosin heads bound in a stereospecific manner may also be estimated from the intensity of the combined 5th ALL/6th MLL. Its integrated value relative to that of the 6th ALL at rest was ∼31% in IAA-rigor and ∼11% during contraction of mouse muscle. If again half of this intensity originated from the stereospecific complex, then ∼17% (=11/31 × 0.5) of the myosin heads should be attached to actin in a stereospecific form.
It is therefore concluded that, during contraction of the mammalian muscle, some myosin heads do bind to actin in a stereospecific manner as a normal part of the contraction process. However, the fraction of those myosin heads is small (a reasonable estimate would be of the order of 10%). The small fraction of myosin heads bound in a stereospecific manner is consistent with the estimates obtained by other experimental techniques (Cooke et al., 1982, Fajer et al., 1990; Irving et al., 1995), whereas Kraft et al. (2002) reported a higher value. In the case of frog muscle, the intensity of the combined 5th ALL/6th MLL during contraction was ∼8% of that of the 6th ALL at rest, and this should have a much smaller MLL contribution. Therefore, the fraction of myosin heads bound in a stereospecific manner should be much less than in mouse. This notable difference may reflect the difference in the kinetic parameters of actomyosin ATPase cycle in these two muscles.
What type of actomyosin complex supports active force?
It is generally considered that the rigor complex is the most tightly bound intermediate formed in the end of an actomyosin ATPase cycle, and this and other rigorlike (stereospecifically bound) intermediates have been regarded as the most likely candidates to support active force. An early theoretical model (Huxley, 1957), intended to explain the energetic data available then (Hill, 1938), predicted that ∼80% of the myosin heads would be attached at any moment and contribute to force. This large fraction of attached myosin head has been supported by a number of experiments, including fiber stiffness measurements (Goldman and Simmons, 1977; Fajer et al., 1990; Kawai and Zhao, 1993) and x-ray equatorial reflection recordings (Haselgrove and Huxley, 1973; Matsubara et al., 1975; Yagi et al., 1977, 1993; Huxley, 1980). However, it remained enigmatic that both x-ray and electron spin resonance (ESR) results point to a conclusion that a much smaller fraction of the myosin heads are in rigorlike configurations.
Are these few rigorlike myosin heads solely responsible for force production? The results do not support this idea. The results showed that the contents of rigorlike myosin heads are very different in mammalian and frog muscles, yet they support comparable amounts of force per cross sectional area (in mouse diaphragm, ∼2.3 × 10⁵ N/m2 at 25°C (average of 285 mN in Fig. 11 in a cross sectional area of 5 × 0.25 mm2); in frog, 2.5 ∼ 3 × 10⁵ N/m2 at 1 ∼ 2.5°C (Curtin and Edman, 1994)). Thus, the content of the rigorlike myosin heads seems irrelevant to the amount of force, and it seems more natural to consider that a large number of myosin heads are attached in a nonstereospecific manner and still support force. This is in accordance with the conclusion from ESR studies that most of the attached heads are disordered (Fajer et al., 1990).
Here it is worth noting that, of the myosin-modulated ALL's described by Yagi (1996), the one at 1/10.4 nm−1 but not the one at 1/23 nm−1 was markedly enhanced in contracting frog muscle (Fig. 6) and this situation is reversed in rigor. It may be that the ALL at 1/10.4 nm−1 is sensitive to the mode of myosin attachment specific to contraction.
Mechanism of enhancement of the 6th ALL
Factors that affect the 6th ALL
The intensification of the 6th ALL during contraction has already been noticed in early x-ray diffraction experiments, and was initially considered as evidence for myosin head attachment after actin periodicity (Parry and Squire, 1973; Matsubara et al., 1984). Contrary to the expectation from such mode of attachment, little or no shift of its peak accompanies this intensification (Huxley and Brown, 1967; Wakabayashi et al., 1985, 1988b; Yagi and Matsubara, 1988, 1989). A few repots from living frog muscle suggest that there is indeed a shift (Haselgrove, 1975; Bordas et al., 1999), but the shift is not obvious on visual inspection in the cases where intensity profiles are available.
Now we consider the relative contributions of various factors to the 6th ALL enhancement. In mouse, the increase of the 6th ALL intensity upon activation ranged from 35% (Fig. 8) to 50% (Fig. 11). As the muscle passed into rigor, the 6th ALL intensity increased by 84%. If the fraction of stereospecifically attached heads is 17% during contraction, ∼14% out of the 35 ∼50% (84 × 0.17) is accounted for by the stereospecific interaction. A part (up to 10% out of the 35 ∼ 50%) of the enhancement would be explained by some structural changes of the thin filament itself due to calcium binding, as is evident from the experiments using overstretched semitendinosus muscle of the frog (Kress et al., 1986; Yagi and Matsubara, 1988) and skinned muscle fibers from rabbit (Kraft et al., 1999). Therefore, 11 ∼ 26% [= (35 ∼ 50) − 14 − 10] out of the 35 ∼ 50% increase remains unexplained. Maeda et al. (1988) extracted a visible peak shift toward the meridian by subtracting the contribution of the partially overlapping 7th MLL, but they left open the possibility of structural changes of actin. In fact, such behavior of the 6th ALL without a concomitant rise of lower order ALL's is not readily conceivable, as already discussed.
Structural change of actin as a source of unexplained enhancement
A clue in solving the question may be the behavior of the outer part of the 5th ALL. This part of the reflection is located further away from the part enhanced by the myosin head attachment in rigor, and its radial position approximately coincides with that of the 5th ALL of F-actin alone. This part of the ALL was enhanced upon activation of both mouse and frog muscles (Figs. 6, 11, and 12) despite the striking difference in the behavior of the inner part. Its integrated intensity is about one fifth of that of the 2nd ALL in both muscles. Therefore it is likely that the two parts on the same ALL have different origins, and the enhancement of the outer part is likely to reflect a structural change of actin; the accretion of disordered myosin heads at a greater radius around actin is unlikely to affect such a high-angle reflection. The concerted rise of the three ALL's (6th, 7th, and the outer part of 5th) is most readily reproduced by a type of structural change of the thin filament, in which each actin monomer is compressed in the axial direction (e.g., by 10%), or any other structural change that gives each actin monomer a flatter appearance when viewed side on (Fig. 13). This type of structural change has little effect on the 1st ALL.
FIGURE 13.
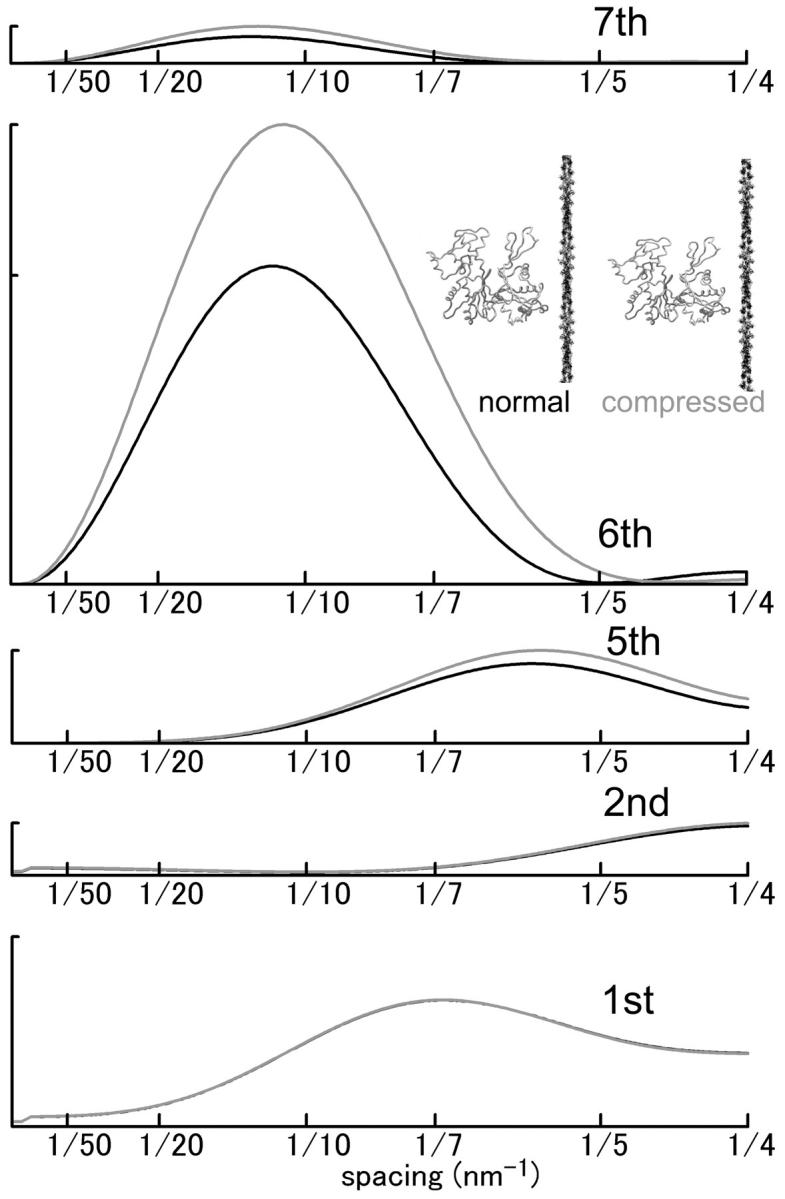
Effect of actin structural change on the intensity profiles of ALL's calculated from atomic coordinates of an actin filament. (Black curve) Normal actin filament (identical to the light gray curve in Fig. 1). (Gray curve) Actin filament in which each actin monomer is compressed by 10% in axial direction. The repeat of the monomers is unchanged. Note that the 5th, 6th, and 7th ALL are enhanced by the compression whereas the 1st ALL is not affected. The intensity in arbitrary unit and the scale is the same for all ALL's.
Specifically, one of the ways to reproduce such a structural change would be to move the subdomain 1 and/or subdomain 2 of actin (Kabsch et al., 1990) away from the thin filament axis. There are reports that such movement actually takes place upon myosin binding (Kasprzak et al., 1988; Moens and dos Remedios, 1997). Orlova and Egelman (1995) have reported that the F-actin structure depends on the presence of divalent cations. They ascribed the structural change to a major shift of the subdomain 1, and pointed out that the transition from magnesium to calcium structures would cause an enhancing effect very similar to that which occurs to the 6th ALL upon activation. However, the structural change that they observed (a structural change that favors the left-handed helix structure over the right-handed one, rather than the general flattening of each monomer) may be distinct from that observed here by x-ray diffraction, because that structure did not reproduce a concomitant rise of the 7th or outer 5th ALL's (their Fig. 4). In the model presented by Wakabayashi et al. (1988b), each actin monomer was represented by two domains, and the separation between them was postulated to increase upon activation. By assuming so they were able to reproduce the enhancement of both the 6th and 7th ALL's as well as the outer 5th ALL. In the model of Al-Khayat et al. (1995), the major movement was restricted to the subdomain 2. Although the details of the structural change await further studies, the results are in general agreement with these earlier reports that the structural change of actin alone can cause a substantial enhancement of the 6th and 7th ALL's.
What causes the structural change of actin: implications for the thin filament regulation
In frog muscle, the contractile force was maintained for a while after stimulus (Fig. 12 A). As the intracellular calcium drops toward its resting level promptly (as is evident from the low-temperature records of Blinks et al. (1978)), it is considered that the myosin heads remaining attached maintain the activated state of the thin filament (Iwamoto et al., 1995, 2000). In this context, it is worth noting that the intensities of all of the ALL's in question here (6th, 7th, and the outer part of 5th), as well as the 2nd ALL, follow time courses similar to that of isometric tension (Fig. 12, C and D). This similarity in the time courses suggests that the structural change of actin occurs as a result of allosteric effect of myosin attachment. It is now widely believed that the thin filament of vertebrate skeletal muscle assumes three regulatory states that may be called blocked, closed, and open (McKillop and Geeves, 1993). These states are dominated in the absence of calcium, in the presence of calcium but in the absence of strongly binding myosin head, and in the presence of both calcium and strongly binding myosin head, respectively. In support of this model, electron microscopy evidence suggests that tropomyosin molecules can assume three different azimuthal positions on the thin filament (Vibert et al., 1997). In the open state, the tropomyosin position is such that the 2nd ALL is the strongest. Recently, however, we have shown that myosin subfragment-1 can form rigor complex with the thin filaments that has been cross-linked in the closed state (Iwamoto et al., 2002). Upon formation of rigor complex, no further enhancement was observed in the 2nd ALL. The result raises a possibility that the further movement of tropomyosin deep into the groove of the two-start F-actin helix is not a prerequisite for creating the open state. Alternatively, it may be the myosin-induced allosteric structural change of actin that creates the open state. It has long been reported that myosin binding can cause some structural change in actin (Oosawa et al., 1973; Takebayashi et al., 1977, Yanagida and Oosawa, 1978; Kouyama and Mihashi, 1981, Miki et al., 1982; Miki and Kouyama, 1994; Moens and dos Remedios et al., 1997; Orlova and Egelman, 1997) and such structural change may occur in a cooperative manner (Orlova and Egelman, 1997, and the references therein). These reports, together with the x-ray observations, raise a possibility that the cooperative activation of the thin filament by attached myosin heads (closed-to-open transition) may involve a structural change of actin. This idea is in accord with the observed dependence of the ALL enhancement on myofilament overlap (Maeda et al., 1988), since a thin filament cooperative unit spans only ∼11 actin monomers (Geeves and Lehrer, 1994) and the structural change will not spread beyond the overlap region of filaments (see also Cantino et al., 1993; Swartz et al., 1996). It remains to be tested whether the small enhancement of the 6th ALL, which was observed upon activation of overstretched muscle (Kress et al., 1986; Yagi and Matsubara, 1988), represents the small fraction of thin filament regulatory units in the open state (20–25% in McKillop and Geeves, 1993) or represents a qualitatively distinct structural state of actin. The allosteric structural change of actin is being incorporated in recent models of thin filament regulation by calcium (e.g., Tobacman and Butters, 2000).
CONCLUSION
The comparison of static and dynamic x-ray diffraction patterns between living mouse and frog muscles led us to two major findings. One is that a small amount of stereospecific actomyosin complex is likely to be formed during contraction of mouse muscle. There is no evidence that this complex differs from the rigor complex in its configuration. The estimated fraction of myosin heads in this configuration is small and consistent with the result of other studies. In frog muscle the amount of such a stereospecific complex may be even smaller.
The other is that, in both muscles, the actin-based 7th, 6th, and outer 5th ALL's rose to a similar extent upon activation, despite the differences in the amount of the stereospecific actomyosin complex. The concerted rise of these reflections is best explained by a structural change of actin. The rise of the 6th ALL, which occurs without a shift of its peak position, seems to have at least three sources: 1), stereospecific binding of myosin (although this does not play a major role), 2), a structural change of actin induced by calcium binding to troponin, and 3), an allosteric structural change of actin due to myosin binding.
SUPPLEMENTARY MATERIAL
An online supplement to this article can be found by visiting BJ Online at http://www.biophysj.org. QuickTime movies for the time-resolved x-ray diffraction recordings of mouse and frog muscles are available. The combined 5th ALL/6th MLL is indicated by an arrow.
Supplementary Material
Acknowledgments
We thank Mr. T. Tamura for his help at the beamline and Ms. R. Ryu for her technical assistance.
This work was performed under approval of the SPring-8 Proposal Review Committee (proposal No. 2001B0185-NL-np) and supported by the SPring-8 Joint Research Promotion Scheme of Japan Science and Technology Corporation and Special Coordination Funds of the Ministry of Education, Culture, Sports, Science and Technology, Japan.
References
- Al-Khayat, H. A., N. Yagi, and J. M. Squire. 1995. Structural changes in actin-tropomyosin during muscle regulation: computer modelling of low-angle X-ray diffraction data. J. Mol. Biol. 252:611–632. [DOI] [PubMed] [Google Scholar]
- Bershitsky, S. Y., A. K. Tsaturyan, O. N. Bershitskaya, G. I. Mashanov, P. B. Brown, R. Burns, and M. A. Ferenczi. 1997. Muscle force is generated by myosin heads stereospecifically attached to actin. Nature. 388:186–190. [DOI] [PubMed] [Google Scholar]
- Blinks, J. R., R. Rüdel, and S. R. Taylor. 1978. Calcium transients in isolated skeletal muscle fibres: detection with aequorin. J. Physiol. 277:291–323. [DOI] [PMC free article] [PubMed] [Google Scholar]
- Bordas, J., G. P. Diakun, F. G. Diaz, R. A. Lewis, J. Lowy, G. R. Mant, M. L. Martin-fernandez, and E. Towns-Andrews. 1993. Two-dimensional time-resolved X-ray diffraction studies of live isometrically contracting frog sartorius muscle. J. Muscle Res. Cell Motil. 14:311–324. [DOI] [PubMed] [Google Scholar]
- Bordas, J., A. Svensson, M. Rothery, J. Lowy, G. P. Diakun, and P. Boesecke. 1999. Extensibility and symmetry of actin filaments in contracting muscle. Biophys. J. 77:3197–3207. [DOI] [PMC free article] [PubMed] [Google Scholar]
- Cantino, M. E., T. S. C. Allen, and A. M. Gordon. 1993. Subsarcomeric distribution of calcium in demembranated fibers of rabbit psoas muscle. Biophys. J. 64:211–222. [DOI] [PMC free article] [PubMed] [Google Scholar]
- Chothia, C., and J. Janin. 1975. Principles of protein-protein recognition. Nature. 256:705–708. [DOI] [PubMed] [Google Scholar]
- Coirault, C., D. Chemla, N. Pery-Man, I. Suard, and Y. Lecarpentier. 1995. Effects of fatigue on force-velocity relation of diaphragm. Energetic implications. Am. J. Respir. Crit. Care Med. 151:123–128. [DOI] [PubMed] [Google Scholar]
- Cooke, R., M. S. Crowder, and D. D. Thomas. 1982. Orientation of spin labels attached to cross-bridges in contracting muscle fibres. Nature. 300:776–778. [DOI] [PubMed] [Google Scholar]
- Cooke, R., and E. Pate. 1985. The effects of ADP and phosphate on the contraction of muscle fibers. Biophys. J. 48:789–798. [DOI] [PMC free article] [PubMed] [Google Scholar]
- Curtin, N. A., and K. A. P. Edman. 1994. Force-velocity relation for frog muscle fibres: effects of moderate fatigue and of intracellular acidification. J. Physiol. 475:483–494. [DOI] [PMC free article] [PubMed] [Google Scholar]
- Edman, K. A. P. 1979. The velocity of unloaded shortening and its relation to sarcomere length and isometric force in vertebrate muscle fibres. J. Physiol. 291:143–159. [DOI] [PMC free article] [PubMed] [Google Scholar]
- Fajer, P. G., E. A. Fajer, and D. D. Thomas. 1990. Myosin heads have a broad orientational distribution during isometric muscle contraction: time-resolved EPR studies using caged ATP. Proc. Natl. Acad. Sci. USA. 87:5538–5542. [DOI] [PMC free article] [PubMed] [Google Scholar]
- Fujisawa, T., K. Inoue, T. Oka, H. Iwamoto, T. Uruga, T. Kumasaka, Y. Inoko, N. Yagi, M. Yamamoto, and T. Ueki. 2000. Small-angle X-ray scattering station at the SPring-8 RIKEN beamline. J. Appl. Crystallogr. 33:797–800. [Google Scholar]
- Geeves, M. A., and S. S. Lehrer. 1994. Dynamics of the muscle thin filament regulatory switch: the size of the cooperative unit. Biophys. J. 67:273–282. [DOI] [PMC free article] [PubMed] [Google Scholar]
- Goldman, Y. E., and R. M. Simmons. 1977. Active and rigor muscle stiffness. J. Physiol. 269:55P–57P. [PubMed] [Google Scholar]
- Gu, J., S. Xu, and L. C. Yu. 2002. A model of cross-bridge attachment to actin in the A.M.ATP state based on X-ray diffraction from permeabilized rabbit psoas muscle. Biophys. J. 82:2123–2133. [DOI] [PMC free article] [PubMed] [Google Scholar]
- Haselgrove, J. C. 1975. X-ray evidence for conformational changes in the myosin filaments of vertebrate striated muscle. J. Mol. Biol. 92:113–143. [DOI] [PubMed] [Google Scholar]
- Haselgrove, J. C., and H. E. Huxley. 1973. X-ray evidence for radial cross-bridge movement and for the sliding filament model in actively contracting skeletal muscle. J. Mol. Biol. 77:549–568. [DOI] [PubMed] [Google Scholar]
- He, Z.-H., R. K. Chillingworth, M. Brune, J. E. T. Corrie, D. R. Trentham, M. R. Webb, and M. A. Ferenczi. 1997. ATPase kinetics on activation of rabbit and frog permeabilized isometric muscle fibres: a real time phosphate assay. J. Physiol. 501:125–148. [DOI] [PMC free article] [PubMed] [Google Scholar]
- Hill, A. V. 1938. The heat of shortening and the dynamic constants of muscle. Proc. R. Soc. Lond. B Biol. Sci. 126:136–195. [Google Scholar]
- Huxley, A. F. 1957. Muscle structure and theories of contraction. Prog. Biophys. Biophys. Chem. 7:255–318. [PubMed] [Google Scholar]
- Huxley, H. E. 1969. The mechanism of muscular contraction. Science. 164:1356–1365. [PubMed] [Google Scholar]
- Huxley, H. E. 1980. The movement of myosin cross-bridges during contraction. In Muscle Contraction: Its Regulatory Mechanisms. S. Ebashi, K. Maruyama, and M. Endo, editors. Japan Science Society Press, Tokyo. 33–43.
- Huxley, H. E., and W. Brown. 1967. The low-angle X-ray diagram of vertebrate striated muscle and its behaviour during contraction and rigor. J. Mol. Biol. 30:383–434. [DOI] [PubMed] [Google Scholar]
- Huxley, H. E., and M. Kress. 1985. Crossbridge behaviour during muscle contraction. J. Muscle Res. Cell Motil. 6:153–161. [DOI] [PubMed] [Google Scholar]
- Irving, M., T. S. C. Allen, C. Sabido-David, J. S. Craik, B. Brandmeier, J. Kendrick-Jones, J. E. T. Corrie, D. R. Trentham, and Y. E. Goldman. 1995. Tilting of the light-chain region of myosin during step length changes and active force generation in skeletal muscle. Nature. 375:688–691. [DOI] [PubMed] [Google Scholar]
- Irving, M., G. Piazessi, L. Lucii, Y.-B. Sun, J. J. Harford, I. M. Dobbie, M. A. Ferenczi, M. Reconditi, and V. Lombardi. 2000. Comformation of the myosin motor during force generation in skeletal muscle. Nat. Struct. Biol. 7:482–485. [DOI] [PMC free article] [PubMed] [Google Scholar]
- Iwamoto, H., T. Kobayashi, Y. Amemiya, and K. Wakabayashi. 1995. Effect of stretch and release on equatorial X-ray diffraction during a twitch contraction of frog skeletal muscle. Biophys. J. 68:227–234. [DOI] [PMC free article] [PubMed] [Google Scholar]
- Iwamoto, H., K. Oiwa, T. Suzuki, and T. Fujisawa. 2001. X-ray diffraction evidence for the lack of stereospecific protein interactions in highly activated actomyosin complex. J. Mol. Biol. 305:863–874. [DOI] [PubMed] [Google Scholar]
- Iwamoto, H., K. Oiwa, T. Suzuki, and T. Fujisawa. 2002. States of thin filament regulatory proteins as revealed by combined cross-linking/X-ray diffraction techniques. J. Mol. Biol. 317:707–720. [DOI] [PubMed] [Google Scholar]
- Iwamoto, H., T. Suzuki, and T. Fujisawa. 2000. Time-resolved two-dimensional X-ray diffraction study of the effect of shortening on activation of contracting skeletal muscle. Pflügers Arch. Eur. J. Physiol. 439:646–649. [DOI] [PubMed] [Google Scholar]
- Iwamoto, H., J. Wakayama, T. Tamura, T. Fujisawa, and N. Yagi. 2003. X-ray evidence for structural changes of thin filament induced by cycling myosin heads. Biophys. J. 84:248a. [Google Scholar]
- Kabsch, W., H. G. Mannherz, D. Suck, E. F. Pai, and K. C. Holmes. 1990. Atomic structure of the actin:DNase I complex. Nature. 347:37–44. [DOI] [PubMed] [Google Scholar]
- Kasprzak, A. A., R. Takashi, and M. F. Morales. 1988. Orientation of actin monomer in the F-actin filament: radial coordinate of glutamine-41 and effect of myosin subfragment 1 binding on the monomer orientation. Biochemistry. 27:4512–4522. [DOI] [PubMed] [Google Scholar]
- Kawai, M., and Y. Zhao. 1993. Cross-bridge scheme and force per cross-bridge state in skinned rabbit psoas muscle fibers. Biophys. J. 65:638–651. [DOI] [PMC free article] [PubMed] [Google Scholar]
- Kouyama, T., and K. Mihashi. 1981. Fluorimetry study of N-(1-Pyrenyl)iodoacetamide-labelled F-actin. Local structural change of actin promoter both on polymerization and on binding of heavy meromyosin. Eur. J. Biochem. 114:33–38. [PubMed] [Google Scholar]
- Kraft, T., T. Mattei, A. Radocaj, B. Piep, C. Nocula, M. Furch, and B. Brenner. 2002. Structural features of cross-bridges in isometrically contracting skeletal muscle. Biophys. J. 82:2536–2547. [DOI] [PMC free article] [PubMed] [Google Scholar]
- Kraft, T., S. Xu, B. Brenner, and L. C. Yu. 1999. The effect of thin filament activation on the attachment of weak binding cross-bridges: a two-dimensional X-ray diffraction study on single muscle fibers. Biophys. J. 76:1494–1513. [DOI] [PMC free article] [PubMed] [Google Scholar]
- Kress, M., H. E. Huxley, A. R. Faruqi, and J. Hendrix. 1986. Structural changes during activation of frog muscle by time-resolved X-ray diffraction. J. Mol. Biol. 188:325–342. [DOI] [PubMed] [Google Scholar]
- Kushmerick, M. J., T. S. Moerland, and R. W. Wiseman. 1992. Mammalian skeletal muscle fibers distinguished by contents of phosphocreatine, ATP, and Pi. Proc. Natl. Acad. Sci. USA. 89:7521–7525. [DOI] [PMC free article] [PubMed] [Google Scholar]
- Lorenz, M., D. Popp, and K. C. Holmes. 1993. Refinement of the F-actin model against X-ray fiber diffraction data by the use of a directed mutation algorithm. J. Mol. Biol. 234:826–836. [DOI] [PubMed] [Google Scholar]
- Maeda, Y., D. Popp, and S. M. McLaughlin. 1988. Cause of changes in the thin filament-associated reflexions on activation of frog muscle - myosin binding or conformational change of actin. Adv. Exp. Med. Biol. 226:381–390. [PubMed] [Google Scholar]
- Matsubara, I., N. Yagi, and H. Hashizume. 1975. Use of an X-ray television for diffraction of the frog striated muscle. Nature. 255:728–729. [DOI] [PubMed] [Google Scholar]
- Matsubara, I., N. Yagi, H. Miura, M. Ozeki, and T. Izumi. 1984. Intensification of the 5.9-nm actin layer line in contracting muscle. Nature. 312:471–473. [DOI] [PubMed] [Google Scholar]
- McKillop, D. F. A., and M. A. Geeves. 1993. Regulation of the interaction between actin and myosin subfragment 1: evidence for three states of the thin filament. Biophys. J. 65:693–701. [DOI] [PMC free article] [PubMed] [Google Scholar]
- Miki, M., and T. Kouyama. 1994. Domain motion in actin observed by fluorescence resonance energy transfer. Biochemistry. 33:10171–10177. [DOI] [PubMed] [Google Scholar]
- Miki, M., P. Wahl, and J.-C. Auchet. 1982. Fluorescence anisotropy of labeled F-actin: influence of divalent cations on the interaction between F-actin and myosin heads. Biochemistry. 21:3661–3665. [DOI] [PubMed] [Google Scholar]
- Moens, P. D. J., and C. G. dos Remedios. 1997. A conformational change in F-actin when myosin binds: fluorescence resonance energy transfer detects an increase in the radial coordinate of Cys-374. Biochemistry. 36:7353–7360. [DOI] [PubMed] [Google Scholar]
- Oosawa, F., S. Fujime, S. Ishiwata, and K. Mihashi. 1973. Dynamic property of F-actin and thin filament. Cold Spring Harb. Symp. Quant. Biol. 37:277–285. [Google Scholar]
- Orlova, A., and E. H. Egelman. 1995. Structural dynamics of F-actin: I. Changes in the C terminus. J. Mol. Biol. 245:582–597. [DOI] [PubMed] [Google Scholar]
- Orlova, A., and E. H. Egelman. 1997. Cooperative rigor binding of myosin to actin is a function of F-actin structure. J. Mol. Biol. 265:469–474. [DOI] [PubMed] [Google Scholar]
- Parry, D. A. D., and J. M. Squire. 1973. Structural role of tropomyosin in muscle regulation: analysis of the X-ray diffraction patterns from relaxed and contracting muscles. J. Mol. Biol. 75:33–55. [DOI] [PubMed] [Google Scholar]
- Perutz, M. F., H. Muirhead, J. M. Cox, and L. C. G. Goaman. 1968. Three-dimensional Fourier synthesis of horse oxyhaemoglobin at 2.8 Å resolution: the atomic model. Nature. 219:131–139. [DOI] [PubMed] [Google Scholar]
- Popp, D., Y. Maeda, A. A. E. Stewart, and K. C. Holmes. 1991. X-ray diffraction studies on muscle regulation. Adv. Biophys. 27:89–103. [DOI] [PubMed] [Google Scholar]
- Rayment, I., W. R. Rypniewski, B. Schmidt-Base, R. Smith, D. R. Tomchick, M. M. Benning, D. A. Winkelmann, G. Wesenberg, and H. M. Holden. 1993a. Three-dimensional structure of myosin subfragment-1: a molecular motor. Science. 261:50–58. [DOI] [PubMed] [Google Scholar]
- Rayment, I., H. M. Holden, M. Whittaker, C. B. Yohn, M. Lorenz, K. C. Holmes, and R. A. Milligan. 1993b. Structure of the actin-myosin complex and its implications for muscle contraction. Science. 261:58–65. [DOI] [PubMed] [Google Scholar]
- Swartz, D. R., R. L. Moss, and M. L. Greaser. 1996. Calcium alone does not fully activate the thin fiament for S1 binding to rigor myofibrils. Biophys. J. 71:1891–1904. [DOI] [PMC free article] [PubMed] [Google Scholar]
- Takebayashi, T., Y. Morita, and F. Oosawa. 1977. Electron microscopic investigation of the flexibility of F-actin. Biochim. Biophys. Acta. 492:357–363. [DOI] [PubMed] [Google Scholar]
- Takezawa, Y., D.-S. Kim, M. Ogino, Y. Sugimoto, T. Kobayashi, T. Arata, and K. Wakabayashi. 1999. Backward movements of cross-bridges by application of stretch and by binding of MgADP to skeletal muscle fibers in the rigor state as studies by X-ray diffraction. Biophys. J. 76:1770–1783. [DOI] [PMC free article] [PubMed] [Google Scholar]
- Tobacman, L. S., and C. A. Butters. 2000. A new model of cooperative myosin-thin filament binding. J. Biol. Chem. 275:27587–27593. [DOI] [PubMed] [Google Scholar]
- Tsaturyan, A. K. 2002. Diffraction by partially occupied helices. Acta Crystallogr. A58:292–294. [DOI] [PubMed] [Google Scholar]
- Vibert, P., R. Craig, and W. Lehman. 1997. Steric-model for activation of muscle thin filaments. J. Mol. Biol. 266:8–14. [DOI] [PubMed] [Google Scholar]
- Wakabayashi, T., T. Akiba, K. Hirose, A. Tomioka, M. Tokunaga, M. Suzuki, C. Toyoshima, K. Sutoh, K. Yamamoto, T. Matsumoto, K. Saeki, and Y. Amemiya. 1988a. Temperature-induced change of thick filament and location of the functional sites of myosin. Adv. Exp. Med. Biol. 226:39–48. [PubMed] [Google Scholar]
- Wakabayashi, K., Y. Ueno, Y. Amemiya, and H. Tanaka. 1988b. Intensity changes of actin-based layer lines from frog skeletal muscles during an isometric contraction. Adv. Exp. Med. Biol. 226:353–367. [PubMed] [Google Scholar]
- Wakabayashi, K., H. Tanaka, Y. Amemiya, A. Fujishima, T. Kobayashi, T. Hamanaka, H. Sugi, and T. Mitsui. 1985. Time-resolved X-ray diffraction studies on the intensity changes of the 5.9 and 5.1 nm actin layer lines from frog skeletal muscle during an isometric tetanus using synchrotron radiation. Biophys. J. 47:847–850. [DOI] [PMC free article] [PubMed] [Google Scholar]
- Wray, J. S. 1987. Structure of relaxed myosin filaments in relation to nucleotide state in vertebrate skeletal muscle. J. Muscle Res. Cell Motil. 8:62a. [Google Scholar]
- Yagi, N. 1992. Effects of N-ethylmaleimide on the structure of skinned frog skeletal muscles. J. Muscle Res. Cell Motil. 13:457–463. [DOI] [PubMed] [Google Scholar]
- Yagi, N. 1996. Labelling of thin filaments by myosin heads in contracting and rigor vertebrate skeletal muscles. Acta Crystallogr. D52:1169–1173. [DOI] [PubMed] [Google Scholar]
- Yagi, N., M. H. Ito, H. Nakajima, T. Izumi, and I. Matsubara. 1977. Return of myosin heads to thick filaments after muscle contraction. Science. 197:685–687. [DOI] [PubMed] [Google Scholar]
- Yagi, N., and I. Matsubara. 1988. Changes in the 5.9 nm actin layer-line on activation of frog skeletal muscles. Adv. Exp. Med. Biol. 226:369–380. [PubMed] [Google Scholar]
- Yagi, N., and I. Matsubara. 1989. Structural changes in the thin filament during activation studied by X-ray diffraction of highly stretched skeletal muscle. J. Mol. Biol. 208:359–363. [DOI] [PubMed] [Google Scholar]
- Yagi, N., S. Takemori, and M. Watanabe. 1993. An X-ray diffraction study of frog skeletal muscle during shortening near the maximum velocity. J. Mol. Biol. 231:668–677. [DOI] [PubMed] [Google Scholar]
- Yamada, T. 1998. 1H-nuclear magnetic resonance evidence for acto-myosin-dependent structural changes of the intracellular water of frog skeletal muscle fiber. Biochim. Biophys. Acta. 1379:224–232. [DOI] [PubMed] [Google Scholar]
- Yanagida, T., and F. Oosawa. 1978. Polarized fluorescence from ɛ-ADP incorporated into F-actin in a myosin-free single fiber: conformation of F-actin and changes induced in it by heavy meromyosin. J. Mol. Biol. 126:507–524. [DOI] [PubMed] [Google Scholar]
- Yates, L. D., and M. L. Greaser. 1983. Quantitative determination of myosin and actin in rabbit skeletal muscle. J. Mol. Biol. 168:123–141. [DOI] [PubMed] [Google Scholar]
- Zappe, H. A., and Y. Maeda. 1985. X-ray diffraction study of fast and slow mammalian skeletal muscle in the live relaxed state. J. Mol. Biol. 185:211–214. [DOI] [PubMed] [Google Scholar]
- Zhao, Y., and M. Kawai. 1994. Kinetic and thermodynamic studies of the cross-bridge cycle in rabbit psoas muscle fibers. Biophys. J. 67:1655–1668. [DOI] [PMC free article] [PubMed] [Google Scholar]
Associated Data
This section collects any data citations, data availability statements, or supplementary materials included in this article.