

Abstract
Phospholamban is an integral membrane protein that regulates the contractility of cardiac muscle by maintaining cardiomyocyte calcium homeostasis. Abnormalities in association of protein kinase A with PLB have recently been linked to human heart failure, where a single mutation is responsible for dilated cardiomyopathy. To date, a high-resolution structure of phospholamban in a lipid environment has been elusive. Here, we describe the first structure of recombinant, monomeric, biologically active phospholamban in lipid-mimicking dodecylphosphocholine micelles as determined by multidimensional NMR experiments. The overall structure of phospholamban is “L-shaped” with the hydrophobic domain approximately perpendicular to the cytoplasmic portion. This is in agreement with our previously published solid-state NMR data. In addition, there are two striking discrepancies between our structure and those reported previously for synthetic phospholamban in organic solvents: a), in our structure, the orientation of the cytoplasmic helix is consistent with the amphipathic nature of these residues; and b), within the hydrophobic helix, residues are positioned on two discrete faces of the helix as consistent with their functional roles ascribed by mutagenesis. This topology renders the two phosphorylation sites, Ser-16 and Thr-17, more accessible to kinases.
INTRODUCTION
Phospholamban, a 52-residue membrane protein, regulates myocardial contractility by direct physical interaction with Ca-ATPase, a 110-kDa enzyme that maintains calcium homeostasis in the sarcoplasmic reticulum. Since its discovery in the early 1970s as a regulator of cardiac contractility, the structure of PLB has been the subject of intense research and debate (MacLennan et al., 2002; Simmerman and Jones, 1998). To date, a high-resolution structure of full-length PLB (52 amino acids) has been elusive due to the hydrophobic nature of this protein and its propensity to aggregate. Structural insights have been gained from various mutagenesis, cross-linking, circular dichroism, Fourier transform infrared spectroscopy, electron paramagnetic resonance, and light-scattering studies (Thomas et al., 1998). The self-association of PLB is characterized by a dynamic monomer-pentamer equilibrium regulated by the phosphorylation of residues Ser-16 and Thr-17 (Thomas et al., 1998). It is the monomer that preferentially binds and inhibits the sarcoplasmic reticulum Ca-ATPase (Reddy et al., 1999). However, the mechanistic details of this protein-protein interaction remain obscure. In the widely accepted enzymatic mechanism, the Ca-ATPase undergoes a substantial transition from a high Ca2+ affinity (E1) to a low Ca2+ affinity (E2) conformation, with both phosphorylation and magnesium ATP complex binding to Ca-ATPase powering the calcium translocation process (Stokes and Wagenknecht, 2000). Based on gel electrophoresis in detergent solution (Arkin et al., 1997; Kimura et al., 1997) and on fluorescence resonance energy transfer experiments in membranes (Reddy et al., 1999), PLB is thought to assemble into a pentamer and to depolymerize into monomers before interacting with Ca-ATPase. Subsequently, the monomeric form of PLB inhibits calcium flux upon binding to the E2 form of the enzyme at submicromolar Ca2+. This inhibitory interaction is reversed by phosphorylation at Ser-16 and Thr-17 upon adrenergic stimulation of the cardiac myocyte (Tada and Kadoma, 1989).
Mutagenesis studies and coimmunoprecipitation assays suggest that the interaction between PLB and Ca-ATPase involves all three structural domains of PLB: domain IA, an amphipathic helix; domain IB, a short hinge; and domain II, a highly hydrophobic helix. In particular, these studies point out that PLB's inhibitory activity occurs via intramembranous interactions between a functionally discrete helical face of domain II and TM domains 4 and 6 of Ca-ATPase, with both domains IA and IB “fine-tuning” the inhibition by interacting with the stalk and the cytoplasmic domains of the enzyme (MacLennan et al., 1998; MacLennan and Toyofuku, 1986). The other face of the domain II helix is involved in the formation of PLB TM leucine zipper that stabilizes PLB pentamers (Karim et al., 1998; Simmerman et al., 1996).
Therefore, the regulation of the Ca-ATPase enzymatic cycle by PLB may involve both protein-protein and protein-lipid interactions. It is likely that PLB depolymerization occurs first, as PLB-PLB interactions in the pentamer are replaced by PLB-lipid interactions with a substantial change in PLB's conformation. Subsequently, PLB-lipid interactions are replaced by PLB-Ca-ATPase interactions, with PLB undergoing a further conformational change. A better understanding of all the possible stages of this complex mechanism requires the elucidation of both protein-protein and protein-lipid interactions at the atomic level.
The high-resolution x-ray crystal structures of the SERCA1a isoform of Ca-ATPase in its E1 and E2 forms, obtained by Toyoshima and co-workers, have revealed many interesting features of this complex enzyme, opening up the possibility of understanding the atomic details of its regulatory process (Toyoshima et al., 2000; Toyoshima and Nomura, 2002). In addition, electron microscopy of Ca-ATPase/PLB cocrystals has helped formulate several different mechanistic hypotheses that remain to be tested (Toyoshima et al., 1993). Although detailed information on the structure of Ca-ATPase has been obtained, a complete study of the interaction of PLB and lipids has not yet been published.
In our recent article, we have determined the topology of monomeric PLB in mechanically oriented lipid bilayers by solid-state NMR spectroscopy (Mascioni et al., 2002b). Our findings a), rule out the possibility of a continuous α-helical structure for unbound monomeric PLB; b), demonstrate that domain II is oriented approximately perpendicularly to the plane of the bilayers; and c), show that the cytosolic, amphipathic helix interacts with the lipid bilayer surface. The intent of the present article is to build on these results by elucidating the high-resolution solution structure of PLB and its interaction with a lipid environment. As with our previous studies, we have focused our investigation on a fully functional, monomeric PLB mutant in which the three TM cysteines have been replaced by A36, F41, and A46, respectively (AFA-PLB). These mutations destabilize the pentamer formation presumably by interfering with the packing interaction between the individual helices (Fujii et al., 1989; Simmerman et al., 1996; Karim et al., 1998, 2000). Our high-resolution structure of PLB in detergent micelles will be a natural complement to the results obtained by solid-state NMR spectroscopy and will help lay the groundwork for future studies of PLB/Ca-ATPase interactions.
METHODS
Expression and purification
A detailed protocol for recombinant production of phospholamban has been submitted elsewhere (Buck et al., 2003). In brief, Escherichia coli BL21(DE3) cells (Novagen, Darmstadt, Germany) were transformed using a modified MBP/AFA-PLB fusion construct (Invitrogen, Carlsbad, CA). The culture was grown by shaking overnight to OD600 of ∼1.0 at 250 rpm and 25°C. Cells were transferred (1:50) into standard M9 minimal media supplemented with vitamins and minerals (mineral mixture: 6 mg/L, CaCl2; 6 mg/L, FeSO4; 1 mg/L, MnCl2; 0.8 mg/L CoCl2; 0.7 mg/L, ZnSO4; 0.3 mg/L, CuCl2; 0.02 mg/L, H3BO3; 0.25 mg/L, (NH4)6MO7O24; 5 mg/L EDTA; vitamin mixture: 1 mg/L, calcium pentothenate; 1 mg/L, biotin; 1 mg/L, folic acid; 1 mg/L, niacinamide; 1 mg/L, pyridoxal phosphate) until an OD600 ∼1.0. Cells were induced with 1 mM IPTG and harvested after 6 h at 37°C. AFA-PLB pellets were resuspended on ice in 200-mL lysis buffer (20 mM PBS, pH 8.0, 120 mM NaCl, 1 mM EDTA, 0.1 mM DTT, 0.5% glycerol, 2 ug/mL pepstatin A, 2 μg/mL leupeptin, 2.5 μM lysozyme, 0.5 mM PMSF, 8 mM Triton X100). The suspension was then homogenized with a cell grinder and sonicated using a Branson Sonifier 450 (Branson Ultrasonic, Danbury, CT). Cells were pelleted by centrifugation at 18,000 rpm for 20 min at 4°C, and the supernatant was collected for further purification. AFA-PLB was purified to homogeneity with affinity chromatography using amylose resin (New England Biolabs, Beverly, MA), after cleavage with TEV protease and size exclusion chromatography with Sephacryl S-100 matrix (Pharmacia, Piscataway, NJ).
NMR spectroscopy
All NMR spectra were recorded using a Varian INOVA spectrometer (Varian, Palo Alto, CA) operating at 800 MHz at 50°C, with the exception of the exchange and topology data, which were acquired at 600 MHz. An inverse detection triple-resonance and triple-axis gradient probe was used. All the pulse sequences used were equipped with pulse field gradients for both coherence selection and sensitivity enhancement schemes. Quadrature detection was obtained using States-TPPI schemes. NMR samples were prepared by dissolving ∼2 mg (0.8 mM) of lyophilized PLB-AFA into 400 μL of 20 mM aqueous sodium phosphate buffer (pH 4.2) and 600 mM dodecylphosphocholine (Anatrace, Maumee, OH). 1H chemical shifts were referenced directly to 3-(trimethylsilyl)-1-propane-sulfonic acid sodium salt (Aldrich, Milwaukee, WI) at 0 ppm, whereas 15N and 13C were indirectly referenced (Wishart et al., 1995). Complete backbone assignment was determined using triple resonance experiments HNCA, HN(CO)CA, HNCACB, HN(CO)CACB, and HNCO. Side-chain chemical shifts were derived from 15N total correlation spectroscopy-HSQC with a mixing time of 70 ms and NOEs were obtained from 15N edited NOESY-HSQC experiments with a mixing time of 150 ms. NMR spectra were processed using NMRPipe (Delaglio et al., 1995) and analyzed using NMRView software (Merck, Whitehouse Station, NJ).
Hydrogen/deuterium exchange factors
15N uniformly labeled PLB-AFA samples were lyophilized and resuspended in solutions containing 10%, 30%, 50%, and 70% D2O, respectively, and the HSQC spectra were obtained after a fixed 30-min incubation period at room temperature. The intensities of the amide resonances in the HSQC spectra were measured using the NMRView software. The values were normalized to those found in the sample with 10% D2O. The peak intensities were plotted as a function of the mole fraction of H2O in the solution, and the exchange factors, χ, were determined using Eq. 1,
 |
(1) |
where y is the peak volume, C is a normalization factor, and X the mole fraction of H2O in the solution. The experiments were performed at 50°C and 37°C (Veglia et al., 2002).
PLB localization in DPC micelles
The localization of PLB relative to the micelle surface was established using paramagnetic relaxation agents, Mn2+, 5-, and 16-doxylstearic acid. By observing the line broadening of the amide resonances in the HSQC spectra and quantifying the percentage of signal retention due to the paramagnetic effect, it is possible to position the PLB relative to the micelle surface (Damberg et al., 2001). Upon addition to the DPC micellar solution, the Mn2+ causes a line broadening of the solvent-exposed residues. In the case of 5-doxylstearic acid, the aliphatic chains are buried in the micelle hydrocarbon region, whereas the radical group is placed closer to the micelle/water interface. For 16-doxylstearic acid, only the intensities of resonances buried in the micellar core are quenched. Incremental concentrations of Mn2+, 5-, and 16-doxylstearic acid in the range of 0.2–6.4 mM were used with a protein sample at 0.8 mM. For the final analysis, we chose concentrations of paramagnetic agents sufficient to observe a signal reduction of ∼50% for the most exposed residues.
Structure calculations
Structure calculations were performed using Xplor-NIH software (Brunger et al., 1998). We started our calculations from PLB in an extended structure (Nilges et al., 1988). Using the hybrid molecular dynamics SA protocol at a temperature of 4000 K (Stein et al., 1997), we generated 100 structures. Subsequently, these structures were refined using a further SA step and energy minimization. The final refinement was carried out using the “refine_gentle.inp” protocol, which gradually introduces the van der Waals radii. A total of 392 NOEs were classified in “strong” (1.8–2.8 Å), “medium” (1.8–3.5 Å), and “weak” (1.8 5.0 Å) NOEs and used in the structure calculations, of which 150 were intraresidue and 242 interresidue NOEs. A total of 29 hydrogen bond constraints were incorporated at the end of our preliminary calculations. Torsion angle restraints were obtained from TALOS (http://spin.niddk.nih.gov/bax/software/TALOS) using the chemical shift values of Cα, Cβ, C′, N, and Hα as inputs (Cornilescu et al., 1999). The few ambiguous angles found in the loop region were assigned an additional 60° of conformational freedom compared to their predicted values. Of the 100 structures generated, the 20 lowest energy structures were selected for further analysis. Those structures selected had no violations of a), NOE constraints higher than 0.5 Å; b), bond angles higher than 5°; and c), bond lengths higher than 0.05 Å. The covalent geometry of the conformers generated was determined using PROCHECK_NMR (Laskowski et al., 1998).
RESULTS
Assignments and constraints
As with all membrane-bound peptides and proteins, sample preparation is a key step in obtaining the high-resolution spectra of PLB. In our analysis of different experimental conditions, we found that PLB behaves well in both DPC and sodium dodecyl sulfate micelles, giving rise to very well-resolved and unique resonances for each of the amide sites. Since our optimized PLB sample in sodium dodecyl sulfate micelles gave 15N linewidths slightly larger than the sample in DPC micelles, we chose the latter for our structure determination. In an effort to optimize spectral resolution and sensitivity, several HSQC spectra were acquired in a range of 37–60°C. Only marginal chemical shift changes were observed for both the N- and C- termini and the more solvent-exposed residues (17–23), whereas the majority of the residues did not exhibit any chemical shift variation, demonstrating that the structure is essentially the same at all the temperatures analyzed. The best compromise for both resolution and sensitivity was found to be at 50°C, and we have chosen these conditions to carry out our NMR experiments.
The 1H/15N HSQC spectrum of PLB in DPC micelles is reported in Fig. 1. All the amide peaks were assigned using a combination of HNCA, HN(CO)CA, HNCACB, and CBCA(CO)NH experiments. Several strips from the 3D HNCACB “walk” are reported in Fig. 2. Due to the high quality of the spectra, the resonance assignment was straightforward, with the exception of residues R-14 and L-39, in which amide and Cα resonances are overlapped. This spectral ambiguity was resolved using the chemical shifts of the Cβ. The distinct secondary structural elements defined by the chemical shift indices of Hα, Cα, Cβ, and CO are indicated in Fig. 3.
FIGURE 1.

Fully assigned 1H/15N HSQC spectrum of AFA-PLB in 600 mM DPC micelles. The spectrum was recorded at 600 MHz at 50°C.
FIGURE 2.

Two-dimensional strips from three-dimensional 1H/15N/13C HNCACB spectrum of AFA-PLB in DPC micelles. The data were recorded at 800 MHz at 50°C. Residue numbers denote the sequential connectivities.
FIGURE 3.

Chemical shift index histograms of AFA-PLB obtained from triple resonance experiments (see Methods section).
The backbone-to-side chain NOEs were assigned using 1H/15N total correlation spectroscopy and NOESY-HSQC experiments. The crosspeak intensities resulting from the 1H/15N NOESY-HSQC experiments were then classified as “strong,” “medium”, or “weak” using the routine built in the NMRView software package (Johnson and Blevins, 1994). A summary of the NOE crosspeak pattern is given in Fig. 4. From the density dαN(i, i + 1), dNN(i, i + 1), and dβN(i, i + 1) NOE correlations, it is possible to identify three distinct regions: an N-terminal helix, encompassing residue 2–16; a short connecting loop from residues 17 through 21; and a third well-defined helical region from residues 22 through 50. The two regions encompassing residues 2–16 and 22–50 show a remarkable number of dαβ(i, i + 3), dαN(i, i + 3), and dαN(i, i + 4) typical of regular α-helices. A plot of the total number of NOEs per residue, including both backbone and side chains, is shown in Fig. 5.
FIGURE 4.

Summary of the backbone NOEs obtained from 1H/15N NOESY-HSQC experiments (top). Deuterium/proton exchange factors obtained for AFA-PLB in DPC micelles at 37°C and 50°C, respectively (bottom).
FIGURE 5.

Histogram illustrating the number of intra- and interresidue NOEs as a function of the residue. The asterisk denotes the presence of ambiguous NOEs that were not included in the structural calculations. However, their assignments were verified a posteriori.
Structure calculations
All the measured distances and predicted dihedral angles were subsequently modeled using SA calculations with the Xplor-NIH program. Of the 100 conformers generated from the simulated annealing calculations, the 20 lowest energy structures were selected for further refinement and analysis. None of the 20 structures analyzed showed NOE violations >0.5 Å or dihedral angle violations >5°. The Ramachandran plots generated using PROCHECK_NMR show that ∼86% of the residues fall into the most favored region, ∼12% into additional allowed regions, and <2% into generously allowed regions. No residues are in the disallowed regions (Table 1).
TABLE 1.
NMR-derived restraints and structural statistics for the 20 lowest energy conformers
| NOE, hydrogen bonds, and dihedrals | |||
| Total NOE | 392 | ||
| Intraresidue | 150 | ||
| Interresidue | 242 | ||
| Hydrogen bonds | 29 | ||
| Dihedral angles (Φ/Ψ) | 42 | ||
| Average energies (kcal mol−1) | Simulated annealing | Refinement | |
| Etot | 267.1 ± 12.6 | −654.4 ± 27.1 | |
| ENOE | 79.9 ± 3.9 | 81.5 ± 6.7 | |
| Ebond | 21.7 ± 1.24 | 21.5 ± 1.2 | |
| Eangle | 113.8 ± 8.1 | 115 ± 6.9 | |
| Eimproper | 21.9 ± 2.4 | 23.4 ± 2.6 | |
| EVDW | 25.6 ± 5.8 | 3.8 ± 12.8 | |
| Restraint violations | |||
| >0.5 Å | 0 | 0 | |
| RMSD (Å) | |||
| Superposition | Helix 1 | Loop | Helix 2 |
| Residues 2–16 | Residues 17–21 | Residues 22–50 | |
| Backbone | 0.36 ± 0.13 | 0.43 ± 0.19 | 0.48 ± 0.20 |
| Heavy atoms | 1.71 ± 0.28 | 1.31 ± 0.34 | 1.48 ± 0.19 |
| Ramachandran analysis | |||
| Residues in most favored regions | 86.2% | ||
| Residues in additional allowed regions | 12.2% | ||
| Residues in generously allowed regions | 1.6% | ||
| Residues in disallowed regions | 0% |
All the statistics were carried out using XPLOR software package (Brunger et al., 1998). Ramachandran analysis was carried out using PROCHECK_NMR.
From the Ramachandran plots of each single amino acid, it is possible to define the secondary structure segments. The cytoplasmic α-helical region (or domain IA) spans from Glu-2 to Ser-16. The short hinge (or domain IB) encompasses residues Thr-17 through Pro-21. Although located in regions typical of mobile loops, the φ and ψ angles of these residues do not fall into a typical β-turn conformation (type IV turn, see Fig. 7, bottom). The hydrophobic helix (or domain II) starts at residue Gln-22 and extends up to residue Met-50.
FIGURE 7.

Network of NOEs found in the loop region imposing the “L-shape” topology on AFA-PLB in micelles and the corresponding distribution of φ and ψ angles defining the turn.
The juxtaposition of the backbones of the 20 lowest energy three-dimensional structures generated using simulated annealing calculations is reported in Fig. 6 A. By fitting the backbone Cα atoms of the overall structures with the exception of the termini (residues 2–50), the RMSD is 3.4 Å for the backbone atoms and 4.5 Å for the side chains. This relatively high RMSD is due to the flexible hinge connecting the two helical domains. For the Cα atoms of domain IA (residues 2–16), the calculated RMSDs are 0.36 and 1.71 Å for the backbone and side chains, respectively. Superimposing domain II (residues 22–50), RMSDs of 0.48 and 1.48 Å are obtained for the backbone and side chains, respectively. Fig. 6 shows the superposition of the lowest energy conformers for the overall structures (Fig. 6 A) and for the individual domains (Fig. 6, B–D). The loop (Thr-17–Pro-21) determines the “L-shape” form of phospholamban. The network of NOEs found in the loop region is depicted in Fig. 7. Several NOEs found in this region, particularly those involving Met-20 and Pro-21, were classified as ambiguous and were not included in the final calculations. However, their assignments were verified a posteriori and found consistent with the conformers generated.
FIGURE 6.

Stereo view of the superposition of the 20 lowest energy structures of AFA-PLB: (A) Backbone representation of the 20 conformers (superposition of residues 2–50). (B) Superposition of residues 2–16 of domain IA of AFA-PLB. (C) Superposition of residues 17–21 of the flexible loop domain IB. (D) Superposition of residues 22–50 of domain II of AFA-PLB.
Exchange factors
The hydrogen/deuterium (H/D) exchange factor method was used to analyze the hydrogen bonds (Veglia et al., 2002). Exchange factors reveal in more detail the nature and strength of hydrogen bonds than do the classical H/D kinetic methods, distinguishing both TM and in-plane helical domains of membrane proteins solubilized in lipid micelles. Our results for PLB in DPC micelles are reported in Fig. 4, where the values of exchange factors versus residues are reported. The bar histogram of exchange factors for PLB obtained at 37°C and 50°C show that the resonances located between residues 33 and 52 have the lowest exchange factors, with an average exchange factor (χav) of ∼0.3, whereas the region between residues 21 and 32 is more solvent-exposed with a value of χav ∼ 1.0. The residues located in the cytoplasmic region of PLB (4–18) have a value of χav ∼ 1.3, which is typical of helices absorbed on the surface of micelles (Veglia et al., 2002), with a gradual decrease in value going from residues 5 through 19.
The difference in χ values throughout domain II of phospholamban (residues 21–32 vs. 33–52 ) can be explained by the partial embedding of this domain into the micelle. The paramagnetic quenching data (see the following section) support this interpretation. In fact, residues 21–32 are less hydrophobic and most likely positioned at the interface between the detergent head groups and the bulk solvent. This location renders these residues more susceptible to H/D exchange than the hydrophobic residues 33–52.
Positioning in micelles
To probe the topological orientation of PLB in detergent micelles, we used three different paramagnetic relaxation agents: a), Mn2+; b), 5-doxyl stearic acid; and c), 16-doxyl stearic acid. Manganese ions were used to probe solvent-exposed residues, whereas both 5-doxyl and 16-doxyl stearic acids were used for membrane-embedded residues (Damberg et al., 2001). Our results are summarized in Fig. 8. Mn2+ ions cause a reduction in the resonance intensities of residues located at both termini and in the flexible hinge (Fig. 8 A). The effect is more pronounced at Mn2+/protein ratios >3:1, where most of the solvent-exposed residues are totally quenched (Fig. 8 B). Although Ser-16 and Thr-17 do not completely disappear at Mn2+/protein ratios <3:1, their intensities are dramatically reduced. At Mn2+/protein ratios >3:1, both Ser-16 and Thr-17 resonances are completely quenched, demonstrating that these phosphorylation sites are solvent-exposed (Fig. 8 B).
FIGURE 8.

Paramagnetic quenching obtained for AFA-PLB in DPC micelles using Mn2+ and 16-doxyl stearic acid. (A) Intensity retention plot for AFA-PLB in the presence of 0.8 mM of MnCl2 (1:1 Mn2+/protein molar ratio). (B) Intensity retention plot for AFA-PLB in the presence of 2.4 mM of MnCl2 (3:1 Mn2+/protein molar ratio). (C) Intensity retention plot for AFA-PLB in the presence of 3.2 mM of 16-doxyl stearic acid (4:1 16-doxyl stearic acid/protein molar ratio). (D) Intensity retention plot for AFA-PLB in the presence of 6.4 mM of 16-doxyl stearic acid (1:8 16-doxyl stearic acid/protein molar ratio). (E) Surface plot of AFA-PLB illustrating solvent-exposed (coral) and buried (green) residues for histograms in A and C. (F) Electrostatic potential plot of AFA-PLB showing the hydrophobic patch centered at Leu-7.
On the other hand, 5-doxyl and 16-doxyl stearic acids cause a reduction in the resonance intensities of amino acids located in the proximity of the micellar core. Although this effect is only marginal for 5-doxyl, the addition of 16-doxyl stearic acid caused a dramatic change in the resonance intensities of these residues. In particular, with a 16-doxyl stearic acid/PLB ratio of 4:1, we measured a substantial reduction in the intensities of domain II (Fig. 8 C). Interestingly, the intensity of Leu-7, which is located in domain IA, is also reduced by the addition of 16-doxyl stearic acid. Taken with the low χ value for Leu-7, this result indicates that Leu-7 is most likely buried in the hydrocarbon region of the micelles. These effects are even more apparent with a 16-doxyl stearic acid/PLB ratio of 8:1. Under these experimental conditions, all the resonances of the TM domain disappear and some of the resonances of domain IA are also considerably reduced (Fig. 8 D). Other resonances of the cytoplasmic domains such as Tyr-6, Thr-8, and Ala-11 and the flexible loop are only slightly reduced by the interaction with 16-doxyl stearic acid. The two phosphorylation sites (Ser-16 and Thr-17) are not influenced by addition of either 5-doxyl or 16-doxyl stearic acid (Fig. 8 C), providing further evidence that these residues are solvent-exposed. Moreover, in the presence of 16-doxyl stearic acid, there is a noticeable periodicity of the resonance intensities for the cytoplasmic helix (Fig. 8 C). The most quenched residues point toward the micellar core, whereas the less quenched residues face the bulk solvent, demonstrating that this domain is indeed absorbed on the surface of the micelle.
Fig. 8 E summarizes the paramagnetic quenching results as a surface plot of AFA-PLB highlighting solvent-exposed and buried residues. These data are consistent with the electrostatic potential plot of this molecule illustrated in Fig. 8 F.
In light of the H/D exchange factors and our topological studies with paramagnetic agents, we have further analyzed the lowest-energy structures generated from the simulated annealing calculations. Among the 20 conformers, 14 show the side chains of all the hydrophobic amino acids of domain IA (Val-4, Leu-7, Ala-11, and Ala-15) oriented toward the interior of the micelles (Fig. 9), whereas the remainder of the structures exhibit a less-defined orientation for those residues. These 14 structures are in best agreement with both our topological studies and the amphipathic character of domain IA.
FIGURE 9.
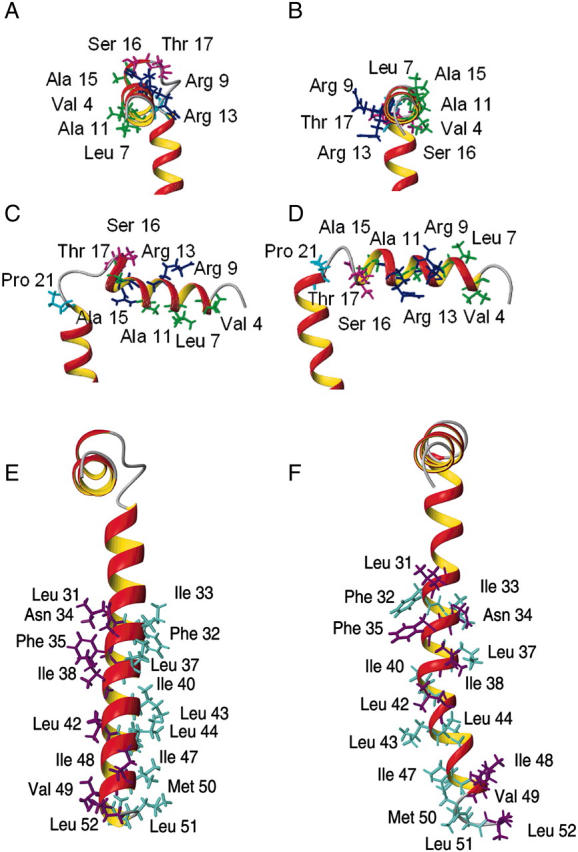
(A, C, and E) Ribbon representation of the minimized average structure of AFA-PLB in DPC micelles (B, D, and F) compared to that in organic solvent. The structure in DPC (A and C) exhibits all the hydrophobic residues of the cytoplasmic domain (green) facing the micellar interior and the hydrophilic residues (blue), including the phosphorylation sites Ser-16 and Thr-17 (magenta), pointing toward the bulk solvent. This is not the case for the structure in organic solvent (B and D). Concomitantly, the residues of domain II, defined by mutagenesis studies to enhance (aqua) or reduce (violet) monomer formation and inhibitory activity, are aligned on two discrete faces for the AFA-PLB structure in DPC micelles (E) but interspersed for the structure in organic solvent (F).
DISCUSSION
Given its remarkable biological importance and its relatively small size, PLB has been the benchmark used by many theoretical and experimental studies of membrane protein structure and assembly. Solution NMR studies in organic mixtures have shown that PLB adopts an “L-shape” structure with the intervening domain IB in either a short flexible turn or a β-turn type III conformation (Lamberth et al., 2000; Pollesello et al., 1999). In both reported structures, the interhelical angle between domain II and domain IB was found to be 68 ± 23°. Spectroscopic and modeling studies have also produced two rather different structural models of pentameric PLB. In the first model, PLB is composed of two α-helices connected by a small intervening β-sheet, with domain IA tilted at 50–60° relative to the bilayer surface (Tatulian et al., 1995). In the second model, full-length PLB has a continuous α-helix of ∼40 amino acids with a tilt of 28 ± 6° with respect to the bilayer (Arkin et al., 1995; Smith et al., 2001).
There are major differences between the structures of PLB obtained previously in organic solvents versus the present structure in DPC micelles. These structures differ in a), the lengths of each individual domain; b), the orientation of the cytoplasmic helix with respect to the lipid phase; and c), conformation of the TM domain. In principle, these might be considered only subtle structural discrepancies. However, these topological differences have substantial implications for the interpretation of biological data for this important membrane protein. The helix of domain IA for the structure of monomeric PLB in trifluoroethanol spans residues 3–18, whereas in the chloroform/methanol mixture this helix spans residues 4–16. Under our experimental conditions, we found that domain IA spans residues 2–16 with Thr-17 at the beginning of the structured loop. Domain IB plays an important role in the association with Ca-ATPase. In our structural model, domain IB forms a type-IV β-turn. Our results are in agreement with the structure in trifluoroethanol (residues 18–21) describing the loop as a “turn”, whereas in chloroform/methanol the loop comprises residues 17–20 and forms a type-III β-turn. We also found that Pro-21 is positioned in the flexible hinge, breaking the helical conformation, whereas in the chloroform/methanol structure, Pro-21 is part of the TM domain. Both structural models obtained in organic solvents show two phosphorylation sites (Ser-16 and Thr-17) facing domain II that are postulated to be directly in contact with the polar headgroups of the membranes. On the contrary, in our model, both Ser-16 and Thr-17 side chains are oriented away from the lipid water interface and contact the bulk solvent where they are more accessible to interaction with cAMP-dependent protein kinases (PKA) and calmodulin-dependent kinase, respectively. Similarly, the two arginine residues (Arg-9 and Arg-13) face domain II in the structures obtained in organic solvents, whereas they are oriented toward the bulk solvent in our structure. Furthermore, in our model the orientation of domain IA matches the amphipathic character of the helix, placing the charged side chains toward the bulk solvent and the hydrophobic residues toward the lipid phase (Fig. 9, A–D). Finally, in the chloroform/methanol structure the TM domain presents a notable kink that disrupts the discrete helical faces defined by the mutagenesis studies (Kimura et al., 1997; MacLennan et al., 1998; Simmerman et al., 1996). Remarkably, in our structure the orientation of the side chains in domain II is in very good agreement with both these mutagenesis studies and the proposed pentamer model (Karim et al., 1998) (Fig. 9, E and F). The ribbon diagram shows that all the “hot-spots” (violet) responsible for the interactions with the Ca-ATPase lie on the same face of the TM domain, whereas the opposite face of domain II comprises residues directly involved in the oligomerization process (aqua). These functional data are not confirmed in the structure in chloroform/methanol.
Structural studies carried out on wild-type PLB in more biologically relevant environments suggest that PLB forms a single, continuous α-helix (Smith et al., 2001). It is plausible that the authors measured the conformation of PLB in the pentameric state, whereas in its monomeric form PLB undergoes a conformational change that favors its interactions with lipids. The dynamic equilibrium of PLB monomer/pentamer formation and monomer/Ca-ATPase interaction awaits further investigation.
This “L-shape” conformation of PLB in micelles and the interhelical angle found between domain IA and domain II agree with our previous results obtained from solid-state NMR experiments on PLB in oriented lipid bilayers (Mascioni et al., 2002b). Taken with the structure of sarcolipin (Mascioni et al., 2002a), a PLB homolog in skeletal muscle, these results support the hypothesis that intramembrane regulatory interaction with Ca-ATPase is due to a specific face of each of these small proteins, underscoring the importance of understanding PLB-lipid interactions as a first stage before its reversible interactions with Ca-ATPase.
In summary, we report here the first structure of monomeric PLB obtained in a membrane-mimicking environment in the absence of organic solvent. This functional, monomeric form of PLB has been overexpressed and purified from E. coli bacteria. Multidimensional NMR experiments show that PLB comprises three distinct domains: domain IA (residues 2–16), domain IB (residues 17–21), and domain II (residues 22–50). In DPC micelles, PLB possesses an “L-shaped” conformation with an interhelical angle of 80.3 ± 21.6°. The hydrogen bond analysis carried out using exchange factors shows that domain II has a strong network of hydrogen bonds, whereas the cytoplasmic domain IA has a “weaker” helix as shown by the higher values of the exchange factors. In addition, the use of paramagnetic probes such as Mn2+, 5-doxyl, and 16-doxyl stearic acid allowed us to establish the orientation of domain IA with respect to the DPC micelles. Our results contradict the structures determined in organic mixtures but are consistent with the amphipathic character of the cytoplasmic domain. In our structure, most of the hydrophilic residues point toward the bulk solvent, whereas the hydrophobic residues are oriented toward the hydrocarbon region of the micellar core. This particular orientation allows the two phosphorylation sites to be more exposed for interaction with their respective protein kinases. Ser-16 is phosphorylated via PKA. Recently, Seidman and co-workers proposed a model for human heart failure caused by a single amino acid mutation, R9C, in PLB. Their findings indicate that this mutant may sequester PKA, rendering it inactive and thus decreasing the overall levels of PLB phosphorylation (Schmitt et al., 2003). The mechanism by which PKA interacts with this region of phospholamban could be a prime target for therapeutic intervention strategies. Finally, in our structural model domain II shows a remarkable correlation with previous mutagenesis studies, reporting the existence of two discrete helical faces: one responsible for PLB's oligomerization and the other involved in the interaction with Ca-ATPase.
Acknowledgments
The authors thank R. Di Fonzo for helpful comments; D. Live and B. Ostrowski for assisting with the NMR experiments; T. Krick and Dr. L.A. Higgins for assistance in the Facility for Mass Spectrometry in the Life Sciences at the University of Minnesota; and C. Karim and T. Kirby for helpful discussions. We benefited from the outstanding facilities at the Minnesota High-Field NMR Center in the Department of Biochemistry, Molecular Biology, and Biophysics, University of Minnesota. NMR instrumentation was provided with funds from the National Science Foundation (BIR-961477) and the University of Minnesota Medical School. The coordinates for all phospholamban conformers have been deposited in the Protein Data Bank database (http://www.rcsb.org/pdb/index.html); PDB ID code: 1N7L.
This work was supported in part by grants to G.V. (National Institutes of Health GM64742; American Heart Association 0160465Z), and D.D.T. (National Institutes of Health GM27906; University of Minnesota Academic Health Center).
Abbreviations used: PLB, phospholamban; Ca-ATPase, calcium ATPase; DPC, dodecylphosphocholine; HSQC, heteronuclear single quantum coherence; NOESY, nuclear Overhauser effect spectroscopy; RMSD, root mean square deviation; SA, simulated annealing; and TM, transmembrane.
References
- Arkin, I. T., P. D. Adams, A. T. Brunger, S. O. Smith, and D. M. Engelman. 1997. Structural perspectives of phospholamban, a helical transmembrane pentamer. Annu. Rev. Biophys. Biomol. Struct. 26:157–179. [DOI] [PubMed] [Google Scholar]
- Arkin, I. T., M. Rothman, C. F. Ludlam, S. Aimoto, D. M. Engelman, K. J. Rothschild, and S. O. Smith. 1995. Structural model of the phospholamban ion channel complex in phospholipid membranes. J. Mol. Biol. 248:824–834. [DOI] [PubMed] [Google Scholar]
- Buck, B., J. Zamoon, T. L. Kirby, T. M. DeSilva, C. Karim, D. Thomas, and G. Veglia. 2003. Overexpression, purification and characterization of recombinant Ca-ATPase regulators for high-resolution solution and solid-state NMR studies. Prot. Exp. Pur. 30:253–261. [DOI] [PubMed] [Google Scholar]
- Brunger, A. T., P. D. Adams, G. M. Clore, W. L. DeLano, P. Gros, R. W. Grosse-Kunstleve, J. S. Jiang, J. Kuszewski, M. Nilges, N. S. Pannu, R. J. Read, L. M. Rice, T. Simonson, and G. L. Warren. 1998. Crystallography & NMR system: a new software suite for macromolecular structure determination. Acta Crystallogr. D. Biol. Crystallogr. 54:905–21. [DOI] [PubMed] [Google Scholar]
- Cornilescu, G., F. Delaglio, and A. Bax. 1999. Protein backbone angle restraints from searching a database for chemical shift and sequence homology. J. Biomol. NMR. 13:289–302. [DOI] [PubMed] [Google Scholar]
- Damberg, P., J. Jarvet, and A. Graslund. 2001. Micellar systems as solvents in peptide and protein structure determination. Methods Enzymol. 339:271–285. [DOI] [PubMed] [Google Scholar]
- Delaglio, F., S. Grzesiek, G. W. Vuister, G. Zhu, J. Pfeifer, and A. Bax. 1995. NMRPipe: a multidimensional spectral processing system based on UNIX pipes. J. Biomol. NMR. 6:277–293. [DOI] [PubMed] [Google Scholar]
- Fujii, J., K. Maruyama, M. Tada, and D. H. MacLennan. 1989. Expression and site-specific mutagenesis of phospholamban: studies of residues involved in phosphorylation and pentamer formation. J. Biol. Chem. 264:12950–12955. [PubMed] [Google Scholar]
- Johnson, B. A., and R. A. Blevins. 1994. NMRView: a computer program for the visualization and analysis of NMR data. J. Biomol. NMR. 4:603–614. [DOI] [PubMed] [Google Scholar]
- Karim, C. B., C. G. Marquardt, J. D. Stamm, G. Barany, and D. D. Thomas. 2000. Synthetic null-cysteine phospholamban analogue and the corresponding transmembrane domain inhibit the Ca-ATPase. Biochemistry. 39:10892–10897. [DOI] [PubMed] [Google Scholar]
- Karim, C. B., J. D. Stamm, J. Karim, L. R. Jones, and D. D. Thomas. 1998. Cysteine reactivity and oligomeric structures of phospholamban and its mutants. Biochemistry. 37:12074–12081. [DOI] [PubMed] [Google Scholar]
- Kimura, Y., K. Kurzydlowski, M. Tada, and D. H. MacLennan. 1997. Phospholamban inhibitory function is activated by depolymerization. J. Biol. Chem. 272:15061–15064. [DOI] [PubMed] [Google Scholar]
- Lamberth, S., H. Schmidt, M. Muenchbach, T. Vorherr, J. Krebs, E. Carafoli, and C. Griesinger. 2000. NMR solution structure of phospholamban. Helv. Chim. Acta. 83:2141–2152. [Google Scholar]
- Laskowski, R. A., M. W. MacArthur, and J. M. Thornton. 1998. Validation of protein models derived from experiment. Curr. Opin. Struct. Biol. 8:631–639. [DOI] [PubMed] [Google Scholar]
- MacLennan, D. H., M. Abu-Abed, and C. Kang. 2002. Structure-function relationships in Ca(2+) cycling proteins. J. Mol. Cell. Cardiol. 34:897–918. [DOI] [PubMed] [Google Scholar]
- MacLennan, D. H., Y. Kimura, and T. Toyofuku. 1998. Sites of regulatory interaction between calcium ATPase and phospholamban. Ann. N. Y. Acad. Sci. 853:31–42. [DOI] [PubMed] [Google Scholar]
- MacLennan, D. H., and T. Toyofuku. 1986. Regulatory interactions between calcium ATPases and phospholamban. Soc. Gen. Physiol. Ser. 51:89–103. [PubMed] [Google Scholar]
- Mascioni, A., C. Karim, G. Barany, D. D. Thomas, and G. Veglia. 2002a. Structure and orientation of sarcolipin in lipid environments. Biochemistry. 41:475–482. [DOI] [PubMed] [Google Scholar]
- Mascioni, A., C. Karim, J. Zamoon, D. D. Thomas, and G. Veglia. 2002b. Solid-state NMR and rigid body molecular dynamics to determine domain orientations of monomeric phospholamban. J. Am. Chem. Soc. 124:9392–9393. [DOI] [PubMed] [Google Scholar]
- Nilges, M., A. M. Gronenborn, A. T. Brunger, and G. M. Clore. 1988. Determination of three-dimensional structures of proteins by simulated annealing with interproton distance restraints: application to crambin, potato carboxypeptidase inhibitor and barley serine proteinase inhibitor 2. Protein Eng. 2:27–38. [DOI] [PubMed] [Google Scholar]
- Pollesello, P., A. Annila, and M. Ovaska. 1999. Structure of the 1–36 amino-terminal fragment of human phospholamban by nuclear magnetic resonance and modeling of the phospholamban pentamer. Biophys. J. 76:1784–1795. [DOI] [PMC free article] [PubMed] [Google Scholar]
- Reddy, L. G., L. R. Jones, and D. D. Thomas. 1999. Depolymerization of phospholamban in the presence of calcium pump: a fluorescence energy transfer study. Biochemistry. 38:3954–3962. [DOI] [PubMed] [Google Scholar]
- Schmitt, J. P., M. Kamisago, M. Asahi, G. H. Li, F. Ahmad, U. Mende, E. G. Kranias, D. H. MacLennan, J. G. Seidman, and C. E. Seidman. 2003. Dilated cardiomyopathy and heart failure caused by a mutation in phospholamban. Science. 299:1410–1413. [DOI] [PubMed] [Google Scholar]
- Simmerman, H. K., and L. R. Jones. 1998. Phospholamban: protein structure, mechanism of action, and role in cardiac function. Physiol. Rev. 78:921–947. [DOI] [PubMed] [Google Scholar]
- Simmerman, H. K., Y. M. Kobayashi, J. M. Autry, and L. R. Jones. 1996. A leucine zipper stabilizes the pentameric membrane domain of phospholamban and forms a coiled-coil pore structure. J. Biol. Chem. 271:5941–5946. [DOI] [PubMed] [Google Scholar]
- Smith, S. O., T. Kawakami, W. Liu, M. Ziliox, and S. Aimoto. 2001. Helical structure of phospholamban in membrane bilayers. J. Mol. Biol. 313:1139–1148. [DOI] [PubMed] [Google Scholar]
- Stein, E. G., L. M. Rice, and A. T. Brunger. 1997. Torsion-angle molecular dynamics as a new efficient tool for NMR structure calculation. J. Magn. Reson. 124:154–164. [DOI] [PubMed] [Google Scholar]
- Stokes, D. L., and T. Wagenknecht. 2000. Calcium transport across the sarcoplasmic reticulum: structure and function of Ca2+-ATPase and the ryanodine receptor. Eur. J. Biochem. 267:5274–5279. [DOI] [PubMed] [Google Scholar]
- Tada, M., and M. Kadoma. 1989. Regulation of the Ca2+ pump ATPase by cAMP-dependent phosphorylation of phospholamban. Bioessays. 10:157–163. [DOI] [PubMed] [Google Scholar]
- Tatulian, S. A., L. R. Jones, L. G. Reddy, D. L. Stokes, and L. K. Tamm. 1995. Secondary structure and orientation of phospholamban reconstituted in supported bilayers from polarized attenuated reflection FTIR spectroscopy. Biochemistry. 34:4448–4456. [DOI] [PubMed] [Google Scholar]
- Thomas, D. D., L. G. Reddy, C. B. Karim, M. Li, R. Cornea, J. M. Autry, L. R. Jones, and J. Stamm. 1998. Direct spectroscopic detection of molecular dynamics and interactions of the calcium pump and phospholamban. Ann. N. Y. Acad. Sci. 853:186–194. [DOI] [PubMed] [Google Scholar]
- Toyoshima, C., M. Nakasako, H. Nomura, and H. Ogawa. 2000. Crystal structure of the calcium pump of sarcoplasmic reticulum at 2.6 Å resolution. Nature. 405:647–655. [DOI] [PubMed] [Google Scholar]
- Toyoshima, C., and H. Nomura. 2002. Structural changes in the calcium pump accompanying the dissociation of calcium. Nature. 418:605–611. [DOI] [PubMed] [Google Scholar]
- Toyoshima, C., H. Sasabe, and D. L. Stokes. 1993. Three-dimensional cryo-electron microscopy of the calcium ion pump in the sarcoplasmic reticulum membrane. Nature. 362:469–471. [DOI] [PubMed] [Google Scholar]
- Veglia, G., A. C. Zeri, C. Ma, and S. J. Opella. 2002. Deuterium/hydrogen exchange factors measured by solution nuclear magnetic resonance spectroscopy as indicators of the structure and topology of membrane proteins. Biophys. J. 82:2176–2183. [DOI] [PMC free article] [PubMed] [Google Scholar]
- Wishart, D. S., C. G. Bigam, J. Yao, F. Abildgaard, H. J. Dyson, E. Oldfield, J. L. Markley, and B. D. Sykes. 1995. 1H, 13C and 15N chemical shift referencing in biomolecular NMR. J. Biomol. NMR. 6:135–140. [DOI] [PubMed] [Google Scholar]