Abstract
A method is presented for determining second virial coefficients (B2) of protein solutions from retention time measurements in size exclusion chromatography. We determine B2 by analyzing the concentration dependence of the chromatographic partition coefficient. We show the ability of this method to track the evolution of B2 from positive to negative values in lysozyme and bovine serum albumin solutions. Our size exclusion chromatography results agree quantitatively with data obtained by light scattering.
INTRODUCTION
It is well known in size exclusion liquid chromatography (SEC) that the solute retention time depends sensitively on the solute's size, although no universal calibration for SEC has yet been achieved. It has also been realized that thermodynamic nonideality leads to concentration-dependent retention times (Nichol et al., 1978). Such dependence can be utilized to quantify the second osmotic virial coefficient, B2.
For a nonideal solution, the osmotic pressure Π can be written as a power series expansion in the solute number density ρ (Hill, 1960):
 |
(1) |
In Eq. 1, T is the absolute temperature and kB is Boltzmann's constant. All terms higher than first order in density represent nonideality.
The second virial coefficients of protein solutions have generated a great deal of interest since George and Wilson (1994) showed a correlation between protein crystallizability and B2. Their work demonstrated that many proteins crystallize in conditions where the second osmotic virial coefficient becomes slightly negative, indicating net attractive interactions between protein molecules. The most prevalent experimental procedure for measuring B2 is light scattering (LS). Additionally, sedimentation equilibrium (Behlke and Ristau, 1999), osmometry (Moon at al., 2000), neutron (Velev et al., 1998), and x-ray scattering (Bonnete et al., 1999), and self-interaction chromatography (Tessier et al., 2002) have been employed to quantify protein solution nonideality.
Nichol et al. (1978) showed the possibility of measuring B2 with frontal elution liquid chromatography. Although frontal chromatography (Nichol et al., 1978; Wills et al., 1980) allows one to fix the solute concentration in the column directly, it requires a large amount of protein (∼0.5 g) and long experiment times (∼3 h per column run). In this study, we extend their method to pulse size exclusion high-performance liquid chromatography (HPLC), where a small amount of protein is injected into and subsequently flows down the column. This adaptation drastically reduces the amount of protein (<25 mg) and time needed (∼15 min per column run) to measure B2 by SEC. We show that our results for B2 obtained with size exclusion chromatography agree well with those from frontal chromatography and from light-scattering measurements. We also demonstrate that SEC can track the evolution of B2 from positive to negative values.
THEORY
For the reader's convenience, we reproduce the theory of Nichol et al. (1978). We assume a balance of the solute, i.e., protein, chemical potentials (μp and μi) between the stationary and mobile phases as the solute is transported through the column. The pore volume (i.e., stationary phase) is labeled with the subscript p, and the interpore volume (i.e., mobile phase) with the subscript i. Equilibrium requires μp = μi. We write these chemical potentials by including the standard part μo, the ideal term, and a term accounting for thermodynamic nonideality through the activity coefficient γ:
 |
 |
where Ci,p are the local solute weight concentrations, R is the universal gas constant, and γp(Cp) and γi(Ci) are the thermodynamic activity coefficients of solute molecules in the pore and interpore volumes, respectively. Rearrangement of these equations yields:
 |
(2) |
where K0 is the partition coefficient of solute molecules between chromatographic phases in the limit of infinite dilution. The relation between weight concentration, C, and number density, ρ, is  . NA is Avogadro's number and Mw is the solute molecular mass. Nichol et al. (1978) made a virial expansion of the activity coefficients
 |
(3) |
We note that this consideration assumes no difference in the solute-solute interactions in the mobile and stationary phases. The local solute distribution coefficient is  . If KD is independent of concentration, as is the case for pulse chromatography with B2 = 0, or if the concentration is constant as in frontal elution chromatography, then (Nichol et al., 1978; Yau et al., 1979)
 |
(4) |
where tr and Vr are the solute retention time and volume, t0 and V0 are the retention time and volume of completely excluded molecules (i.e., the “dead” volume), and tT and VT the retention time and volume of completely included molecules (i.e., the “total” volume). Inserting the definition of KD (Eq. 4) and Eq. 3 into Eq. 2 and keeping only the first order terms in concentration, one obtains a relation between KD, B2, and Ci valid for frontal chromatography, where the concentration Ci is the plateau value of the solute concentration in the mobile phase:
 |
(5) |
To adapt this to pulse chromatography, we replace the plateau value with the average concentration 〈Ci〉 of the mobile phase in the pulse:
 |
(6) |
Since 〈Ci〉 is not directly accessible in a HPLC experiment, one must relate it to measurable parameters. One determines the mass of solute molecules in the pulse, or migration zone, (mzone), by integrating the concentration as a function of time over the zone volume, i.e., the peak (Vz). For our columns, in which there is no irreversible binding of protein molecules to the column, all the injected molecules are accounted for by integrating the peak. Therefore, the total injected mass is the same as the total mass in the zone, minj = CinjVinj = mzone, but the concentration of solute in the migration zone is much lower than the injected concentration because the pulse spreads as it is transported through the column. The condition for the conservation of mass of solute molecules in the migration zone (subscript z) is
 |
(7) |
 |
Here Vi and Vp are the mobile (interpore) and stationary (pore) portions of the zone volume Vz, with
 |
(8) |
We measure the solute zone volume Vz from the full width Δt at half-maximum of the chromatogram peak using Vz = νΔt, where ν is the average flow rate. After substituting the definition of the partition coefficient given in Eq. 4 and definitions Eq. 8 into Eq. 7, one obtains:
 |
(9) |
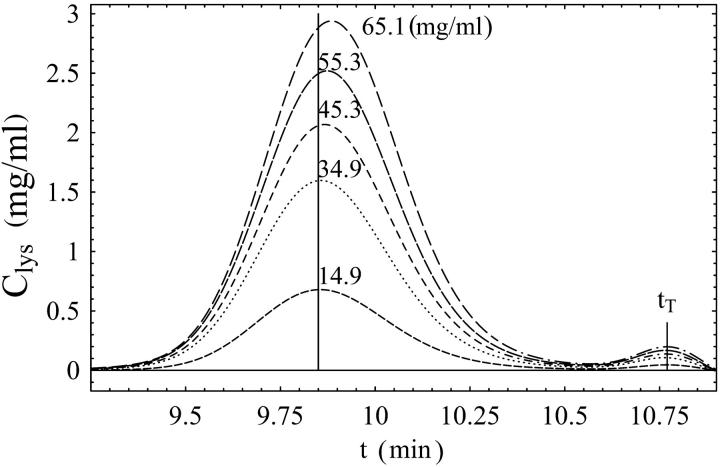
A simple way to understand relation 9 is to note that the numerator is the total mass in the zone and the denominator is the volume of the zone accessible to the protein. Thus, the concentration 〈Ci〉 is the ratio of these terms. In this derivation, we have assumed Eq. 4 holds, which is no longer the case when both B2 ≠ 0 and the concentration is changing during transport down the column. However, as we will show below, the changes in KD with concentration are small, which may justify our approximation. This relation allowed us to extend the method of Nichol et al. (1978), originally developed using frontal elution chromatography, to pulse HPLC. Alternatively, one could use the maximum concentration Cmax of eluted solute instead of 〈Ci〉 in Eq. 6. As shown in Fig. 1, Cmax and 〈Ci〉 are almost equal. Our procedure was then to inject different volumes of samples at various concentrations, measure KD from the retention times as given in Eq. 4, and then plot ln KD as a function of either 〈Ci〉 (1 − KD) or Cmax(1 − KD). The slope of that plot is then 2 B2 NA/Mw.
FIGURE 1.
Lysozyme chromatograms for Vinj = 20 μL and different injected concentrations (Cinj) as indicated next to each curve. The average concentrations 〈Ci〉 are 0.74 mg/mL (dash); 1.72 mg/mL (points); 2.20 mg/mL (dash and points); 2.68 mg/mL (long dash); 3.08 mg/mL (long dash and points). The vertical line marks the retention time for the most dilute sample (not shown). The retention time tr is the time corresponding to the peak of the concentration profile (Cmax) and increases with increasing concentration. The retention time of completely included molecules (the “total” volume) is marked as tT and is caused by the buffer. The retention time of completed excluded molecules (the “dead” volume) was t0 = 6.07 min (not shown). Cmax and 〈Ci〉 are similar. Buffer: sodium acetate, 50 mM, pH 4.7.
EXPERIMENTAL
Materials
We obtained lysozyme (6× crystallized hen egg white) from Seikagaku America (Falmouth, MA). Our studies, along with those of Muschol and Rosenberger (1997), of the purity of lysozyme preparations from Sigma (St. Louis, MO) and Seikagaku showed the Seikagaku preparation to be purer, and it was used without further purification. We obtained bovine serum albumin (BSA) from Sigma, and it was used without further purification. All buffer components were obtained from Fisher Scientific (Pittsburgh, PA). A Millipore Elix system (Millipore, Billerica, MA) purified water for all the experiments. We prepared potassium phosphate buffers by mixing 50 mM solutions of K2HPO4 and KH2PO4, at various NaCl concentrations to adjust the ionic strength, to reach the desired pH = 6.2 as measured by an Orion SA520 pH meter (Orion Research, Boston, MA). The pH = 4.7 of sodium acetate buffers was adjusted by adding concentrated acetic acid to solutions of sodium acetate and NaCl. Additionally, all buffers were passed through 0.45 μm nylon filters, also obtained from Millipore before use. Protein concentrations were measured using a Varian instruments Cary 50Bio spectrophotometer (Varian, Palo Alto, CA) at a wavelength of 278 nm. The extinction coefficient used for lysozyme was ɛ278nm = 2.64 mL (mg cm)−1, and ɛ278nm = .667 mL (mg cm)−1 for BSA.
Chromatography
An 1100 series liquid chromatography system from Agilent Technologies (Wilmington, DE) was used for all chromatographic measurements. Protein retention times were determined using an Agilent differential refractive index detector (RID) and an Agilent diode array detector by absorbance at 278 nm. A TSK-G2000SW (30 cm × 0.75 cm inner diameter) column from Tosoh Bioscience (Montgomeryville, PA) and a YMC-Diol-200AMP (30 cm × 0.60 cm inner diameter) column from YMC (Kyoto, Japan) were used in the chromatographic measurements. We used a flow rate of 1 mL/min for all measurements. These columns contain a packing of porous silica beads whose surfaces have been hydrophilicly modified. From the manufacturer's specifications, the diameter of a single bead is ∼5 μm for both columns. The average pore diameter is 125 Å for the TSK-G2000SW, and 200 Å for the YMC-Diol-200AMP. We determined the SEC calibration curve for these columns by using polyethylene glycol samples with molecular weights 200 ≤ Mw ≤ 105, obtained from Sigma and Fluka (Buchs, Switzerland). For every run, the eluent was the same as the sample buffer. The random run-to-run difference in retention times for our system was <0.1%. Any dependence of the dimensionless distribution coefficient KD for protein molecules between the stationary and mobile phases on the average flow rate ν would indicate nonequilibrium effects. We found KD to be totally independent of flow rate for the experimentally accessible values: 0.1 mL/min ≤ ν ≤ 1.3 mL/min.
Methods
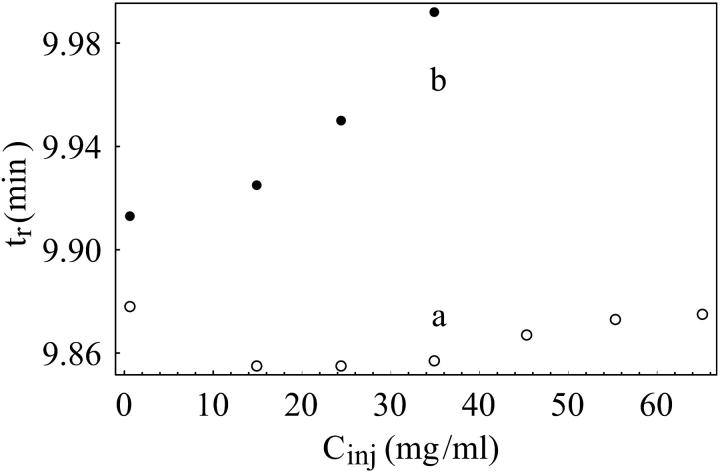
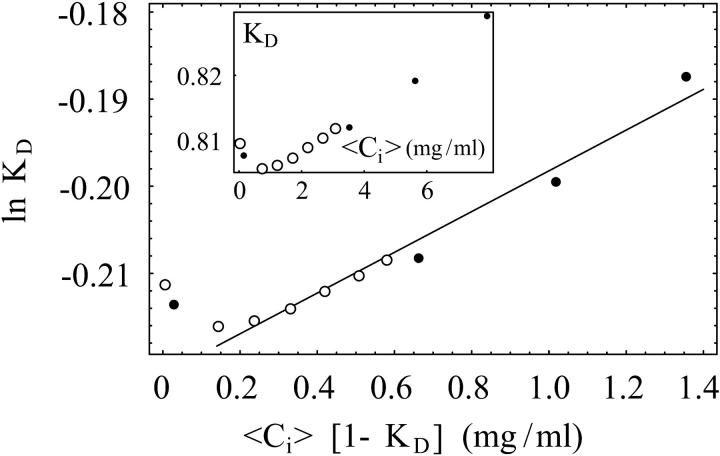
For each solvent condition, we performed a series of HPLC experiments, varying solute (protein) injected concentration Cinj and using two injection volumes, Vinj = 20 and 100 μL. We identified the protein retention time tr as the time of the maximum in the RID signal (Fig. 1), where the injection time is t = 0. We plotted tr as a function of Cinj, and found that tr depends on Vinj as shown in Fig. 2. To apply our modification of Nichol et al.'s (1978) method to HPLC, we recalculated the average solute concentration in the peak zone, 〈Ci〉, as described in Eq. 9 and found that this reassuringly collapses the multiple tr versus Cinj curves from Fig. 2 to a single curve as shown in the insert of Fig. 3. The slope of this collapsed curve is proportional to the second virial coefficient according to Eq. 5.
FIGURE 2.
Lysozyme retention times versus injected concentrations for two injection volumes. Set a: Vinj = 20 μL. Set b: Vinj = 100 μL. Buffer: sodium acetate, 50 mM pH 4.7.
FIGURE 3.
ln KD vs. 〈Ci〉 (1 − KD)(mg/mL) for lysozyme as in Eq. 5. The insert is a plot of KD vs. 〈Ci〉 (mg/mL), where multiple curves from Fig. 2 with different injected volumes collapse after recalculating the solute concentration in the mobile phase of the migration zone as in Eq. 9. Buffer: sodium acetate (50 mM, pH 4.7); Vinj = 100 μL (closed circles); Vinj = 20 μL (open circles).
To calculate KD according to Eq. 4, we must measure the total (tT) and dead (t0) times. We measured the total time for each run using the solvent peak (these are maximums of the second peaks (tT) in Fig. 1). To measure the dead time, we used polyethylene glycol with a molecular weight of 105, which is totally excluded from the TSK and the YMC columns. We measured the dead times for all solvent conditions and injection volumes. It is important to measure tT and t0 separately for all injection volumes to avoid any instrumental errors associated with precisely identifying the injection time.
We performed light-scattering measurements to determine B2 independently for a condition where results were not found in the literature. We employed the same method as George and Wilson (1994) to measure the Rayleigh ratio of protein solutions using toluene as a standard at a scattering angle of 90°. In Eq. 1, B2 has the units of volume, but virial coefficients are often reported in units of mL mol/g2, which is denoted by A2 (George and Wilson, 1994). Then B2 = A2Mw2/NA, where NA is Avogadro's number. Our results are shown in Table 1.
TABLE 1.
Comparison of SEC and LS measurements of the second virial coefficients (10−4 ml mol/g2) for lysozyme in potassium phosphate buffer (50 mM, pH = 6.2) at various added NaCl concentrations
|
A2 (10−4 ml mol/g2)
|
||
|---|---|---|
| NaCl conc., (mM) | From SEC | From LS |
| 0 | 2.4 | 1.8 |
| 50 | 1.6 | |
| 150 | −1.0 | −1.4 |
RESULTS
We measured the dependence of the retention factor KD on Cinj and Vinj for lysozyme and BSA in the above-mentioned buffers and columns. These buffer conditions were chosen to investigate the crossover from positive to negative B2 values and to compare with data available in the literature.
Fig. 1 shows the RID signal measuring the concentration of the eluted protein versus time for representative lysozyme chromatograms with Vinj = 20 μL. One can see the retention time increase with increasing protein concentration, whereas tT remains constant.
In the size exclusion mode, the direction of the shift in the retention time with concentration depends on the sign of B2. For conditions where B2 > 0, tr increases with increasing protein concentration, and where B2 < 0, tr decreases with increasing concentration. If B2 = 0, tr is independent of concentration. Previous studies (Velev et al., 1998; Muschol and Rosenberger, 1995; Gripon et al., 1997; Kulkarni, 1999) have shown that B2 for protein solutions depends on the ionic strength of the solution.
Fig. 2 shows the dependence of lysozyme retention times on the injected concentration Cinj. The two sets of data correspond to different injection volumes (Vinj): 20 μL and 100 μL. Following the procedure introduced above for determining the average solute concentration in the mobile phase of the migration zone 〈Ci〉, we plotted the dimensionless retention parameter, KD, versus 〈Ci〉 in the insert of Fig. 3. This procedure collapses the data from Fig. 2 onto a single curve from which Vinj has been removed as an independent parameter. At the smallest concentrations in the insert of Fig. 3, some nonlinear dependence of KD on 〈Ci〉 can be observed. We attribute this behavior to errors introduced at the smallest signal-to-noise ratios. We have not included these points in our fits.
To extract B2 from chromatographic data, one calculates 〈Ci〉 by Eq. 9 and then plots ln KD versus 〈Ci〉 (1 − KD). Following Nichol et al. (1978), the slope of a linear fit to such a plot is then 2B2 NA/Mw, as in Fig. 3.
The protein concentration range typically used to measure B2 by LS is ∼0 < Ci < 30 mg/mL, (Velev et al., 1998; Muschol and Rosenberger, 1995). In our SEC measurements, the protein concentrations 〈Ci〉 eluting from the column correspond to precisely the same range, although the injected concentrations are much higher as shown in Fig. 2. Even with these high concentrations, we never saturated our column. Such high injected concentrations may not be accessible for other protein systems, and may in fact be avoided by employing larger injection volumes, as shown by the Vinj = 100 data in Fig. 2.
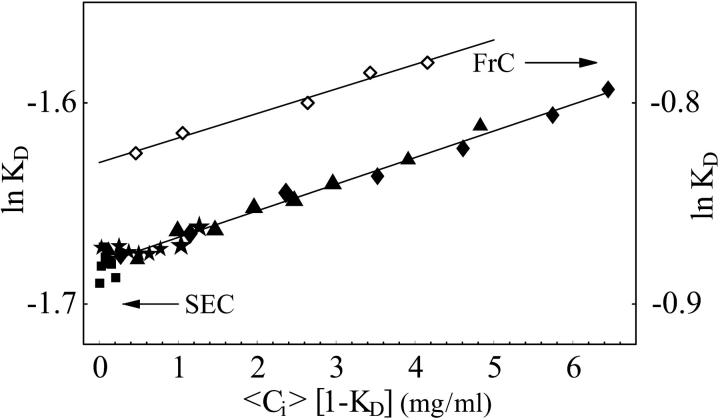
In Fig. 4, we compare our B2 results for BSA from pulse SEC and those obtained by Nichol et al. (1978) using frontal chromatography. Our results show the same slope for ln KD as a function of 〈Ci〉 (1 − KD) as those obtained by Shearwin and Winzor (1990), which means the B2 values are the same. The solution conditions for the two data sets differ, but other studies (George and Wilson, 1994; Moon et al., 2000) have shown that B2 for BSA is insensitive to many changes in solution conditions until crystallizing conditions are approached. Therefore, we expect to measure a similar value of B2. We measured different values of KD than those in Shearwin and Winzor (1990) simply because we used a different column.
FIGURE 4.
Comparison of SEC and frontal chromatography measurements for BSA. BSA in sodium acetate, 20 mM; NaCl, 0.18M; pH = 4.6; A2 = 1.9 × 10⁻⁴ mL mol/g2 (open diamonds) (Shearwin and Winzor, 1990). BSA in potassium phosphate, 50 mM, pH 6.2, A2 = 2.0 × 10⁻⁴ mL mol/g2 (closed points). Injected concentrations are 1.14, 4.85, 10.05, 15.0, 20.7, 25.27, 30.44, 40.72, and 50.99 mg/mL. Injection volumes are 2 μL (squares), 10 μL (stars), 40 μL (triangles), and 100 μL (diamonds).
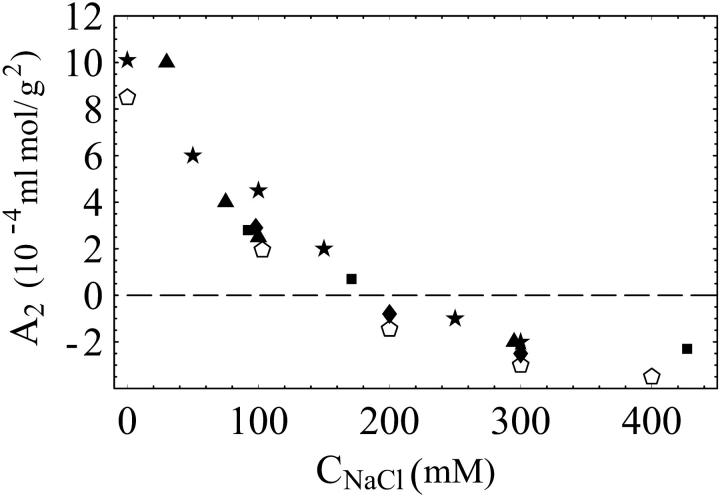
To further validate the extraction of B2 from SEC, we compare our results to those obtained by LS in Fig. 5, and in Table 1. Fig. 5 shows the dependence of the second osmotic virial coefficient on solution ionic strength (added NaCl concentration) for lysozyme. Our data agree quantitatively with those previously obtained over a wide range of ionic strengths. Table 1 compares A2 values obtained in a different buffer, potassium phosphate (50 mM, pH 6.2). For this buffer, our SEC measurements of A2 also agree with those from LS in their sign. The differences in magnitude can be attributed to systematic errors associated with LS and SEC measurements of A2, not statistical variation. Previously published results for A2 from various groups, as shown in Fig. 5, differ by as much or more than the values shown in Table 1. These results illustrate the ability of SEC to track the evolution of protein interactions from net repulsive A2 > 0 to attractive A2 < 0.
FIGURE 5.
Comparison of SEC and light-scattering measurements for lysozyme. A2(10−4 mL mol/g2) versus NaCl concentration. Buffer: sodium acetate, 50 mM pH 4.7. The SEC measurements are denoted by open pentagons. The data for 0, 100, 200, and 300 mM NaCl were taken on a TSK column, and the data for 400 mM NaCl was with a YMC column. The remaining data comes from published light-scattering data: Gripon et al. (1997) (closed diamonds); Velev et al. (1998) (closed triangles); Kulkarni (1999) (closed stars ); Muschol and Rosenberger (1995) (closed rectangles).
CONCLUSION
We have adapted the idea of Nichol et al. (1978) and present measurements of protein second virial coefficients using the standard practice of SEC, thereby reducing the cost in time and material of performing B2 measurements for protein solutions. After the protein concentrations in the solute zone are calculated, our results agree with those previously obtained using an independent method, LS, in a number of other studies.
Acknowledgments
Research was funded by National Aeronautics and Space Administration Office of Biological and Physical Research, Fundamental Microgravity Research in Physical Sciences (Fluids Physics) grant NAG3-2386.
Viatcheslav Berejnov's present address is Physics Dept., Cornell University, Ithaca, NY 14853.
References
- Behlke, J., and O. Ristau. 1999. Analysis of the thermodynamic non-ideality of proteins by sedimentation equilibrium experiments. Biophys. Chem. 76:13–23. [DOI] [PubMed] [Google Scholar]
- Bonnete, F., S. Finet, and A. Tardieu. 1999. Second virial coefficient: variations with lysozyme crystallization conditions. J. Cryst. Growth. 196:403–414. [Google Scholar]
- George, A., and W. W. Wilson. 1994. Predicting protein crystallization from a dilute solution property. Acta Crystallogr. D50:361–365. [DOI] [PubMed] [Google Scholar]
- Gripon, C., L. Legrand, I. Rosenman, O. Vidal, M. C. Robert, and F. Boué. 1997. Lysozyme-lysozyme interactions in under- and super-saturated solutions: a simple relation between the second virial coefficients in H2O and D2O. J. Cryst. Growth. 178:575–584. [Google Scholar]
- Hill, T. 1960. An Introduction to Statistical Thermodynamics. Addison-Wesley, Reading, MA.
- Kulkarni, A. M. 1999. Depletion interactions in the protein limit. Master's thesis. University of Illinois, Urbana-Champaign, IL.
- Moon, Y. U., R. A. Curtis, C. O. Anderson, H. W. Blanch, and J. M. Prausnitz. 2000. Protein-protein interactions in aqueous ammonium sulfate solutions: lysozyme and bovine serum albumin (BSA). J. Sol. Chem. 29:699–717. [Google Scholar]
- Muschol, M., and F. Rosenberger. 1995. Interactions in undersaturated and supersaturated lysozyme solutions: static and dynamic light scattering results. J. Chem. Phys. 103:10424–10432. [Google Scholar]
- Muschol, M., and F. Rosenberger. 1997. Liquid-liquid phase separation in supersaturated lysozyme solutions and associated precipitate formation/crystallization. J. Chem. Phys. 107:1953–1962. [Google Scholar]
- Nichol, L. W., R. J. Siezen, and D. J. Winzor. 1978. The study of multiple polymerization equilibria by glass bead exclusion chromatography with allowance for thermodynamic non-ideality effects. Biophys. Chem. 9:47–55. [DOI] [PubMed] [Google Scholar]
- Shearwin, K. E., and D. J. Winzor. 1990. Thermodynamic nonideality in macromolecular solutions. Eur. J. Biochem. 190:523–529. [DOI] [PubMed] [Google Scholar]
- Tessier, P. M., A. M. Lenhoff, and S. I. Sandler. 2002. Rapid measurement of protein osmotic second virial coefficients by self-interaction chromatography. Biophys. J. 82:1620–1631. [DOI] [PMC free article] [PubMed] [Google Scholar]
- Velev, O. D., E. W. Kaler, and A. M. Lenhoff. 1998. Protein interactions in solution characterized by light and neutron scattering: comparison of lysozyme and chymotrypsinogen. Biophys. J. 75:2682–2697. [DOI] [PMC free article] [PubMed] [Google Scholar]
- Wills, P. R., L. W. Nichol, and R. J. Siezen. 1980. The indefinite self-association of lysozyme: consideration of composition-dependent activity coefficients. Biophys. Chem. 11:71–82. [DOI] [PubMed] [Google Scholar]
- Yau, W.W., J.J. Kirkland, and D.D. Bly. 1979. Modern Size-Exclusion Liquid Chromatography. J. Wiley, New York.


