Abstract
We demonstrate that a novel high-pressure cell is suitable for fluorescence correlation spectroscopy (FCS). The pressure cell consists of a single fused silica microcapillary. The cylindrical shape of the capillary leads to refraction of the excitation light, which affects the point spread function of the system. We characterize the influence of these beam distortions by FCS and photon-counting histogram (PCH) analysis and identify the optimal position for fluorescence fluctuation experiments in the capillary. At this position within the capillary, FCS and photon-counting histogram experiments are described by the same equations as used in standard FCS experiments. We report the first experimental realization of fluorescence fluctuation spectroscopy under high pressure. A fluorescent dye was used as a model system for evaluating the properties of the capillary under pressure. The autocorrelation function and the photon count distribution were measured in the pressure range from 0 to 300 MPa. The fluctuation amplitude and the diffusion coefficient show a small pressure dependence. The changes of these parameters, which are on the order of 10%, are due to the pressure changes of the viscosity and the density of the aqueous medium.
INTRODUCTION
High-pressure spectroscopy of biomolecules is an important technique for exploring and understanding biological systems (Frauenfelder et al., 1990; Heremans and Smeller, 1998; Weber and Drickamer, 1983). The first demonstration of pressure-induced denaturation of a protein was given by Bridgman (1914). Since then a large number of studies have appeared that specifically investigate the effects of pressure on proteins, lipid membranes, viruses, and cellular systems (Silva et al., 1996, Northrop and Cho, 2000; Ruan and Balny, 2002; Tauc et al., 2002; So et al., 1993; Somero, 1992). The relevant pressure range for perturbation of molecular interactions in proteins and membranes occurs in the range from 100 to 1000 MPa (Gross and Jaenicke, 1994). Pressure experiments have proven quite useful for studying protein folding and in observing the reversible dissociation of oligomeric proteins (Perrett and Zhou, 2002; Silva and Weber, 1993). For example, the role of hydrophobicity, electrostriction, and cavities in the physics of pressure-induced unfolding of proteins is still investigated (Frye et al., 1996; Frye and Royer, 1998; Lassalle et al., 2001; Richards, 1979).
Advances in our understanding of high-pressure behavior of biopolymers are closely linked to the design of equipment that extends existing experimental techniques to high-pressure research. Fluorescence studies of the high-pressure effects on biopolymers only became possible with the introduction of suitable high-pressure cells (Paladini and Weber, 1981). New techniques, which entered the field of biophysics, such as NMR, led to the construction of specialized pressure cells (Erijman and Clegg, 1996; Jonas, 1982; Kundrot and Richards, 1987). Single molecule spectroscopy and fluorescence correlation spectroscopy (FCS) are very recent additions to our arsenal of biophysical techniques. Single molecule experiments cut through the ensemble average and allow the detailed observation of conformational changes in proteins (Lu et al., 1998). FCS and related techniques exploit the naturally occurring fluorescence intensity fluctuations of biomolecules and determine dynamic properties of biomolecules (Hess et al., 2002; Medina and Schwille, 2002; Van Craenenbroeck and Engelborghs, 2000).
High-pressure experiments on the single molecule level open a new avenue for studying biomolecules that connects high-pressure research to the state-of-the-art of current optical techniques. The inherent sensitivity of these techniques opens the possibility for observing pressure effects at very low protein concentrations. FCS has proven successful in determining ligand binding rates and other dynamic properties of proteins. FCS differs from other techniques, because it provides dynamic information about protein kinetics from spontaneously occurring equilibrium fluctuations. Conventional techniques require perturbations creating a nonequilibrium state to observe kinetic processes. Instrumental constraints currently limit most high-pressure experiments to relatively slow kinetics with a timescale of one second or slower. High-pressure FCS overcomes this limitation and opens a wide dynamic window for observing kinetics from microseconds to seconds. FCS also provides the diffusion coefficient of proteins, which should be useful in observing protein aggregation, dissociation of protein complexes or the unfolding of proteins. Spectroscopy at the single molecule level requires optical microscopes. Although a number of pressure vessels have been described in the literature, which are specifically designed for the use on microscope stages, none is suitable for single molecule detection. The thickness of the optical windows of conventional pressure cells exceeds one millimeter. Yet, single molecule work requires objectives with large numerical apertures, which have working distances of less than one millimeter. Thus, the currently existing high-pressure vessels are not suitable for measurements on the single molecule level.
In this paper we use an unconventional pressure cell. A microcapillary made out of fused silica simultaneously serves as the supporting body and the optical window of the pressure cell. The dimensions of the capillary lend itself for the use on a microscope with a wall thickness compatible with high NA objectives. Capillaries have excellent pressure stability and the optical properties of fused silica are very good. We use FCS and photon counting histogram (PCH) analysis to characterize the optical properties of the capillary (Chen et al., 1999b; Thompson, 1991). The cylindrical geometry of the capillaries introduces refraction of the laser beam and distorts the point spread function (PSF). We characterize the optical profile of the capillary as a function of focal depth and identify the location where the signal to noise ratio for fluctuation measurements is best. At this location the autocorrelation and PCH data are described by the same PSF used in conventional coverslip experiments. FCS and PCH analysis demonstrate that the capillary cell allows fluorescence detection with single molecule sensitivity. We pressurized the cell up to 300 MPa and performed FCS and PCH measurements of fluorescent dye solutions as a function of pressure. Our setup has the sensitivity to detect the small density and viscosity changes of the aqueous medium as a function of pressure. In addition, we performed measurements on the protein EGFP in the pressure range from 0.1 MPa to 300 MPa. We conclude that fused silica microcapillaries are excellent pressure vessels with good optical properties that open the possibility for studying biological phenomena under high pressure with fluorescence fluctuation and single molecule spectroscopy.
MATERIAL AND METHODS
Instrumentation
The instrumentation used for two-photon fluorescence fluctuation experiments is similar to that described by Chen et al. (1999a). A mode-locked Ti:sapphire laser (Mira 900, Coherent, Palo Alto, CA) pumped by an intracavity doubled Nd:YVO4., Vanadate laser (Coherent Inc., Santa Clara, CA) was used as the two-photon excitation source. The experiments were carried out using a Zeiss Axiovert 135 TV microscope (Thornwood, NY) with a 63× Plan Apochromat oil immersion objective (N.A. = 1.4). For all measurements on dyes, an excitation wavelength of 780 nm was used and the average power after the objective was ∼5 mW. An excitation wavelength of 905 nm was used for the measurements on the protein EGFP. The average power at the sample was ∼3 mW. Photon counts were detected with an APD (EG&G, SPCM-AQ-151). The output of the APD unit, which produces TTL pulses, was directly connected to a homebuilt data acquisition card (Eid et al., 2000). The photon counts were sampled either at 10 MHz or at 50 kHz. The recorded and stored photon counts were analyzed with programs written for PV-WAVE version 6.10 (Visual Numerics, Inc., San Ramon, CA) and LFD Globals Unlimited software (Champaign, IL).
Sample preparation
Rhodamine 110 and fluorescein were purchased from Molecular Probes (Eugene, OR). All dyes were dissolved in 50 mM Tris(hydroxymethy)amino-methane (TRIS) (Sigma-Aldrich, St. Louis, MO) at a pH of 8.5. Dye concentrations were determined by absorption measurements using the extinction coefficients provided by Molecular Probes. TRIS buffer was used because of the weak pressure dependence of its pH (Disteche, 1972; Kitamura and Itoh, 1987).
His-tagged EGFP was prepared according to Patterson et al. (1997). Protein was dialyzed with TRIS buffer and its purity was checked with SDS gel stained with Coomassie brilliant blue. The concentration of protein was determined by absorption measurement using an extinction coefficient of 53,000 M−1cm−1 at 489 nm. The final buffer solution for EGFP was 50 mM TRIS at a pH of 8.0 with 0.5% (w/w) NP40 (Sigma, St. Louis, MO). The pressure cell was loaded with a 25 nM solution of protein.
Data analysis
Autocorrelation functions were calculated from the recorded photon counts by software. The variance of the autocorrelation function, calculated from the photon sequence, was used to fit the data with weights. The autocorrelation functions were fitted to theoretical correlations functions assuming a three-dimensional Gaussian or a Gaussian Lorentzian PSF. Initial studies showed that the values recovered for the fluctuation amplitude g(0), the diffusion coefficient D, and the beam waist ω0 were independent of the model chosen. The autocorrelation function for a three-dimensional Gaussian beam profile is given by Thompson (1991),
 |
where τ is the correlation time. The ratio z0/ω0 was fixed to a value of five during the fit.
Photon counting histogram (PCH) analysis on the data was performed as previously described (Chen et al., 1999b; Müller et al., 2000). The analysis determines two parameters for a single fluorescent species, the molecular brightness ɛ and the average number of molecules in the excitation volume N. The molecular brightness is measured in counts per second per molecule (cpsm). The product of the molecular brightness ɛ and the number of molecules N describes the average photon count rate,  (Chen et al., 1999b).
Capillaries
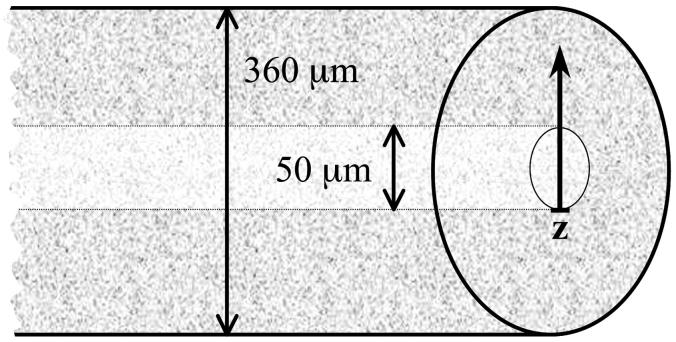
Fused silica microcapillaries (Polymicro, Phoenix, AZ) of cylindrical geometry with an outer diameter of 360 μm and an inner diameter of 50 μm were used in this study. The capillaries were guaranteed to handle pressures of ∼700 MPa according to the manufacturer's specification. The design of the pressure cell is straightforward. A fused silica capillary is coupled to the high-pressure generator apparatus using a modified pressure plug. A small hole of ∼400 μm is drilled through the plug. The capillary is inserted in the hole and secured with epoxy glue. This seal is robust enough to withstand high pressure. The forces acting upon the seal are rather small, even at high pressures, because of the small area of the hole. The liquid sample is loaded into the capillary by applying suction on one end of the open capillary after connecting it to a syringe, while the other end is in contact with the sample.
Once the sample is loaded, the free end of the capillary is sealed. Currently, we seal one end of the capillary by touching the very extreme of the capillary with the flame of a blowtorch, which fuses the silica together. We typically leave the last centimeter of the capillary void of sample, so that the heat is not in direct contact with the sample. The thermal conductivity of fused silica is low. Metallic pliers, which touch the capillary close to its end, where the flame is applied, provide an efficient heat sink to protect temperature sensitive samples, such as biological materials.
The other end of the capillary, which carries the pressure plug, is connected to commercially available pressure tubing (HPI, Erie, PA). The pressure plug fits the receptacle of the coupling unit, which provides the high-pressure connection between the capillary and the pressure tubing. The pressure tubing is connected to a homebuilt pressure generator, which uses ethanol as the pressure-transmitting medium. A manually operated piston screw pump (HIP 37-5.75-60, Erie, PA) was used to generate hydrostatic pressure. A standard pressure gauge (HIP 6PG75, Erie, PA) was connected to the pump for determining the pressure of the system. We separate the sample from the pressurizing liquid of the generator by using silicon oil as a liquid piston, which transmits pressure between the sample and the generator.
We choose for our experiments fused silica capillaries with a wall thickness of ∼150 μm. This distance closely matches the thickness of standard microscope coverslips and the optics of most objectives is optimized for a glass thickness of 170 μm. We use glycerol to optically couple the objective and the capillary. The capillary is at room temperature, because it is in thermal contact with the coupling liquid and the surrounding air. For measurements of the z-profile of the capillary we used a piezo-driven objective positioner (Polytek PI, P721, Auburn, MA), which controls the distance between objective and the pressure cell.
RESULTS
Characterization of capillary
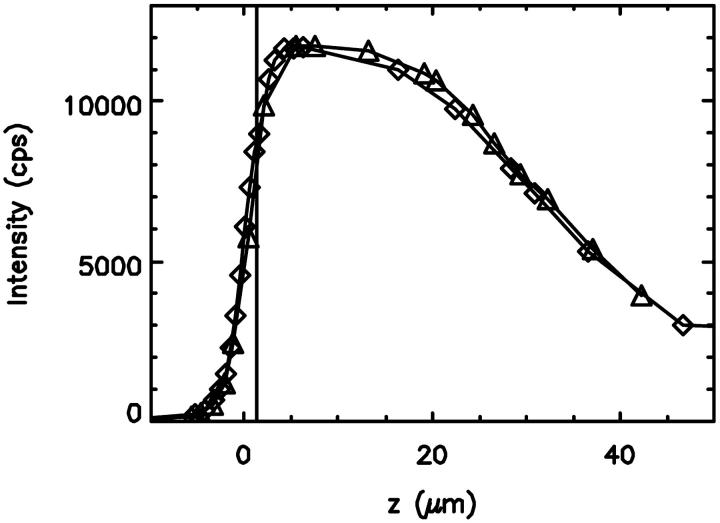
We choose a fused silica capillary of cylindrical geometry for our pressure cell. The cylindrical geometry distributes stress evenly and thus has excellent pressure stability. However, the cylindrical shape of the capillaries poses a challenge for the image formation on the microscope. The change of the index of refraction at the curved surface refracts the laser beam, which changes the focal properties of the instrument. We need to address the influence of this index mismatch on the optical properties of the capillary. We use fluorescence spectroscopy to evaluate the quality of the high-pressure optical cell. In addition, we are interested in demonstrating that single molecule sensitivity is achievable with this cell. To characterize the influence of beam distortions on fluorescence fluctuation experiments we use a pragmatic approach. Instead of measuring the PSF in the capillary, we characterize FCS parameters as a function of focal depth. A microcapillary with an inner diameter of 50 μm and an outer diameter of 360 μm was loaded with a 10 nM aqueous fluorescein solution (Fig. 1). The capillary was rigidly supported by a coverslide to avoid bending of the capillary upon contact with the oil-immersion objective. A piezo-driven z-stage precisely controlled the distance between objective and capillary. We recorded the fluorescence intensity as a function of the optical distance. As the focus of the laser beam enters into the capillary bore, the intensity increases quickly, then levels off and finally decreases gradually (Fig. 2). The point, where the fluorescence intensity is half of its maximum value, was chosen as the origin of the z-axis.
FIGURE 1.
A schematic cross section of the microcapillary. The inner bore of the capillary is 50 μm and the outer diameter is 360 μm. The laser focus was moved along the optical axis of the beam (z-axis).
FIGURE 2.
The fluorescence intensity measured in the capillary as a function of focus depth. The first curve (⋄) was taken while focusing deeper into the capillary. The second curve (▵) was taken while moving the focus back to the starting point outside of the inner bore of the capillary. The objective was moved with a piezo stage. The fluorescence intensity initially increased as the laser focus was moved into the inner bore of the capillary, which was filled with a fluorophores solution. After reaching a maximum the fluorescence intensity decreases. The vertical line indicates the position with the largest fluctuation amplitude (see Fig. 3).
The fluorescence intensity 〈k〉, which is the photon count rate in counts per second (cps), does not characterize FCS experiments, because it is the product of the molecular brightness ɛ and the number of molecules in the excitation volume,  (Müller et al., 2001). FCS experiments determine the fluctuation amplitude g(0), which for a monodisperse sample is inversely proportional to the number of molecules in the excitation volume,
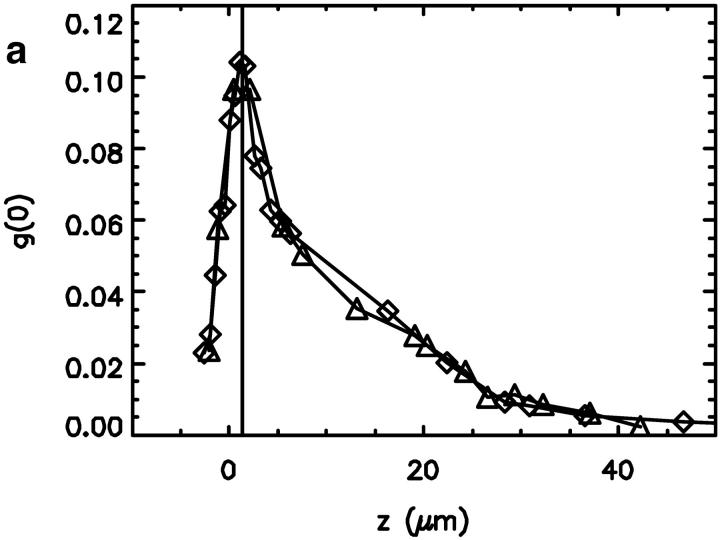
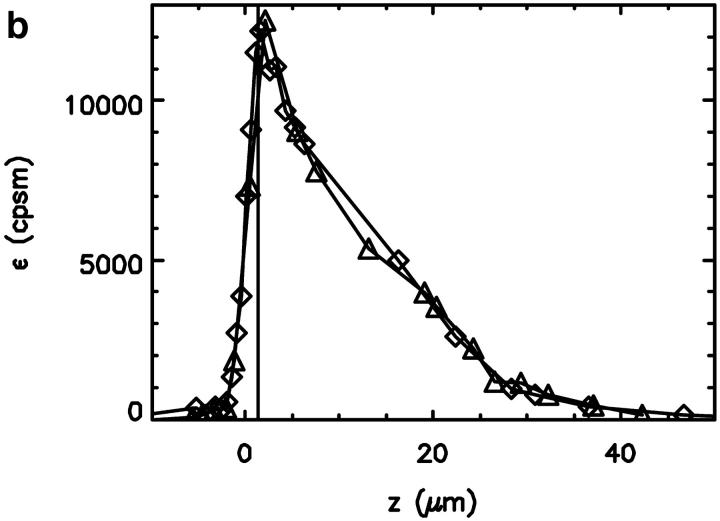
  . The functional form of the PSF determines the shape factor γ (Thompson, 1991). The molecular brightness ɛ is a critical parameter, because it determines the signal-to-noise ratio of FCS measurements (Koppel, 1974). The maximum of the molecular brightness gives the best signal statistics, whereas the maximum of the fluctuation amplitude characterizes the smallest excitation volume. Fig. 3, a and b display the fluorescence intensity of Fig. 2 resolved into its molecular brightness and fluctuation amplitude as a function of focal depth. We calculated the fluctuation amplitude from the autocorrelation function of the intensity measurement at each z position. The molecular brightness was determined similarly by PCH analysis of the intensity data. The maximum of the fluctuation amplitude and the maximum of the molecular brightness occur at the same spatial location within the capillary. The location of the maximum, which is indicated by a vertical line in Figs. 2 and 3, determines the best position within the capillary for fluorescence fluctuation experiments. The optimal position is very close to the inner surface of the capillary and has a very sharp maximum. It does not coincide with the position of the maximum of the fluorescence intensity curve, but occurs just before the steep increase of the fluorescence intensity falls off. The data in Figs. 2 and 3 show two curves. One was taken while going up with the objective and the other one was taken while going down. Both curves superimpose almost perfectly and demonstrate the reproducibility of the z-profile scans.
FIGURE 3.
The fluorescence intensity data shown in Fig. 2 have been analyzed with FCS and PCH analysis to determine the fluctuation amplitude and the molecular brightness. (a) The measured fluctuation amplitude in the capillary as a function of the z-axis. (b) The molecular brightness (in counts per second per molecule) as a function of the z-axis. The maximum of the fluctuation amplitude is indicated by a vertical line. The maximum of the molecular brightness occurs at the same position as the maximum of the fluctuation amplitude.
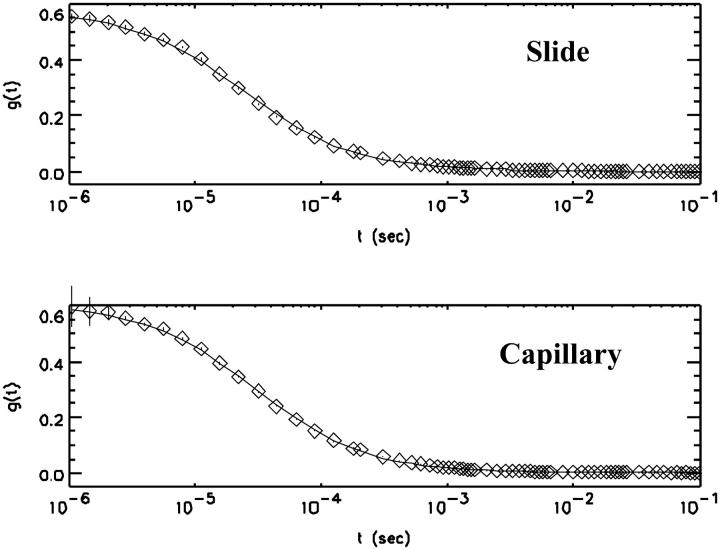
All subsequent experiments are performed, while focusing the laser beam at the optimal position for fluorescence fluctuation experiments. Next, we evaluate the performance of the capillary at the optimal spot by comparing fluorescence experiments taken in the capillary with measurements taken on a regular microscope coverslip under otherwise identical conditions. A solution of rhodamine 110 was measured on the coverslip and in the fused silica capillary. Both samples were mounted side by side on the microscope. Fig. 4 shows the autocorrelation functions obtained from each sample. The autocorrelation functions were fit to the simple diffusion model of Eq. 1. Because the diffusion coefficient of the dye is known from previous experiments, we used this information to determine the beam waist ω0 and the fluctuation amplitude g(0). The results of the data analysis are compiled in Table 1. Our analysis demonstrates, that the fluctuation amplitude and the beam waist of both sample geometries are essentially identical. Thus, the number of molecules in the observation volumes of both experiments is almost identical. PCH analysis shows that the samples differ in their molecular brightness, which in the capillary is a factor of two less than the value measured with the coverslip. Note that the standard equations used for PCH and autocorrelation analysis fit the data measured in the capillary within experimental error.
FIGURE 4.
Comparison of FCS experiments of a rhodamine 110 stock solution measured under identical conditions on a regular microscope coverslip (top) and in a cylindrical capillary (bottom). The experimental autocorrelation function (symbols) was fit to the theoretical autocorrelation function (solid line) with the diffusion coefficient of the dye fixed at 300 μm2/s. The results of the fit are compiled in Table 1.
TABLE 1.
Comparison of measurements in a capillary and a microscope slide by FCS and PCH analysis
| Slide | Capillary | ||
|---|---|---|---|
| (FCS) | g (0) | 0.57 | 0.60 |
| ω0 (mm) | 0.25 | 0.27 | |
| (PCH) | ɛ (cpsm) | 43,000 | 22,000 |
| N | 0.15 | 0.12 |
The same dye solution was measured in a quartz capillary and on a microscope coverslip under otherwise identical conditions. PCH and FCS analysis were used to recover the fluctuation amplitude g(0), the beam waist ω0, the molecular brightness ɛ and the average number of particles N for both measurements. The diffusion coefficient of the dye rhodamine 110 was fixed to a value of 300 μm2/s.
Pressure studies
Before measuring on the microscope, cells loaded with water were pressurized to test for leaks and to assess the stability of our cell. The capillary cell was stable throughout the pressure range (0–300 MPa) accessible with our generator. A capillary loaded with an aqueous rhodamine solution was optically aligned and the focal point adjusted to yield optimal excitation. The pressure was increased in steps and a measurement was taken at each pressure. After measuring at the maximum pressure we gradually reduced its value and took data until we reached atmospheric pressure. The pressure of the system, which was constantly monitored with a gauge, was stable while data were taken. A charge-coupled device camera was used to observe the position of the capillary at different pressures. The capillary did not move during the whole experiment.
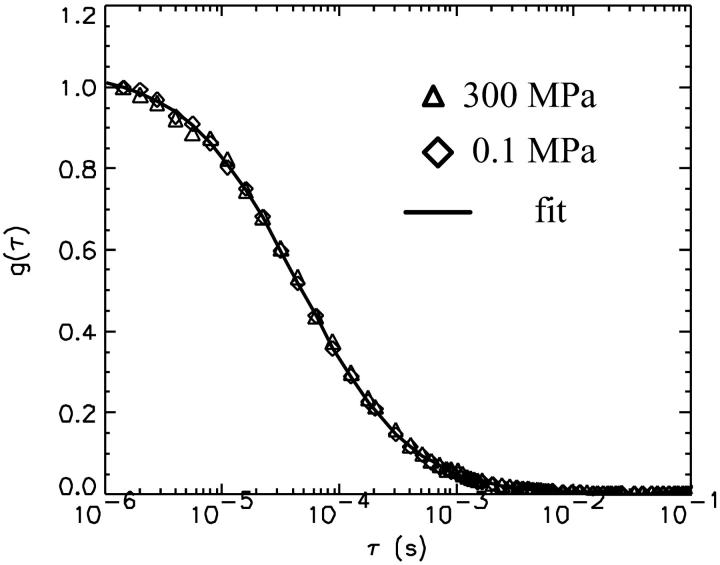
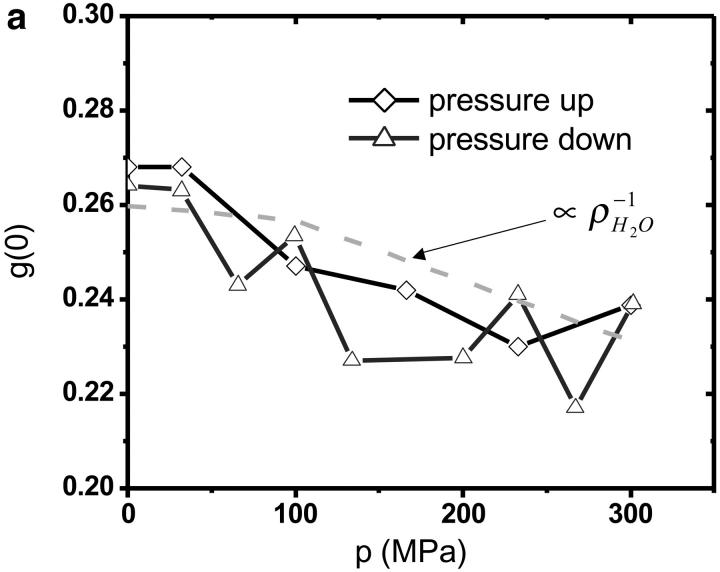
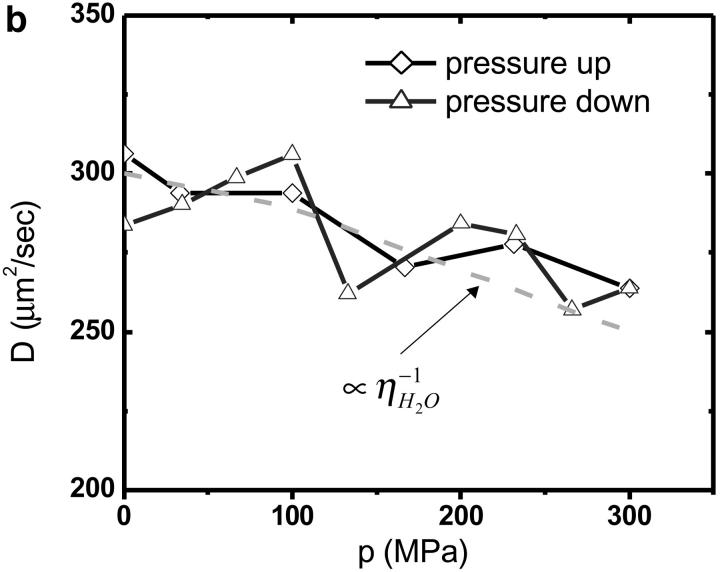
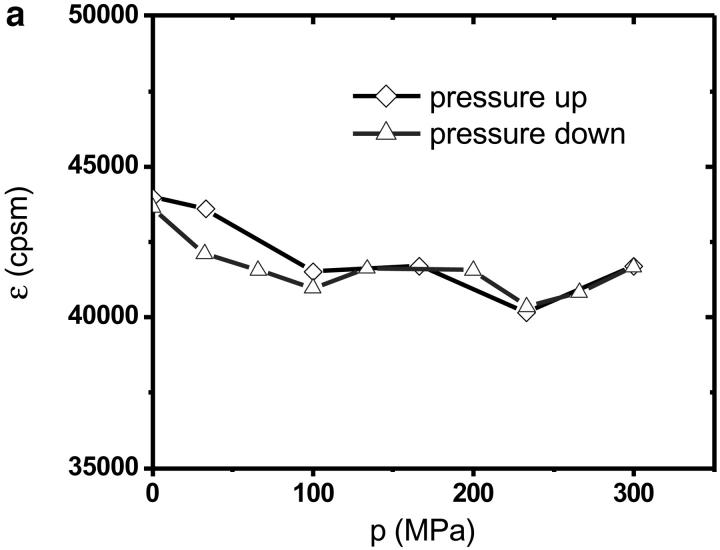
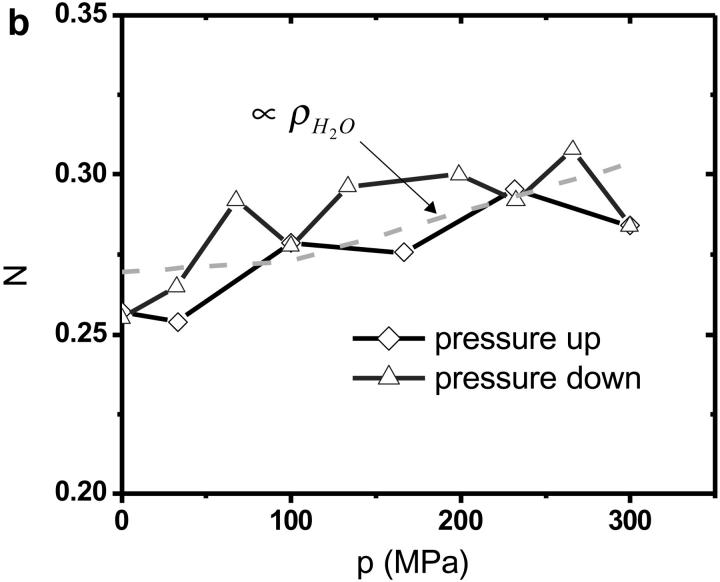
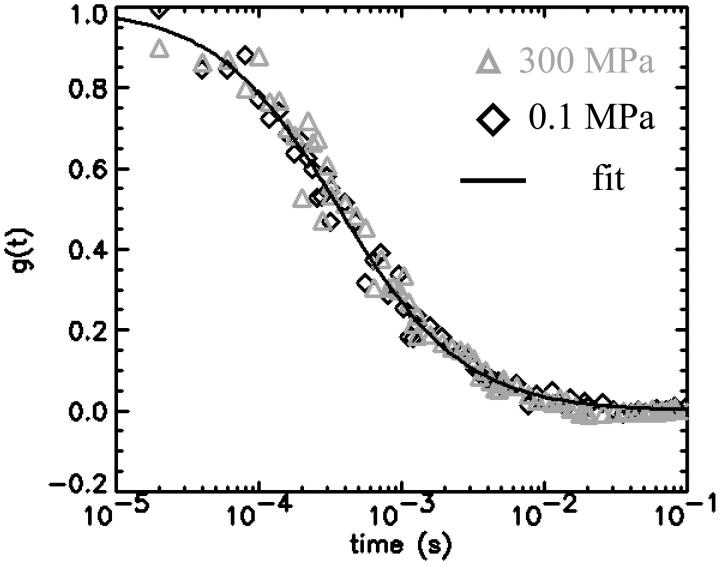
The autocorrelation functions were analyzed by fitting the data to Eq. 1. Fig. 5 shows the autocorrelation functions at atmospheric pressure and at 300 MPa. The fluctuation amplitude of both measurements was normalized to one. The autocorrelation function of the rhodamine dye is very insensitive to pressure as expected. The fluctuation amplitude and the diffusion coefficient of the rhodamine sample are shown in Fig. 6 as a function of pressure. Although both parameters are fairly insensitive to pressure, a systematic decrease of both parameters with pressure is clearly visible over the studied pressure range of 300 MPa. The fluctuation amplitude decreases by ∼15% and the diffusion coefficient decreases by ∼10%. The pressure effects on the autocorrelation function are completely reversible as demonstrated by the data taken while reducing the pressure (Fig. 6). In addition to autocorrelation analysis, we also performed PCH analysis on all data sets. The molecular brightness ɛ and the number of molecules N are shown in Fig. 7 as a function of pressure. Again, as in the case of autocorrelation analysis, both parameters only depend weakly on pressure. The average number of molecules increases by ∼15% with pressure. The molecular brightness decreases by ∼7% over the first hundred MPa of pressure and then stays constant.
FIGURE 5.
Autocorrelation function of rhodamine 110 with normalized amplitude at 0.1 MPa (⋄) and 300 MPa (▵). The solid line is a fit of the experimental autocorrelation function at atmospheric pressure.
FIGURE 6.
FCS measurements of rhodamine 110 as a function of hydrostatic pressure. The fluctuation amplitude (a) and the diffusion coefficient (b) were determined from fitting the autocorrelation function. Diamonds represent the data taken while the pressure in the capillary was increased. Triangles represent the data measured subsequently, while the pressure was stepwise reduced. The dashed line in a and b shows the pressure dependence of the inverse of the density and viscosity of water as a function of pressure.
FIGURE 7.
PCH measurements of rhodamine 110 as a function of hydrostatic pressure. The molecular brightness (a) and the average number of molecules in the excitation volume (b) were determined from fitting the histogram. Diamonds represent the data taken while the pressure in the capillary was stepwise increased. Triangles represent the data measured subsequently, while the pressure was reduced. The dashed line in b shows the pressure dependence of the density of water as a function of pressure.
We demonstrate the feasibility of measuring proteins under high pressure by FCS. Fig. 8 displays the autocorrelation functions of EGFP at atmospheric pressure and at 300 MPa. The fluctuation amplitude of both measurements was normalized to one. Fitting of the autocorrelation data to Eq. 1 resulted in a diffusion coefficient of 78 μm2/s at atmospheric pressure and of 67 μm2/s at 300 MPa. The statistical uncertainty in the experimental values of the diffusion coefficients is ∼10%. The molecular brightness of EGFP is 7300 cpsm and constant in the pressure range from 0 to 300 MPa (data not shown).
FIGURE 8.
Autocorrelation function of EGFP with normalized amplitude at 0.1 MPa (⋄) and 300 MPa (▵). The solid line is a fit of the experimental autocorrelation function at atmospheric pressure.
DISCUSSION
A novel pressure cell for optical microscopy with single molecule sensitivity was characterized. Optical spectroscopy at the single molecule level requires high NA objectives, because of their efficiency of photon collection. For example, in two-photon fluorescence spectroscopy the collection efficiency is proportional to the forth power of the NA (Denk et al., 1990). A disadvantage of high NA objectives is that their working distance is less than a millimeter. Thus, high NA objectives require thin optical windows. Conventional pressure cells are relatively bulky and require optical windows for spectroscopy. These windows have a thickness in excess of one millimeter, because of the design constraints of high-pressure physics (Eremets, 1996), and therefore are incompatible with the use of high NA objectives. In our design the body of the pressure cell also functions as its optical window. The pressure stability of the capillary, which represents a thick-walled cylinder, only depends on the ratio of the inner and outer radius and the tensile strength of the material, but not on absolute dimensions (Comings, 1956). A calculation using the ratio of the radii and the typical tensile strength of fused silica demonstrates that the pressure stability of the capillary exceeds 700 MPa. This pressure stability compares favorably with other existing pressure cells, and covers the range of pressures important for biophysical applications.
Quartz has very good optical transmission and we choose a capillary with a wall thickness of ∼150 μm, which corresponds to the coverglass thickness most objectives are corrected for. However, the round capillaries have one serious disadvantage. The curved surface bends the incoming light rays and changes the PSF of the focused light. We partially eliminate this problem by using an optical coupling liquid with the same index of refraction as quartz. Thus, for all experiments with high NA objectives we used glycerol as a coupling medium. While we achieve index matching for the outer surface of the capillary, the inner surface is in contact with an aqueous solution. Here, we cannot match the index of refraction, because biology requires an aqueous environment. This index mismatch leads to the pronounced z-axis dependence of the optical properties of the capillary.
A characterization of the optical properties of the capillary from a measurement of the PSF is difficult. An accurate parameterization of the PSF is needed to connect it to the fluctuation amplitude g(0) and the molecular brightness ɛ. Thus, we decided to use FCS and PCH for evaluating the z-profile of the capillary. The fluctuation amplitude and the molecular brightness give enough information for comparing the quality of fluctuation experiments as a function of focal depth. Fig. 2 shows how the measured fluorescence intensity changes as we move the focus from the quartz into the capillary bore. When the laser focus enters the inner bore, the intensity increases sharply, reaches a broad maximum and then gradually decreases. The focal volume of the laser beam gradually shifts into the fluorophore solution and causes the initial sharp increase of intensity. However, a widening of the focal volume, which increases the number of excited molecules, also contributes to an increase of fluorescence intensity. We determine the position with the smallest focal volume by FCS. At that position, the fluctuation amplitude, which is inversely proportional to the number of molecules in the focal volume, is a maximum. Fig. 3 a shows the z-profile of the fluctuation amplitude g(0). The optimal position for the focal spot is near the surface of the capillary. It is very reproducible and easy to obtain.
The molecular brightness, which is shown in Fig. 3 b as a function of focal depth, should be maximized to yield the best signal statistics (Koppel, 1974). The maximum of the molecular brightness occurs at the same focal depth as the maximum of the fluctuation amplitude. This is a reasonable result. The molecular brightness increases with the laser excitation intensity. A larger fluctuation amplitude implies a smaller excitation volume and therefore a tighter beam focus with higher intensity. Note that the optimal location for fluorescence fluctuation experiments differs from the position that corresponds to the maximum of the fluorescence intensity (see Fig. 2), because changes in the focal volume and the brightness are not directly proportional.
We defined the origin of the z-axis as the point, where half of the maximum intensity is reached. This definition of the z-origin should mark the point where half of the two-photon focal spot extends into the fluorescent solution. The optimal position for fluorescence fluctuation measurements is found ∼1.5 micrometer above the inner quartz surface. It is easy to understand why the optimal position has to be very close to the inner surface. The laser beam hitting the interface is refracted because of the difference in the index of refraction. For a focal point just above the interface, the distance traveled by the refracted beam is very short before reaching the focal plane and the distortions introduced by refraction are minimal. For a deeper focus the distance traveled by the refracted beam is longer before reaching its focal plane. The different curvature parallel and perpendicular to the axis of the capillary leads to astigmatism. Consequently, the beam does not focus in the same z-location and its focal volume increases.
We judge the performance of the high-pressure cell for fluorescence fluctuation spectroscopy by comparing measurements taken with a regular coverslip and with a microcapillary. The autocorrelation function (Fig. 4) and the photon counting histogram (data not shown) of a rhodamine sample were measured in a capillary and on a microscope slide under identical conditions. The fluctuation amplitude, the diffusion coefficient, and the number of molecules are essentially identical (see Table 1), but the brightness of rhodamine is about a factor of two smaller in the capillary, presumably due to losses at the curved optical interface. The signal-to-noise ratio of FCS measurements is proportional to the square of the molecular brightness. The loss of a factor of two in the capillary requires a data acquisition time that is four times as long as if measured on a coverslip. However, we could recover the loss in molecular brightness by increasing the excitation laser power. The autocorrelation function and the photon counting histogram measured close to the bottom of the capillary are fit within experimental accuracy by the same theoretical expressions as used for regular samples. We conclude that the shape of the PSF at the optimal spot in the capillary is within experimental accuracy identical to the PSF of regular FCS measurements. If we analyze data taken deeper in the capillary the regular equations fail in describing the photon count distribution and the autocorrelation function (data not shown). Both, FCS and PCH are sensitive to the optical properties of the focus and detect the beam aberrations introduced by the cylindrical shape of the capillary, which change the PSF.
We choose a fluorescent dye solution for investigating the capillary under pressure, because the photophysical properties of the dye should be rather insensitive to pressure changes of a few kilobar (Drickamer, 1982). The dye sample allows judging the stability, accuracy, and repeatability of fluorescence fluctuation measurements in the pressurized capillary. As can be seen from Fig. 5 the shape of the autocorrelation function is at first glance independent of pressure. A detailed graph of the fluctuation amplitude, the diffusion coefficient, the molecular brightness, and the number of molecules as a function of pressure are shown in Figs. 6 and 7. The standard deviation of the parameters as a function of pressure is in all cases less than 10%. Yet, all data exhibit a small pressure-dependent trend. This small, but systematic, trend in the data as a function of pressure has a simple origin. The properties of the solvent water depend on pressure (Lawson and Hughes, 1963). The density of water increases as the liquid is pressurized (Beggerow, 1980). Consequently the volumetric concentration of the dye as judged by fluctuation analysis increases. The fluctuation amplitude g(0) is inversely proportional to the number of molecules in the excitation volume and thus g(0) should be inversely proportional to the density of water. The graph in Fig. 6 displays the expected dependence of the fluctuation amplitude as a function of pressure (dashed line) and describes the pressure dependence of the experimental data. Similarly, the number of molecules N from PCH analysis should be proportional to the density of water. Fig. 6 shows that the average number of molecules exactly follows the pressure-dependent density of water. Pressure also changes the kinematic viscosity of water (Beggerow, 1980). The translational diffusion coefficient of solutes is inversely proportional to the viscosity of the medium. Fig. 6 b shows that the experimentally determined diffusion coefficient follows the viscosity dependence of the medium.
The changes in the molecular brightness with pressure are harder to link to the pressure effects of the medium. The influence of pressure on the electronic structure of the dye or on its interaction with the medium influences its photophysical properties and as such influences the molecular brightness. For example, the polarity of water increases as a function of pressure. There are also other effects, such as changes in the optical properties of the capillary or the medium. The index of refraction of water increases with pressure, which should lead to better optical coupling. However, these effects should become stronger with increasing pressure. Experimentally, we observe a brightness change that occurs between 0 and 100 MPa of pressure. At higher pressures the molecular brightness stayed approximately constant. It is important to note that the observed brightness change is only ∼7%, which is rather small. Thus, molecular brightness is a very sensitive parameter for the investigation of proteins under pressure. For example, the dissociation of a dimer leads to a decrease of the molecular brightness by a factor of two, which would be quite easy to observe with our experimental setup.
We also report measurements on the protein EGFP. The autocorrelation function of the protein is very insensitive to the applied pressure (Fig. 8). Studies on wild-type GFP established that the protein is stable at pressures below 600 MPa and its fluorescence intensity is unchanged in this pressure range (Ehrmann et al., 2001; Scheyhing et al., 2002). Thus, it is not surprising that the molecular brightness and the diffusion coefficient of EGFP are independent over the pressure range studied. The slight decrease in the diffusion coefficient by 15% at 300 MPa compared to 0.1 MPa is consistent with the increase in the solvent viscosity, as has been observed in the pressure study of the fluorescent dyes (Fig. 6 b).
The sensitivity of FCS allows measurements at very low concentrations. Proteins tend to aggregate once unfolded. This tendency is a serious problem for experimental techniques that require high protein concentrations, such as infrared spectroscopy, Raman spectroscopy, and NMR. The nanomolar and subnanomolar concentrations of FCS experiment reduce aggregation kinetics enormously and should facilitate characterization under reversible conditions. In addition, many binding equilibria have nanomolar and subnanomolar dissociation coefficients. Because FCS works well at these concentrations, the effect of pressure on binding equilibria is directly accessible by FCS experiments. We performed high-pressure measurements on the single molecule level. The fluctuation amplitude g(0) of the fluorophore solution measured corresponds to an average of ∼0.25 molecules in the observation volume (Fig. 6 a). It should be stressed that no other existing high-pressure technique allows detection of protein samples at such low concentrations.
A common biochemical application of fluorescence spectroscopy under high pressure is the observation of molecular association. Fluorescence polarization detects binding events by measuring a change in the rotational diffusion rate of the molecule. However, a quantitative interpretation of the polarization data requires the knowledge of many additional parameters, such as the molecular shape, dipol orientation, quenching and energy transfer mechanisms (Erijman and Weber, 1993). Fluorescence fluctuation techniques probe the statistical dependence between particles. Two molecules that bind together act as one single particle and reduce the number of independently fluctuating particles. Thus, in contrast to fluorescence polarization experiments, fluorescence fluctuation spectroscopy probes the dissociation of biopolymers directly. FCS measures the translational diffusion coefficient and the fluctuation amplitude. The association of biomolecules can be detected by changes in the translational diffusion coefficient and by observing changes in the fluctuation amplitude. FCS is complemented by PCH, which resolves a mixture of species according to their molecular brightness.
The measurement of dynamic and kinetic processes on the millisecond timescale under high pressure is challenging because the incorporation of stopped-flow or other kinetic techniques into existing high-pressure equipment is technically challenging. Thus, only few experimental studies of fast kinetic processes under high pressure are reported (Balny et al., 1987). FCS, on the other hand, determines kinetic processes conveniently from equilibrium fluctuations and no external perturbation is required. Hence, FCS would permit the study of kinetic and dynamic properties of biological systems under high pressure over a wide dynamic range (timescales from 10−7 s to 1 s are readily accessible by FCS).
CONCLUSIONS AND SUMMARY
We characterized a novel high-pressure FCS cell with single molecule sensitivity. The cylindrical geometry of the capillary leads to aberrations of the focused laser beam, which changes the PSF of the instrument. We identified the optimal z-position for fluorescence fluctuation experiments by performing PCH and autocorrelation analysis. The shape of the PSF at this position is essentially identical to the PSF measured in a regular experimental setup as judged by fluctuation analysis. Thus, the experimental autocorrelation function and photon count distribution are described by the same model equations used to describe conventional experiments.
Fused silica microcapillaries provide excellent pressure stability and allow the use of high NA microscope objectives with short working distances, which are required for FCS and single molecule studies. We report here the first observation of fluorescence fluctuation spectroscopy under high pressure. The dye that we studied serves as a model system for evaluating the properties of the capillary under pressure. Our setup has the sensitivity to detect the small changes of the viscosity and the density of the aqueous medium with pressure. We expect that our cell will be useful for observing the pressure dependence of bimolecular interactions on the single molecule level.
Acknowledgments
The authors thank Dr. Peter So for helpful discussions and Dr. Jonathan Sweedler for getting initial help with the microcapillaries. We thank Dr. Yan Chen and Mohac Tekmen for technical assistance with the protein experiments.
This work was supported by the National Institutes of Health (RR03155) and by the National Science Foundation (MCB-0110831).
Joachim D. Müller's present address is School of Physics and Astronomy, University of Minnesota, Minneapolis, MN 55455.
References
- Balny, C., J. L. Saldana, and N. Dahan. 1987. High-pressure stopped-flow fluorometry at subzero temperatures: application to kinetics of the binding of NADH to liver alcohol dehydrogenase. Anal. Biochem. 163:309–315. [DOI] [PubMed] [Google Scholar]
- Beggerow, G. 1980. High-Pressure Properties of Matter. K. I. Schäfer, editor. Springer Verlag, Berlin.
- Bridgman, P. W. 1914. Pressure effect on egg albumin. J. Biol. Chem. 19:511–512. [Google Scholar]
- Chen, Y., J. D. Müller, K. M. Berland, and E. Gratton. 1999a. Fluorescence fluctuation spectroscopy. Methods. 19:234–252. [DOI] [PubMed] [Google Scholar]
- Chen, Y., J. D. Müller, P. T. C. So, and E. Gratton. 1999b. The photon counting histogram in fluorescence fluctuation spectroscopy. Biophys. J. 77:553–567. [DOI] [PMC free article] [PubMed] [Google Scholar]
- Comings, E. W. 1956. High Pressure Technology. McGraw-Hill, New York.
- Denk, W., J. H. Strickler, and W. W. Webb. 1990. Two-photon laser scanning fluorescence microscopy. Science. 248:73–76. [DOI] [PubMed] [Google Scholar]
- Disteche, A. 1972. Effects of pressure on the dissociation of weak acids. Symp. Soc. Exp. Biol. 26:27–60. [PubMed] [Google Scholar]
- Drickamer, H. G. 1982. High pressure studies of molecular luminescence. Annu. Rev. Phys. Chem. 33:25–47. [Google Scholar]
- Ehrmann, M. A., C. H. Scheyhing, and R. F. Vogel. 2001. In vitro stability and expression of green fluorescent protein under high pressure conditions. Lett. Appl. Microbiol. 32:230–234. [DOI] [PubMed] [Google Scholar]
- Eid, J. S., J. D. Müller, and E. Gratton. 2000. Data acquisition card for FCS allowing full access to the detected photon sequence. Rev. Sci. Instrum. 71:361–368. [Google Scholar]
- Eremets, M. I. 1996. High Pressure Experimental Methods. Oxford University, Oxford. 390.
- Erijman, L., and R. M. Clegg. 1996. High pressure electrophoresis in narrow bore glass tubes: one- and two-dimensional separation of protein subunits. Rev. Sci. Instrum. 67:813–817. [Google Scholar]
- Erijman, L., and G. Weber. 1993. Use of sensitized fluorescence for the study of the exchange of subunits in protein aggregates. Photochem. Photobiol. 57:411–415. [DOI] [PubMed] [Google Scholar]
- Frauenfelder, H., N. A. Alberding, A. Ansari, B. Braunstein, B. R. Cowen, M. K. Hong, I. E. T. Iben, J. B. Johnson, S. Luck, M. C. Marden, J. R. Mourant, P. Ormos, L. Reinisch, R. Scholl, A. Schulte, E. Shyamsunder, L. B. Sorensen, P. J. Steinbach, A. Xie, R. D. Young, and K. T. Yue. 1990. Proteins and pressure. J. Phys. Chem. 94:1024–1037. [Google Scholar]
- Frye, K. J., C. S. Perman, and C. A. Royer. 1996. Testing the correlation between area and volume of protein unfolding using site specific mutants of staphylococcal nuclease. Biochemistry. 35:10234–10239. [DOI] [PubMed] [Google Scholar]
- Frye, K. J., and C. A. Royer. 1998. Probing the contribution of internal cavities to the volume change of protein unfolding under pressure. Protein Sci. 7:2217–2222. [DOI] [PMC free article] [PubMed] [Google Scholar]
- Gross, M., and R. Jaenicke. 1994. Proteins under pressure. The influence of high hydrostatic pressure on structure, function and assembly of proteins and protein complexes. Eur. J. Biochem. 221:617–630. [DOI] [PubMed] [Google Scholar]
- Heremans, K., and L. Smeller. 1998. Protein structure and dynamics at high pressure. Biochim. Biophys. Acta. 1386:353–370. [DOI] [PubMed] [Google Scholar]
- Hess, S. T., S. Huang, A. A. Heikal, and W. W. Webb. 2002. Biological and chemical applications of fluorescence correlation spectroscopy: a review. Biochemistry. 41:697–705. [DOI] [PubMed] [Google Scholar]
- Jonas, J. 1982. Nuclear magnetic resonance at high pressure. Science. 216:1179–1184. [DOI] [PubMed] [Google Scholar]
- Kitamura, Y., and T. Itoh. 1987. Reaction volume of protonic ionization for buffering agent. Prediction of pressure dependence of pH and pOH. J. Solution Chem. 16:715–725. [Google Scholar]
- Koppel, D. E. 1974. Statistical accuracy in fluorescence correlation spectroscopy. Phys. Rev. A. 10:1938–1945. [Google Scholar]
- Kundrot, C. E., and F. M. Richards. 1987. Crystal structure of hen egg-white lysozyme at a hydrostatic pressure of 1000 atmospheres. J. Mol. Biol. 193:157–170. [DOI] [PubMed] [Google Scholar]
- Lassalle, M. W., H. Yamada, H. Morii, K. Ogata, A. Sarai, and K. Akasaka. 2001. Filling a cavity dramatically increases pressure stability of the c-Myb R2 subdomain. Proteins. 45:96–101. [DOI] [PubMed] [Google Scholar]
- Lawson, A. W., and A. J. Hughes. 1963. High pressure properties of water. In High Pressure Physics and Chemistry. R. S. Bradley, editor. Academic Press, London. 207–225.
- Lu, H. P., L. Xun, and X. S. Xie. 1998. Single-molecule enzymatic dynamics. Science. 282:1877–1882. [DOI] [PubMed] [Google Scholar]
- Medina, M. A., and P. Schwille. 2002. Fluorescence correlation spectroscopy for the detection and study of single molecules in biology. Bioessays. 24:758–764. [DOI] [PubMed] [Google Scholar]
- Müller, J. D., Y. Chen, and E. Gratton. 2000. Resolving heterogeneity on the single molecular level with the photon counting histogram. Biophys. J. 78:474–486. [DOI] [PMC free article] [PubMed] [Google Scholar]
- Müller, J. D., Y. Chen, and E. Gratton. 2001. Photon counting histogram statistics. In Fluorescence Correlation Spectroscopy. Theory and Applications. R. Rigler and E. L. Elson, editors. Springer, New York.
- Northrop, D. B., and Y. K. Cho. 2000. Effect of pressure on deuterium isotope effects of yeast alcohol dehydrogenase: evidence for mechanical models of catalysis. Biochemistry. 39:2406–2412. [DOI] [PubMed] [Google Scholar]
- Paladini, A., and G. Weber. 1981. Absolute measurements of fluorescence polarization at high pressures. Rev. Sci. Instrum. 52:419–427. [Google Scholar]
- Patterson, G. H., S. M. Knobel, W. D. Sharif, S. R. Kain, and D. W. Piston. 1997. Use of the green fluorescent protein and its mutants in quantitative fluorescence microscopy. Biophys. J. 73:2782–2790. [DOI] [PMC free article] [PubMed] [Google Scholar]
- Perrett, S., and J. M. Zhou. 2002. Expanding the pressure technique: insights into protein folding from combined use of pressure and chemical denaturants. Biochim. Biophys. Acta. 1595:210–223. [DOI] [PubMed] [Google Scholar]
- Richards, F. M. 1979. Packing defects, cavities, volume fluctuations and access to the interior of proteins. Carlsberg Res. Commun. 44:47–63. [Google Scholar]
- Ruan K., and C. Balny. 2002. High pressure static fluorescence to study macromolecular structure-function. Biochim. Biophys. Acta. 1595:94–102. [DOI] [PubMed] [Google Scholar]
- Scheyhing, C. H., F. Meersman, M. A. Ehrmann, K. Heremans, and R. F. Vogel. 2002. Temperature-pressure stability of green fluorescent protein: a Fourier transform infrared spectroscopy study. Biopolymers. 65:244–253. [DOI] [PubMed] [Google Scholar]
- Silva, J. L., D. Foguel, A. T. Da Poian, and P. E. Prevelige. 1996. The use of hydrostatic pressure as a tool to study viruses and other macromolecular assemblages. Curr. Opin. Struct. Biol. 6:166–175. [DOI] [PubMed] [Google Scholar]
- Silva, J. L., and G. Weber. 1993. Pressure stability of proteins. Annu. Rev. Phys. Chem. 44:89–113. [DOI] [PubMed] [Google Scholar]
- So, P. T., S. M. Gruner, and S. Erramilli. 1993. Pressure-induced topological phase transitions in membranes. Phys. Rev. Lett. 70:3455–3458. [DOI] [PubMed] [Google Scholar]
- Somero, G. N. 1992. Adaptations to high hydrostatic pressure. Annu. Rev. Physiol. 54:557–577. [DOI] [PubMed] [Google Scholar]
- Tauc, P., C. R. Mateo, and J. C. Brochon. 2002. Investigations of the effect of high hydrostatic pressure on proteins and lipidic membranes by dynamic fluorescence spectroscopy. Biochim. Biophys. Acta. 1595:103–115. [DOI] [PubMed] [Google Scholar]
- Thompson, N. L. 1991. Fluorescence correlation spectroscopy. In Topics in Fluorescence Spectroscopy. J. R. Lakowicz, editor. Plenum, New York. 337–378.
- Van Craenenbroeck, E., and Y. Engelborghs. 2000. Fluorescence correlation spectroscopy: molecular recognition at the single molecule level. J. Mol. Recognit. 13:93–100. [DOI] [PubMed] [Google Scholar]
- Weber, G., and H. G. Drickamer. 1983. The effect of high pressure upon proteins and other biomolecules. Q. Rev. Biophys. 16:89–112. [DOI] [PubMed] [Google Scholar]


