Abstract
An algorithm is described to compute approximate classical trajectories as a boundary value problem with an integration step in the arc length. High-frequency motions are filtered out when a large integration step is used, maintaining the stability of the algorithm. At the limit of high filtering (large steps), but still offering an accurate description of the continuous path, the trajectory approaches the steepest descent path (SDP). The steepest descent path is widely used as a reaction coordinate in chemical systems. At intermediate step sizes, some inertial motions remain, interpolating between reaction coordinates and exact classical trajectories. Numerical studies of spatial and energetic properties of meta-trajectories are carried out. Two systems are considered here: valine dipeptide and the folding of a small helical protein. Although thermodynamic properties of meta-trajectories are affected by the filtering, the ordering of events remains similar for substantial differences in trajectory resolution.
INTRODUCTION
Molecular dynamics (MD) simulations provide valuable, atomically detailed information about the mechanisms, kinetics, and thermodynamics of many biophysical processes. The great utility of these simulations is diminished (somewhat) by their computational complexity, and by the difficulties in approaching highly extended timescales relevant for molecular biophysics. Routine atomically detailed MD simulations are restricted today to the nanosecond timescale, whereas processes in molecular biophysics are frequently extended to microseconds, milliseconds, and even seconds.
A number of approaches were designed to overcome the timescale barrier in MD simulations of macromolecules. These approaches use a variety of assumptions and approximations. In atomically detailed protein-folding studies, common approaches are: a), high-temperature unfolding to accelerate the timescales associated with room temperature motions (Daggett, 2002; Mayor et al., 2003); b), computations of the free-energy surface along predetermined order parameters (Boczko and Brooks, 1995; Brooks, 2002), and c) extrapolation of short time kinetics to long times using an assumed exponential behavior (Snow et al., 2002; Pande et al., 2003). The simulations a–c provide considerable insight into folding mechanisms. These different approaches successfully address diverse types of problems; therefore, studying a new system with a broader set of tools is a clear plus.
Here, we propose an alternative procedure to study processes that occur at long times on the molecular scale. The approximations used in the new algorithm (filtering of high-frequency modes) are very different compared to what was done in the past and can be done in a systematic way. For small steps and essentially no filtering of high-frequency modes, the calculated trajectories approach the exact classical path. At the limit of maximum filtering of high-frequency modes, the trajectories approach the steepest descent path (SDP), a widely used model for a reaction coordinate. Trajectories with an intermediate step are called “meta-trajectories”. In contrast to the SDP, the kinetic energy is considered explicitly in the meta-trajectories. It is therefore expected that at intermediate filtering, they will capture additional dynamic features of the true system that go beyond the use of a reaction coordinate.
A variant of our method (Eastman et al., 2001) was used to study peptide folding. Another boundary value formulation of trajectories that was applied to the protein-folding problem is the MaxFlux algorithm (Huo and Straub, 1997, 1999; Straub et al., 2002). In the Discussion, we compare the proposed methodology to the other long time techniques mentioned above.
In previous publications (Cárdenas and Elber, 2003; Ghosh et al., 2002), we have shown that the approximate trajectories contain valuable information on folding mechanisms that compare favorably with experiment. In Elber et al. (2002), we briefly described the application of the new methodology to a conformational transition in glycine dipeptide and to the folding of a helix. In this article, we provide an in-depth description of the algorithm, the application to a small system (valine dipeptide), and to the formation of a helix.
The meta-trajectories suggest at least two useful features: the identification of i), the slow reaction coordinates,; and of ii), the order of events of the process (e.g., which is first—secondary structure formation, or hydrophobic collapse?). The theory of meta-trajectories is explained in the next section.
THEORY
Consider the principle of minimal action, formulated as a function of length:
 |
(1) |
The classical action is S, the total energy is E, and the potential energy  is a function of the mass-weighted coordinate vector
  . The trajectory
  is parameterized as a function of the arc length l, and dl is an infinitesimal arc-length element (again, in mass-weighted coordinates). We seek a trajectory such that the action is stationary, i.e.,
  . The two end points,
  and
and  , are held fixed.
Equation 1 leads to trajectories that are calculated differently from usual MD simulations. First, the trajectory is solved using boundary conditions; we must know the beginning and the end coordinate vectors. In the usual MD protocol, the initial coordinates and velocities are used. Second, the trajectory is parameterized as a function of length, and not as a function of time. Third, instead of constraining the total time of the trajectory (with a fixed step size and a fixed number of steps) in the new formulation, the energy of the trajectory is fixed. The energy conservation is built into the basic algorithm, whereas in the usual MD simulations, it is possible to simulate systems that do not conserve energies (intentionally or unintentionally).
The first-order variation with respect to the mass-weighted coordinates must be equal to zero (for a classical trajectory), which gives a differential equation with respect to the arc length (Landau and Lifshitz, 1984):
 |
(2) |
The vector  is parallel to the trajectory direction at l and is normalized to 1. Equation 2 does not contain a force component along the direction of the path:
 |
(3) |
In principle, Eq. 2 can be solved with the two initial conditions,  and
and  (note that
  is parallel to dY). However, this differential equation is not advantageous to the time (Newton's) formulation. The term
  of Eq. 2 serves as an effective mass for the integration and is inconvenient for direct numerical integration. It is singular at classical turning points (when
  ) and can change rapidly as a function of l, making the choice of the integration step problematic. From our experience, it is the application to the boundary value problem that makes the length formulation attractive, and not the initial value formulation presented in Eq. 2.
To suggest a numerical algorithm, we consider first a discrete version of the action as formulated in Eq. 1:
 |
(4) |
The action S is now a function of the intermediate coordinates,  , where the coordinate set
  and
and  are held fixed. An expression for a stationary point of the action will be obtained by requiring:
 |
(5) |
This is a nontrivial global optimization problem, since the derivatives are not linear in the coordinates for all practical applications. Nevertheless, there are a few guidelines that we can use. For example, we anticipate that the use of a very small step will recover the exact equations of motion; what can we say about the limit of large steps? Here, it is useful to consider the discrete version of Eq. 2:
 |
(6) |
The length step, Δl, is a constant and is independent of the index i. However, it is not truly necessary. The action integral (Eq. 4) is still valid if Δl of different sizes is used, provided that Δl is small. From a numerical perspective, it is more convenient to keep Δl as small as possible by making all the steps equal. Because steps of equal size are a convenient numerical choice, we enforce this condition by the use of constraints (see “Algorithm” section). No effect on the exact limit of the action is expected. Some variation in the step size may be useful (the path curvature is not uniform in space), but this is a topic for future work.
Consider the solution of Eq. 6 as a function of the step size Δl. Of the two terms on the left-hand side of the equation, only the first term (the “acceleration”) depends on the step size. As the step becomes larger, the acceleration becomes smaller and contributes less to the sum compared with the second term. The step size Δl is considered large when the following condition is satisfied:
 |
(7) |
At this limit, the inertial term is negligible and the variation principle is modified to:
 |
(8) |
Equation 8 can be used as a definition of the SDP. It is the path in which the force is minimized in all directions, excluding the direction of the path (Elber, 1996). Algorithms for the calculations of the SDP and reaction coordinates, based on the above definition, were proposed in the past (Jonsson et al., 1998; Ulitsky and Elber, 1990).
Note another effect when using a large step, Δl: the accuracy of ẽ (used to approximate ê) decreases as a function of the step size. A finite difference formula estimates the path slope ê (Eq. 6) and is less accurate as the step size increases. In contrast with the first term of the right-hand side of Eq. 6, ẽ is not a decreasing function of Δl. It therefore makes significant contributions even at large steps. Moreover, since the path becomes less oscillatory as a function of the step size (some high-frequency oscillations are removed when the step size is getting larger), it may be easier to estimate accurately the path slope for certain decreases in the number of length slices. This is demonstrated in the numerical examples.
In an earlier article (Olender and Elber, 1996), it was shown that a large time step (in the context of a boundary value formulation) filters high-frequency motions. A similar argument holds also for the present formulation in which the trajectory is parameterized as a function of length, and we therefore do not repeat it here. At intermediate step lengths, the solution of the variation problem will yield a trajectory with partially filtered high frequencies. We therefore have:
 |
(9) |
One way of solving Eq. 9 is to define a target function with a minimum that satisfies the equation. Going back to the definition of the classical action may be problematic, since the classical action is not necessarily a minimum of the trajectory (only a stationary point). Others (Passerone et al., 2003) have considered the solution of the stationary trajectory of the action directly. Their procedure, which is aimed at solving trajectories with high accuracy, is more expensive than the approach described here that computes approximate meta-trajectories. We consider the minimization of the function  :
:
 |
(10) |
A complete FORTRAN code of the derivatives is provided in the stochastic difference equation in length module (SDEL), which is a part of the MOIL package (Elber et al., 1995) available from http://cbsu.tc.cornell.edu/software/moil/index.htm.
Equation 10 is not the final form of the target function used in the optimization. There are two more technical points that need to be addressed. The first concerns the overall molecular translation and orientation. Since we compute distances  as norms in Cartesian space, it is important to factor out overall translations and rotations from the individual structures along the trajectory. Imposing linear constraints (see below) on each of the length slices (intermediate coordinate sets) removes these motions. These linear constraints are derived from the Eckart conditions (Elber, 1990), which in mass-weighted coordinates are:
 |
(11) |
The vectors  (of rank 3) include the mass-weighted Cartesian coordinates of atom l in structure k. The vectors
  are a reference coordinate system and are taken from the coordinate sets of the initial guess for the trajectory (before optimization). The total number of atoms is L. Equation 11 consists of 6N linear constraints. We denote these constraints by
  . Since the constraints are linear, finding steps that do not violate the constraints can be done efficiently as discussed below.
The gradients of the constraints and unit vectors in their direction,  , are coordinate-independent. They are computed only once at the beginning of the calculation and used ever after. The unit vectors,
  , of a single length slice are not necessarily orthogonal. For all i,we have (in general)
  . It is useful to have another set of unit vectors that span the same space and are orthogonal to each other in the i subspace. We use the Gram-Schmidt procedure (Czerminski and Elber, 1990a)) for each of the six
  (fixed i) to create another set of orthogonal vectors,
  such that
  These vectors are used in the constrained optimization.
Let  be a discrete representation of the current trajectory that satisfies the constraints. Let
  be a trajectory displacement that we wish to apply to the current representation to obtain a new trajectory
  . The components of
  that violate the constraints' subspace are removed as follows:
 |
(12) |
The new trajectory,  , satisfies the constraints. Note that Eq. 12 will not hold with the vectors
  that are not orthogonal.
Our procedure of correcting only the steps and not the coordinates may be unstable. Small numerical inaccuracies may accumulate over many steps, and the coordinate values may drift away from the plane that satisfies the constraints. However, in our experience with the use of linear constraints, the constraints are not violated in a significant way for tens of thousands of steps, and further corrective measures (beyond the correction of the step) are not required. This is to be contrasted with the solution of nonlinear constraints (e.g., SHAKE (Ryckaert et al., 1977)) for which the coordinates, in addition to the displacements, are adjusted at every step.
The second technical point is concerned with the homogenous distribution of the points along the path (or keeping a uniform Δl for all length slices). There is no force in the path direction, only in the direction perpendicular to it. Therefore, the equations of motion do not determine the density of points along the path, which can be chosen as we please without loss of generality. Nevertheless, it is numerically useful to enforce the homogeneous distribution of points by additional (nonlinear) constraints. We have:
 |
(13) |
The parameter λ is a constant chosen to optimize the calculation efficiency while still maintaining a uniform distribution of points along the curve. The target function used in the optimization is:
 |
(14) |
We seek a trajectory,  , starting from an initial guess
  , such that Θ is a minimum. The trajectory so produced is the exact classical trajectory if the step is small and, is a “meta-trajectory” otherwise.
Note also that the minimization of the target function Θ, which is our way of producing classical trajectories, is a procedure that remains stable almost independently of the step size (in contrast to a solution of initial-value differential equations). This property is what makes the present algorithm considerably more stable than approaches that rely on initial value solvers. It makes it possible to study processes that take longer than what is approachable today by molecular dynamics (Duan and Kollman, 1998). The analytical limits of the computed paths that we have for small steps (a classical trajectory) and large steps (a steepest descent path) are also encouraging. A wide range of step sizes provides useful information on molecular dynamics and reaction pathways, even if exact Newtonian trajectories are unattainable.
In the present article, we focus on meta-trajectories obtained with a solution of  . As we showed in earlier studies, meta-trajectories provide information on the order of events in complex molecular processes such as protein folding (Cárdenas and Elber, 2003; Ghosh et al., 2002). In extracting the order of events, we rely on the monotonous relationship between time and length:
 |
(15) |
The integral suggests that events 1 and 2, at lengths  , occurred at times
  . We assume that the above relationship holds when we approximate the trajectory by a discrete set of configurations.
THE ALGORITHM
In the present section, we describe the algorithm used to compute meta-trajectories:
Determine beginning and ending coordinate sets,
 and
and  . A trajectory is computed as a boundary value problem, and the first step is to determine the fixed end points. In the examples considered in this article, we use energy minima. For example, in valine dipeptide, we used the minimized coordinates of the
  axial and the
  equatorial conformations as the coordinates of the end configurations.
Determine an initial guess for the trajectory using N intermediate configurations
 . In most cases, we use a minimum energy path as a starting point for the meta-trajectory calculations. As argued in the previous section, the SDP is a limiting solution of the basic equations. Essentially, every classical trajectory can be mapped into an SDP by monotonically decreasing the inertial term. Reduction in the inertial term can be related to an increase in the step size. In practice, we use our minimum-energy-path self-penalty walk (SPW) algorithm (Czerminski and Elber, 1990b)) to produce an initial guess for SDEL optimization. The SPW approach computes minimum energy paths that approximate the SDP and are in most cases sufficient for the initial guess requested here. We denote the initial guess by
Estimate the kinetic and total energy of the trajectory. Once a minimum energy path is provided, we can examine the higher and the lower values of the potential energy. If we start at a minimum with the lowest potential energy point,
 , and the highest energy value along the steepest descent path is
  , the kinetic energy at the minimum must be larger than
  . For convenience, we take it to be
  which is the average thermal energy measured at the top of the barrier. The Boltzmann constant is
  , and T is the absolute temperature. Sampling from Maxwell distribution of velocities is also possible. However, the above protocol is what we used in the present study.
-
Optimize the initial guess for the trajectory. Start from the initial guess
 and optimize a trajectory for K steps. A step in the optimization can be based on the conjugate gradient Powell algorithm (Press et al., 1986), or on simulated annealing where the target function to be optimized is Θ. In both cases, the displacement added is subject to the constraints of Eq. 11. For example, in simulated annealing we solve the second-order differential equations for the trajectory
  :
: 
(16) The fictitious time, τ, is used only for generating intermediate steps during the minimization and has no meaning otherwise. The total minimization “time” is Φ. In simulated annealing, a fixed number of steps is used, whereas with the conjugate gradient algorithm, we optimize until the gradient norm is lower than a threshold. We have found (perhaps not surprisingly) that the minimization with conjugate gradient results in meta-trajectories closer to the steepest descent path, whereas the minimization with simulated annealing provides trajectories that deviate significantly from the minimum energy path and include more oscillations in the minima. This indicates that multiple solutions exist, and different optimization protocols can pick alternative trajectories. Note that even exact trajectories (solutions of the boundary value problems with a very small step) can have multiple solutions in the length representation. Hence, the last observation of multiple trajectories is not necessarily a result of our approximation or our optimization protocol.
Evaluate and refine the trajectory. The meta-trajectories are likely to be longer that the minimum energy path that does not include rapid vibrations. Since the number of grid points is kept constant, the step size increases when a trajectory is computed starting from a minimum energy path. Therefore, the final step size of an optimal path with a fixed number of slice points is checked against a critical value. The critical value,
 , depends on the properties of the system. For example, in the simulation of the folding of cytochrome C (Cárdenas and Elber, 2003), the maximum step size was set to 0.6 Å. If Δl is larger than
  , then the trajectory is not accepted; more intermediate points are added by halving the existing intervals, and a trajectory with more length slices is reoptimized as described in section iv.
It is clear from the description of the algorithm that the trajectory we compute (that falls in the neighborhood of a steepest descent path) depends on the characteristics of the sampled minimum energy coordinates. The meta-trajectories will have a distribution of energy barriers, some of which are quite high. Minimum energy paths with high energy barriers are theoretically valid; however, they are less likely to be sampled as thermal trajectories. Numerically, they are also more difficult to compute since the combination of high kinetic energy and high barriers implies rapid changes in the path curvature. In the study below, we focus on sampling trajectories in the neighborhood of low-barrier minimum-energy paths. Hence, we deliberately select minimum energy paths with low energy barriers for refinement to classical (or meta-) trajectories from the complete ensemble of minimum energy paths.
In addition to the solution of a boundary value formulation, we also solved MD trajectories using initial values. In this case, we have for initial conditions the two coordinate sets  and
and  that we obtained from the boundary value solution. We propagate the solution using:
 |
(17) |
The algorithm is not highly accurate or stable (the estimate for the path slope is based on  and
and  instead of
  and
and  ) but is sufficient for the task at hand, which is a comparison to the boundary value algorithm.
NUMERICAL EXAMPLES
We present numerical examples for two cases: i), a conformational transition in valine dipeptide, and ii), the folding of a small helical protein, Ac-WAAAH+-(AAAR+A)3A-NH2 (Thompson et al., 2000). The force field that was used in the calculation is the extended atom model of AMBER/OPLS (Jorgensen and Tirado-Rives, 1988; Weiner et al., 1984) as implemented into our code MOIL (Elber et al., 1995). The study of valine dipeptide was done in vacuum, whereas helix folding was investigated in an effective solvation model, the generalized Born (GB) model (Hawkins et al., 1995; Tsui and Case, 2000)).
Valine dipeptide
We report trajectories computed between minima of the dipeptide energy surface. The  axial and the
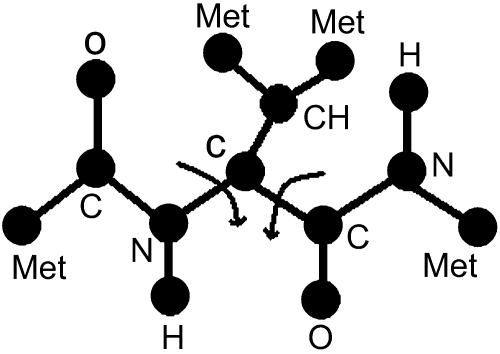
  equatorial backbone conformations of valine dipeptide are considered. Conformational transitions in this small molecule are dominated by changes in two soft degrees of freedom, the (φ,ψ) torsion angles. In Fig. 1, we show a stick-and-ball model of this molecule with the relevant torsions indicated, and in Fig. 2 we show a (φ,ψ) map.
FIGURE 1.
Stick-and-ball model of valine dipeptide showing the ϕ and ψ torsional angles.
FIGURE 2.
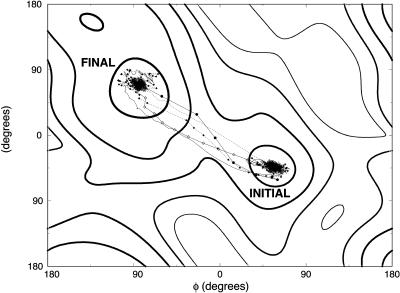
Meta-trajectories with 10 (solid lines with circles), 100 (dotted line with diamonds), 1000 (solid line) and 10,000 (dotted line) slices connecting the C7 equatorial (initial) and axial (final) conformations of valine dipeptide shown on a two-dimensional (ϕ, ψ) map. These trajectories were computed independently with initial guess trajectories computed using a SPW algorithm. Also shown is the SDP connecting these conformations (solid line with white diamond).
A set of trajectories refined independently
On the two-dimensional map (Fig. 2), we indicate the beginning and the ending configurations, and plot meta-trajectories and the steepest descent path. Meta-trajectories with 10, 100, 1000, and 10,000 length slices in (φ,ψ) space are shown. These trajectories were computed independently, meaning that the minimum energy paths were constructed by separate (independent) calls to a minimum-energy algorithm (the SPW algorithm (Czerminski and Elber, 1990b)), and an action optimization was applied to each of the initial guesses.
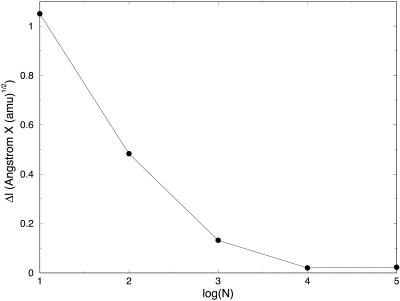
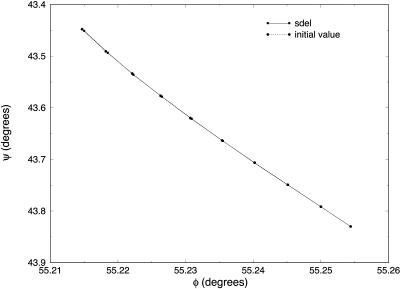
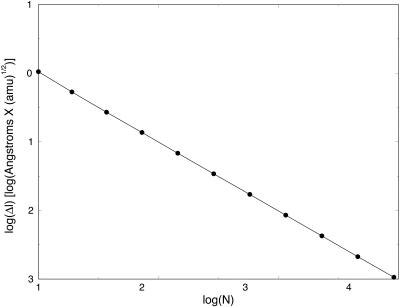
In Fig. 3, we show the step, Δl, as a function of the number of length slices of fully optimized trajectories. We expect the basic step, Δl, to decrease as a function of the number of slices. This in general is the case. However, when the number of grid points is very large, further reduction in step size as a function of the number of points is slow. Initially, we find a significant reduction in step size when a trajectory of 10 slices is compared to trajectories of 100 and 1000 slices. However, when the number of length slices increases to 104 and 105, Δl changes comparatively little. We found it difficult to decrease the step further to make a more meaningful comparison to initial value formulation. In Fig. 4, we demonstrate that for 0.003 (amu1/2 Å), we obtain similar initial value and SDEL results. The step is the largest size for which the initial value integrator is still stable for valine dipeptide. This step size is ∼10 times smaller than the step size we achieved using 105 slices with independently refined trajectories.
FIGURE 3.
Mass-weighted length step is plotted as a function of the logarithm (base 10) of the number of slides for the SDEL trajectories connecting the initial and final conformations of valine dipeptide.
FIGURE 4.
Comparison between a refined SDEL trajectory for valine dipeptide with Δl = 0.003 (amu1/2 Å) and the corresponding solution of the initial-value molecular dynamics equation (Eq. 17) is shown in (ϕ, ψ) map.
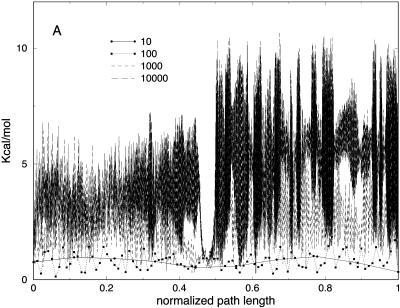
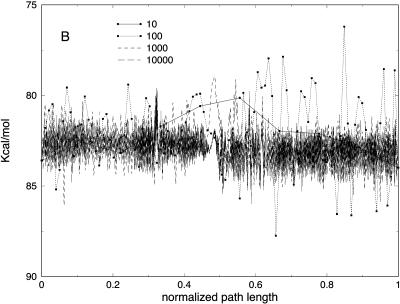
In Fig. 5 A we show the potential energy of the bonds for the trajectories with different slices. As we argued earlier, the low-resolution few-slice representation filters high-frequency modes. Bond vibrations (high-frequency motions), are expected to cool down as the number of slices decreases. This is indeed the case; in Fig. 5 A, the trajectory with 10 slices is of the lowest bond energy. In contrast, the electrostatic energy (Fig. 5 B) is roughly the same for the low resolution trajectories. Note also that the behavior of the longest trajectories of 103 and 104 slices is similar. This is explained by a similar Δl for the two cases regardless of the number of length slices (Fig. 3).
FIGURE 5.
(A) Bond and (B) electrostatic energy versus the normalized path length for meta-trajectories for valine dipeptide with 10, 100, 1000, and 10,000 slides.
Refining a single trajectory of valine dipeptide
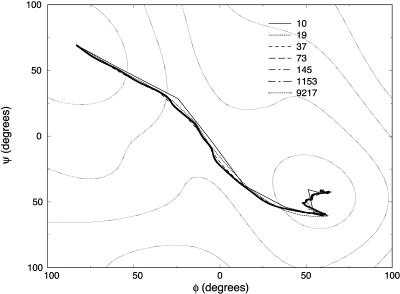
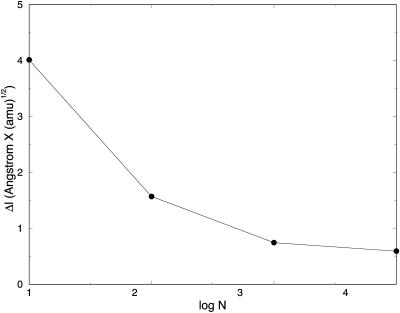
The calculations presented above were for trajectories constructed independently. Here, we consider the refinement of a single trajectory. Starting from a low-resolution minimum energy path (constructed with the SPW algorithm (Czerminski and Elber, 1990b)) with 10 points, we computed an SDEL path with the same number of length slices. The resulting trajectory was used in resolution enhancement. A series of path optimizations was performed; at each optimization the initial number of grid points of the previous optimization was doubled by adding a new configuration at the center of each length slice. A minimization (with conjugate gradient) of the new path converged when the gradient of the target function was <0.01 kcal/mol/Å. The halving procedure was repeated until we have 9217 slices to describe the single trajectory. The final step size was 0.00106 (amu1/2 Å).
In Fig. 6, we show the different trajectories on a (ϕ,ψ) map. What is remarkable about this plot is the high similarity of the refined trajectory (presumably close to exact) and the initial SDEL path. Note also that the present protocol produces steps that decrease rapidly with the number of slice points (Fig. 7). It selects trajectories that are closer to the SDP, compared to global search algorithms such as simulated annealing.
FIGURE 6.
Meta-trajectories connecting the C7 equatorial (initial) and axial (final) conformations of valine dipeptide shown on a two-dimensional (ϕ, ψ) map. The trajectories were computed by resolution enhancement (e.g., the initial guess for the 19-slide trajectory was obtained by interpolating 1 intermediate structure between every segment of the 10-slide trajectory computed by SDEL; a similar doubling procedure was used to generate the rest of the trajectories).
FIGURE 7.
Mass-weighted length step is plotted as a function of the logarithm of the number of slides for the SDEL trajectories of valine dipeptide constructed using the resolution enhancement procedure.
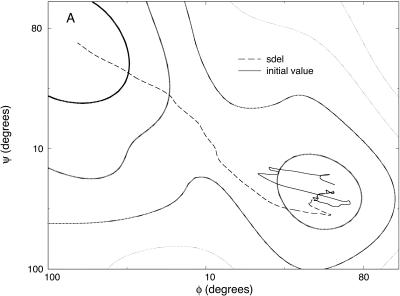
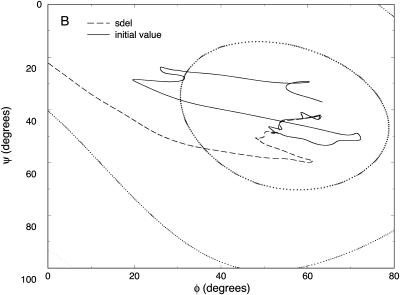
In Fig. 8, we compared an SDEL trajectory with a large number of slices and an initial value solution of the equations of motion. The path slope of the reactant (required for the initial value solver) was estimated from the SDEL solution. Although the SDEL and the initial value solver (Eq. 17) agree for a few steps (see also Fig. 8 B for a close-up), they rapidly deviate.
FIGURE 8.
(A) Comparison between the SDEL trajectory with 9217 slides (Fig. 6) and a path computed using the initial-value algorithm (Eq. 17). (B) Detail of A showing the region in which trajectories start to diverge.
Valine dipeptide was used to demonstrate the feasibility and the soundness of the calculations. Below, we describe trajectories of helix formation, a larger system that is also of considerable biophysical interest (see Discussion).
A folding trajectory of a helical peptide
We consider the alanine-rich peptide WAAAH+-(AAAR+A)3A that has a significant tendency to form a helix. The thermodynamic and kinetic properties of this peptide were determined experimentally (Thompson et al., 2000). The SDEL trajectories are used to study the folding mechanism.
The boundary conditions were an energy-minimized configuration starting from an ideal helix (the list of the (ϕ,ψ) angles of the minimized structure is given in Table 1) and one (locally minimized) structure from an ensemble of unfolded configurations. The unfolded configurations were prepared as follows: 10 high temperature trajectories (600 K) in the gas phase were computed for 1 ns each. Structures were saved each 50 ps, and were minimized using conjugate gradient algorithm for 2000 steps. The usual energy function of MOIL (Elber et al., 1995) was employed with the addition of a GB model (Hawkins et al., 1995; Tsui and Case, 2000) for implicit solvation. We have used this GB model successfully in the past for other SDEL applications (Cárdenas and Elber, 2003; Ghosh et al., 2002).
TABLE 1.
ψ/ϕ angles of the folded conformation for WAAAH+-(AAAR+A)3A
| ψ (degrees) | ϕ (degrees) |
|---|---|
| −34.7165 | −58.5412 |
| −42.8834 | −73.4939 |
| −46.6180 | −65.5121 |
| −44.1895 | −75.4107 |
| −52.7535 | −157.822 |
| −36.2577 | −56.3282 |
| −27.7473 | −51.5534 |
| −32.2661 | −64.5518 |
| −34.1912 | −72.9191 |
| −43.121 | −69.7539 |
| −48.1652 | −58.428 |
| −46.0091 | −57.8565 |
| −41.8973 | −61.6938 |
| −34.7618 | −67.8165 |
| −41.5916 | −69.6428 |
| −54.2888 | −58.8207 |
| −49.8535 | −77.6352 |
| −51.0633 | −160.786 |
| −25.6122 | −83.5527 |
| −62.8926 | −84.9656 |
| −154.278 | −166.624 |
A total of 114 unfolded structures that differ from each other by at least 6 Å RMS was selected and used in the computations of 114 folded trajectories. Similarly to the calculations of the valine trajectories, minimum energy paths were calculated first using the CHMIN module of the MOIL package (and the SPW algorithm (Czerminski and Elber, 1990b)). These initial guesses for the trajectories were further optimized by a simulated annealing protocol available in the SDEL program. The SDEL code is a part of the recently released MOIL package (http://cbsu.tc.cornell.edu/software/moil).
We have examined trajectories with 100 and 1000 length slices for each of the 114 trajectories. The calculation of a single trajectory with 1000 length slices was done in parallel with 10 nodes of a 600 MHz Linux cluster for 8 h. We also computed trajectories with 10 and 10,000 structures for a few of the set of 114 folding trajectories.
In Fig. 9, we show the dependency of the step size Δl on the number of length slices. Note that with the simulated annealing approach, we were unable to reach step sizes (in length) that are smaller than 0.6 (amu1/2 Å). There is a rapid drop in the step size as the number of length slices increases from 10 to 1000. However, increasing the number of length slices from 1000 to 10,000 decreases the size of the length step only slightly.
FIGURE 9.
Mass-weighted length step versus the logarithm of the number of slides for trajectories connecting one unfolded conformation of the alanine-rich peptide WAAAH+-(AAAR+A)3A to the helical conformation.
Note also that the trajectory calculations here employed separate and independent simulated annealing protocols for each of the trajectories. Hence, they are similar in behavior to the first set of valine dipeptide paths (see the subsection, “A set of trajectories refined independently”).
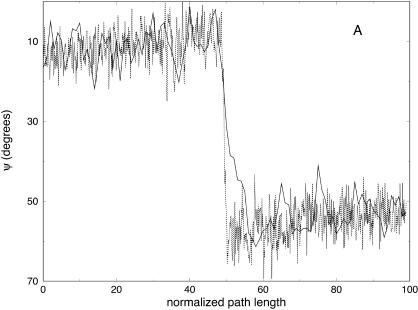
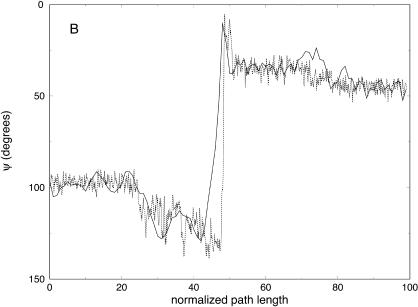
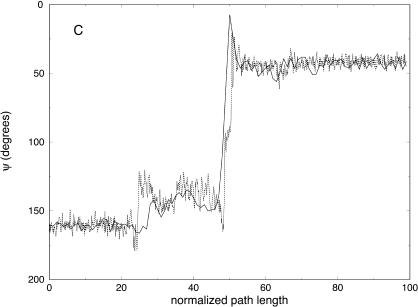
In Fig. 10, we show a few of the ψ dihedral changes for trajectories computed independently with 100 and 1000 length slices. The overall agreement of the two trajectories is remarkable, suggesting convergence for spatial properties of the trajectories already with this number of slices. Note the “rapid” fluctuations that we observe in the trajectories with a larger number of slices when compared to trajectories with a smaller number of slices. This suggests that we are clearly not at the limit of the steepest descent path, and some high-frequency modes are filtered out while switching between the two representations.
FIGURE 10.
Variation of the ψ angle as a function of the normalized path length for trajectories with 100 (solid line) and 1000 (dotted line) slides connecting one unfolded conformation of the alanine-rich peptide and the native helical structure. The ψ angles correspond to the amino acids: (A) His-5, (B) Ala-12, and (C) Ala-15.
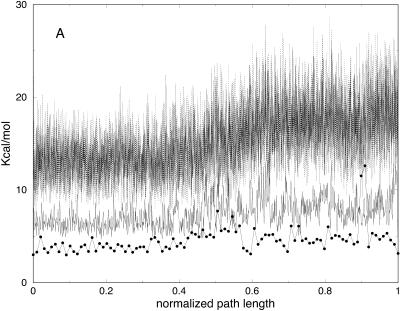
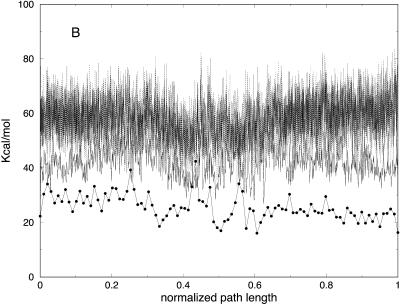
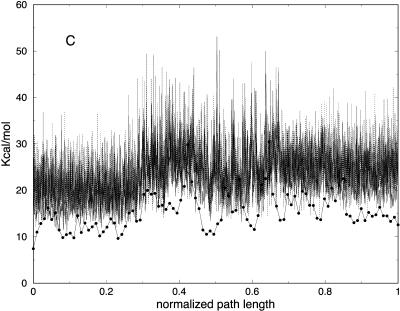
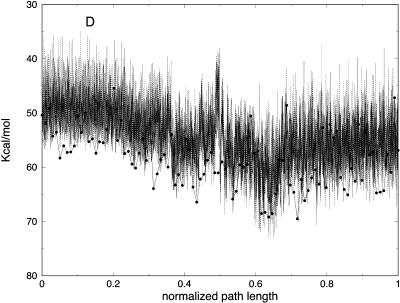
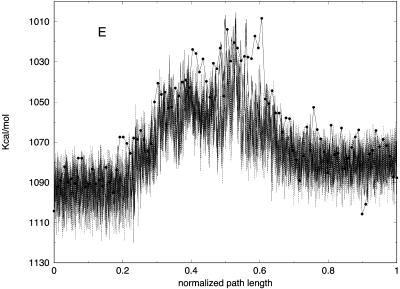
Partitioning of the energy between bonds, angles, torsions, van der Waals, and electrostatic components as a function of the number of slices (for 100, 1000, and 10,000 slices) is presented in Fig. 11. Similar to the valine dipeptide case, we observe significant quenching of the high-frequency (bond) modes. On the other hand, the relevant spatial progress of the trajectory (the (φ,ψ) dihedral angles) is remarkably similar in different trajectory resolutions (Fig. 10).
FIGURE 11.
(A) Bond, (B) angle, (C) torsion, (D) van der Waals, and (E) electrostatic energy versus normalized path length for folding trajectories for one unfolded conformation with 100 (solid line with circles), 1000 (solid line), and 10,000 (dotted) slides.
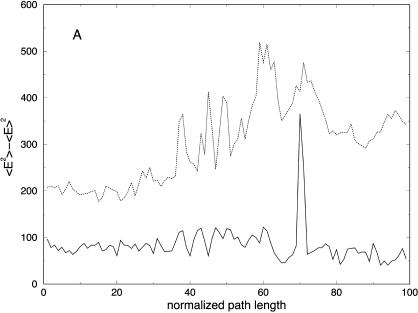
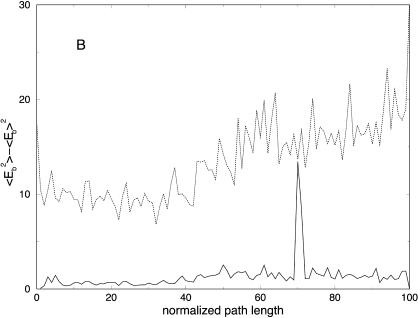
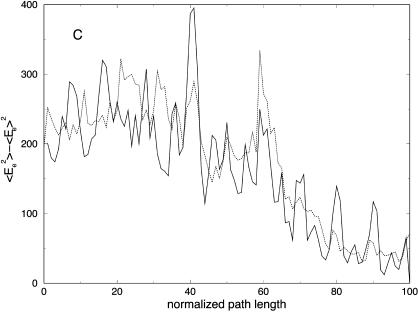
It is of interest to examine how thermodynamics properties are affected by the filtering protocol that we use. The bond and the electrostatic energies for different numbers of slices are shown in Fig. 11, A and E, demonstrating again the filtering effect, now on a significantly larger system. The energy fluctuations (related to the heat capacity) are computed as an average over all trajectories and are shown in Fig. 12 A. We plot the energy fluctuations as a function of the number of slices. We also consider the energy fluctuations separately for the bond energy and for the electrostatic energy (Fig. 12, B and C). Interestingly, the energy fluctuations for electrostatics are similar for 100 and 1000 length slices. Since the heat capacity of high-frequency modes is difficult to assess in classical simulations anyway, filtering them out, as demonstrated here, may not be a bad idea. Of course, in our approximate calculations, some of the classical modes may be filtered as well.
FIGURE 12.
(A) Potential energy variance as a function of the normalized path length for trajectories with 100 (solid line) and 1000 (dotted line) slides. This plot was computed as an average over the ensemble of 114 trajectories for the helical peptide, (B) bond energy, and (C) electrostatic energy variances.
The mechanism of helix formation is of considerable theoretical and experimental interest (Huang et al., 2002; Hummer et al., 2001; Thompson et al., 2000); we therefore devote the rest of this section to the analysis of the calculated trajectories elucidating the folding mechanism suggested by the simulations.
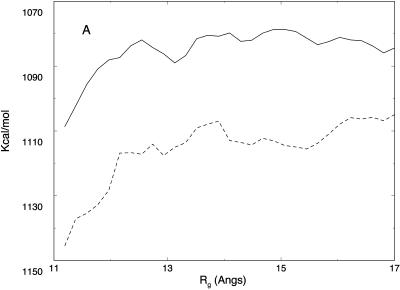
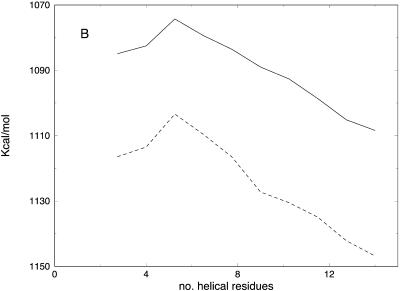
In Fig. 13 A, we consider the average energy (over 114 trajectories) as a function of the radius of gyration (the radius of gyration was suggested in the past as a reaction coordinate for folding (Boczko and Brooks, 1995), though not for the problem of helix formation). The average energy is a monotonically increasing function of the radius of gyration, suggesting no barrier along this coordinate. Similar plots are obtained using 100 or 1000 slices. Note, however, that such a barrierless plot can be misleading. It is possible that motion in the direction perpendicular to the radius of gyration includes a barrier that is undetected by the above projection, i.e., the “true” reaction coordinate is overcoming a barrier in a direction perpendicular to the radius of gyration. The projection may eliminate an essential barrier and suggest an incorrect mechanism. This is indeed the case if we examine the energetic of ϕ/ψ helicity (Fig. 13 B). The energy plot along the number of helical residues has a clear barrier at an earlier phase of the process. The different characteristics of the average energy profile, projected along different coordinates, underline the difficulties in choosing appropriate reaction coordinate(s).
FIGURE 13.
Potential energy computed for the sets of 114 trajectories with 100 (dotted line) and 1000 (solid line) slides as a function of the (A) radius of gyration and (B) number of helical residues present in the structure (a residue is helical if the ϕ/ψ angles are ± 20° of −57.5° and −47°, respectively).
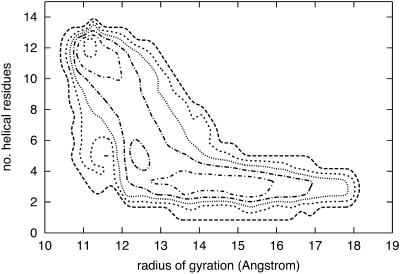
A contour plot of the joint probability density of the radius of gyration and the number of helical residues is shown in Fig. 14. This is a steady state plot that includes only reactive trajectories. The two-dimensional projection suggests that the barrier is found rather late in the radius-of-gyration projection (but early along the secondary structure coordinate), and that it is indeed perpendicular to the radius of gyration.
FIGURE 14.
Contour plot of the steady-state population of conformations for the alanine-rich peptide as a function of the number of helical residues and the radius of gyration. The 114 paths with 1000 slides were used to generate the plot.
In Fig. 15, we show the propagation of the two-dimensional probability density as a function of length. The average is over all the 114 trajectories and the corresponding fifth of each of the trajectories. Five sequential plots, measuring the progress of the reaction as a function of length, are shown. The plots suggest an early folding phase in which the radius of gyration is reduced, which is followed by (initially activated) secondary structure formation.
FIGURE 15.
Progress of the population of the peptide conformations along the folding trajectories is plotted as a function of the number of helical residues and the radius of gyration. The first plot (A) contains structures from the first fifth of each of the 114 trajectories, the second plot (B) from the second fifth, and so on. The trajectories with 1000 slides were used to generate the plots.
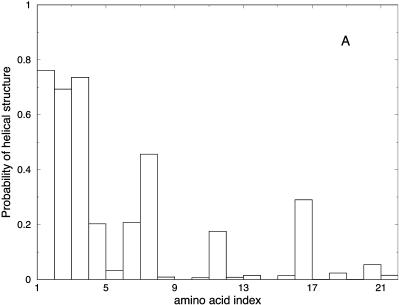
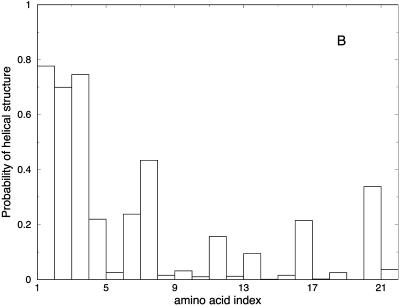
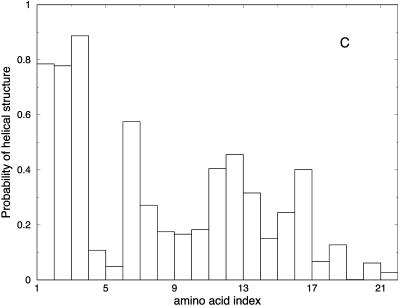
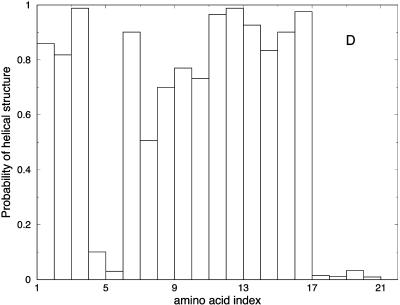
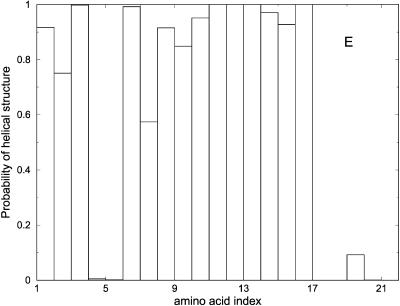
Another view of the folding mechanism is provided in Fig. 16, where we show the probability that a given amino acid is in a helical configuration. These probabilities are evaluated for different length windows. Fig. 16 A is an average over the first fifth of the trajectory, Fig. 16 B over the second fifth, and so on. It is clear from the figure that N-terminal residues fold first.
FIGURE 16.
Probability of helicity for each of the residues in the alanine-rich peptide is plotted for every fifth of the trajectory. A is the average for the first fifth of the trajectories, B is the average for the second fifth, and so on. These are average plots computed over the 114 paths with 1000 slides.
DISCUSSION
Perspective on algorithms for long time dynamics
Folding starts at the tens and hundreds of nanoseconds to form secondary structure elements, and continues to microseconds and milliseconds to create specific tertiary contacts and folds. Straightforward molecular dynamics simulations are restricted to the nanosecond timescales, making it exceptionally difficult to perform individual trajectories at extended timescales and to collect statistics to compute kinetics and thermodynamic averages that can be compared to experiment.
Therefore, a number of different approaches were designed to circumvent the timescale problem of straightforward atomically detailed simulations. Part of this discussion intends to put the present approach in perspective with respect to other techniques. The other part of the discussion deals with comparison to experimental data on helix formation. The intent of the discussion below is to highlight the potential difficulties in all computational approaches, i.e., underlining the need for multiple computational methods that complement each other in the studies of protein folding.
Consider first the approach that uses high temperatures. Considerable intuition and tests were used to construct computational protocols that were demonstrated to have excellent agreement with experiment, e.g., by the calculations of Φ-values (Daggett, 2002; Mayor et al., 2003). However, one should keep in mind that the high temperatures may distort the folding pathways and make them more direct and less diffuse. The extent of the distortion is not clear.
The free-energy calculations are a systematic reduction in the number of relevant variables to one or a few order parameters (Boczko and Brooks, 1995; Brooks, 2002). This reduction, provided that the calculations are converged, is exact and can be related to specific experiments that are done near or at equilibrium. A difficulty is, however, the choice of the order parameters. Projections of the high-dimensional space onto inappropriate order parameters can lead to qualitatively wrong results. Although considerable experience has been obtained using a number of reaction coordinates (e.g., the radius of gyration, secondary structure content, fraction of native contacts, etc.) the correct choice (if a “correct” choice exists) is still unclear.
Clever protocols to compute free-energy landscapes without a prior assumption of a reaction coordinate are the emerging multicanonical and replica exchange approaches (Gnanakaran et al., 2003; Hansmann, 2003; Hummer et al., 2001; Mitsutake et al., 2003). These protocols provide an equilibrium ensemble of configurations with no further bias, which is an important step in establishing a general theory for kinetics and dynamics.
Consider the third option of interpolation from short time kinetics, which is the most straightforward approach available today. There, it is assumed that a single barrier dominates the process at hand. From a spatial viewpoint, the reactive trajectories are expected to be similar and differ by incubation time at the well. If the transition rate “constant” is time-independent, the rate can be estimated from short trajectories (Snow et al., 2002; Pande et al., 2003), fitting the kinetics to exponential law. The population of reactive trajectories can be enriched if a measure of the progress of the reaction is available, i.e., selecting trajectories that made good progress toward the folded state and using only them while further propagating the ensemble of trajectories. Voter put forward this idea (Voter et al., 2002) for general activated trajectories.
The great advantage of the interpolation protocol, compared to the alternatives, is the estimation of the timescales. The potential difficulty is the assumption of an exponential process or the requirement for a “measure-of-progress” variable. The latter is similar in spirit to the identification of an order parameter in free-energy calculations.
Our SDEL approach has the advantage that no order parameter is assumed, and the energy of the trajectories corresponds to that of room temperature. It is the only algorithm today that provides sound results for atomically detailed folding mechanisms in proteins with more than 100 amino acids and with experimental folding timescales of milliseconds (cytochrome C (Cárdenas and Elber, 2003)).
However, there are also difficulties. First, an approximation is used in the calculations, namely the filtering of high-frequency modes. The effects of this approximation on the trajectories are not obvious and require experimentation (such as the numerical experiments in the present article). There is a wide agreement that filtering of some high-frequency modes is sound (e.g., bond vibrations). However, the SDEL approach filters out all frequencies higher than the inverse of the step size, and not only the bond motions. This makes the approximation more difficult to evaluate. One consequence of the filtering is that the entropy of SDEL trajectories, which effectively have a smaller number of degrees of freedom, is reduced compared to the entropy of the exact trajectories. The reduction of entropy reduces entropic barriers and shortens “incubation times” within wells.
There is an interesting analogy here between the SDP as a fully quenched molecular dynamics trajectory and Stillinger's inherent structures (Stillinger and Weber, 1984). The quenched configuration (removal of the kinetic energy) provided considerable insight into the structural and thermodynamic properties of liquids. Here, we suggest that quenched trajectories, at a complete or intermediate levels, can provide significant insight into system kinetics and dynamics as well. Similar to the inherent structures, the quenched trajectories are a useful analysis tool for static and mechanisms. Similar to the inherent structures, it is not obvious how to efficiently perform the ensemble averages to compute thermodynamic and kinetic properties after removing some or all of the kinetic energy. We comment that in the numerical examples in Figs. 11 and 12, the energy and heat capacity for slow degrees of freedom are preserved in a wide range of trajectory resolutions, supporting the suggestion that the slow modes are affected only slightly by the filtering.
A few other laboratories are developing approaches that are similar in spirit to the algorithm described here. Eastman et al. (2001) were using the Onsager-Machlup action that we developed as a numerical tool (the time formulation of the stochastic difference equation (Olender and Elber, 1996)) to study conformational transitions in peptides. A key difference compared to our calculations is the use of the high friction limit and the simulation of Brownian trajectories. Our trajectories approximate Newtonian's mechanics. Straub and co-workers in their studies of peptide aggregation (Huo and Straub, 1997, 1999; Straub et al., 2002) introduced the MaxFlux approach in which the high friction limit again is considered. However, the Straub definition of an optimal trajectory is different from the approach taken in the Onsager-Machlup formulation. It is based on maximizing the flux of the diffusion equation and, in contrast to Olender and Elber (1996), is based on the length discretization, not on time. An alternative path formulation of Brownian trajectories in length seeks the most probable Brownian trajectories between two end points (Elber and Shalloway, 2000; Olender and Elber, 1997).
Finally, the “path sampling” procedure of Chandler and co-workers (Bolhuis et al., 2002; Dellago et al., 1998) may look conceptually similar to the procedure described in this article, but it is actually very different. Path sampling was designed to solve the problem of rare events, namely how to determine fast trajectories (a few picoseconds) from reactants to products that occur infrequently. This is the typical case for one dominant barrier separating two distinct states. A clever formula is used to estimate the statistical weights of these reactive trajectories and, from the weights, the rate. However, this approach is not about generating long time trajectories for systems without clear timescale separation; timescale separation is essential for the path-sampling approach.
Another significant approximation used here and in our earlier studies of protein folding (Cárdenas and Elber, 2003; Ghosh et al., 2002) is the application of the generalized Born theory (Hawkins et al., 1995) for modeling solvent effects. This choice was made for obvious reasons (saving very significant computational resources). However, it is useful to consider potentially more accurate models of solvation, and we are extending our calculations to include explicit water molecules. One effect that the implicit solvent is missing (in the study of helix formation below) is the potential screening of hydrogen bonds by large side chains (Garcia and Sanbonmatsu, 2002; Vila et al., 2000).
In an earlier version of our stochastic difference equation (SDET—stochastic difference equation in time (Elber et al., 1999)), we added explicit water to the protocol by optimizing an average action. The average was calculated on alternative water configurations for a fixed peptide state. Before an optimization step was made for the peptide coordinates, an average over (discrete) water configurations was computed using molecular dynamics. The average (with fixed protein coordinates) was calculated separately and independently for each of the trajectory slices,  . This is similar in spirit to a Car-Parrinello procedure (Car and Parrinello, 1988) in which the equilibrated water molecules play the role of the electrons. A similar algorithm has now been added to SDEL, making it possible to study conformational transitions and folding in explicit solvent (Siddiqi and Elber, unpublished).
The folding of a helix
Thompson et al. (2000) have studied experimentally the helix-coil transition of the peptide we considered here, and they made a number of observations that can be connected to the present calculations: i), an activation energy of ∼8 kcal/mol was measured, and ii), the helix formation starts at the N-terminal.
Fig. 13 B clearly demonstrates that the process is activated, and that the activation is associated with the transition of the first five residues into the first helical turn. We note that no barrier is observed along the direction of the radius of gyration,  . This coordinate is therefore a poor choice for a reaction path in this system. There are many conformations, some of them separated by a significant energy barrier, that are binned together in a narrow range of radius-of-gyration values and create a wrong interpretation of a barrierless transition. The barrier occurs when
  is at the range 12–13 Å, and its direction is roughly perpendicular to
  , making it difficult to observe in the one-dimensional projection along
  .
.
Thompson et al. (2000) estimated the enthalpy barrier to be 8 kcal/mol. From Fig. 13, we estimated it to be ∼10 kcal/mol, which is in surprisingly good agreement with the experimental analysis. We should keep in mind, however, that the accuracy of the enthalpy barrier in this calculation is rather low, and studies of mechanisms (such as order of events and the nucleation site at the N-terminal) are consistently more reliable (Cárdenas and Elber, 2003; Ghosh et al., 2002).
The interesting observation (Huang et al., 2002) that helix formation can show diffusive kinetics is not inconsistent with the simulations presented here. In the two-dimensional projection of the folding process onto the radius of gyration and helical content coordinates (Fig. 14), the barrier appears rather late. There is considerable barrierless motion along the radius-of-gyration coordinate before the nucleation barrier is encountered along the helical content coordinate. Computationally, the diffusive behavior of α-helix formation was shown earlier (Hummer et al., 2001) using molecular dynamics.
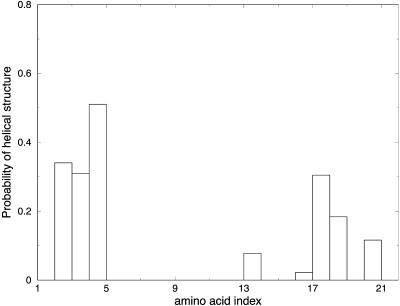
In Fig. 16, we plot the probability that a given residue will be in the helix conformation. Fig. 16 A is an average over the first fifth of the trajectory, Fig. 16 B is on the second fifth, and so on. Our trajectories clearly support a nucleation site at the N-terminal. This result is consistent with straightforward molecular dynamics at room temperature that we run for 10 ns with the hope of observing evidence for nucleation (Fig. 17). The molecular dynamics trajectories suffer from one major difficulty: the length of the trajectory is too short to observe the complete formation of the helix (hundreds of nanoseconds) and is barely adequate to observe nucleation (20 ns). Nevertheless, molecular dynamics can be useful to seek early events, if we know what we are looking for (such as the use of a progress measure). Here, we look for amino acids that adapt helical configuration early in the folding process. Indeed, the molecular dynamics trajectories after 10 ns (Fig. 7) suggest a transient nucleation at the C-terminal and a more stable nucleation at the N-terminal. Interestingly, Boczko and Brooks (1995) have found that helix formation in a three-helix bundle started at the N-terminal as well. However, the helix was different, and it is hard to draw general conclusions about nucleation. A recent publication by Chowdhury et al. (2003) suggested a different mechanism for helix formation—breaking a hydrophobic cluster. So, although the present study suggests a nucleation site at the N-terminal (in accord with experimentation for the above particular helix (Thompson et al., 2000)), the general mechanism of helix formation is still unknown.
FIGURE 17.
Probability of helicity for each of the residues in the alanine-rich peptide is plotted for the last fifth of the trajectory for three different folding trajectories computed using room-temperature molecular dynamics simulations. The initial conformations were unfolded structures for the peptide. The MD run was 10 ns, and the implicit GB model was employed.
CONCLUDING REMARKS
We have presented a detailed algorithm to compute long time processes in the length representation. Though the algorithm was already used in large systems (protein A and cytochrome C (Cárdenas and Elber, 2003; Ghosh et al., 2002), this is the first in-depth description of the algorithm and its evaluation with respect to other numerical methods. An advantage of the algorithm is that in the worst-case scenario it provides trajectories close to the steepest descent path, and at intermediate levels it interpolates between exact classical trajectories and the usual definition of a reaction coordinate in chemical physics.
Acknowledgments
This work was supported by a National Institutes of Health grant to R.E.
Alfredo E. Cárdenas's present address is Dept. of Chemistry, University of South Florida, Tampa, FL 33620.
References
- Boczko, E. M., and C. L. Brooks. 1995. First-principles calculation of the folding free-energy of a 3-helix bundle protein. Science. 269:393–396. [DOI] [PubMed] [Google Scholar]
- Bolhuis, P. G., D. Chandler, C. Dellago, and P. L. Geissler. 2002. Transition path sampling: throwing ropes over rough mountain passes, in the dark. Annu. Rev. Phys. Chem. 53:291–318. [DOI] [PubMed] [Google Scholar]
- Brooks, C. L. 2002. Protein and peptide folding explored with molecular simulations. Acc. Chem. Res. 35:447–454. [DOI] [PubMed] [Google Scholar]
- Car, R., and M. Parrinello. 1988. Structural, dynamical and electronic properties of amorphous-silicon: an ab initio molecular dynamics study. Phys. Rev. Lett. 60:204–207. [DOI] [PubMed] [Google Scholar]
- Cárdenas, A. E., and R. Elber. 2003. Kinetics of cytochrome c folding: atomically detailed simulations. Proteins. 51:245–257. [DOI] [PubMed] [Google Scholar]
- Chowdhury, S., W. Zhang, C. Wu, G. M. Xiong, and Y. Duan. 2003. Breaking non-native hydrophobic clusters is the rate-limiting step in the folding of an alanine-based peptide. Biopolymers. 68:63–75. [DOI] [PubMed] [Google Scholar]
- Czerminski, R., and R. Elber. 1990a. Reaction path study of conformational transitions in flexible systems: applications to peptides. J. Chem. Phys. 92:5580–5601. [Google Scholar]
- Czerminski, R., and R. Elber. 1990b. Self-avoiding walk between 2 fixed-points as a tool to calculate reaction paths in large molecular-systems. Int. J. Quantum Chem. 24:167–186. [Google Scholar]
- Daggett, V. 2002. Molecular dynamics simulations of the protein unfolding/folding reaction. Acc. Chem. Res. 35:422–429. [DOI] [PubMed] [Google Scholar]
- Dellago, C., P. G. Bolhuis, F. S. Csajka, and D. Chandler. 1998. Transition path sampling and the calculation of rate constants. J. Chem. Phys. 108:1964–1977. [Google Scholar]
- Duan, Y., and P. A. Kollman. 1998. Pathways to a protein folding intermediate observed in a 1-microsecond simulation in aqueous solution. Science. 282:740–744. [DOI] [PubMed] [Google Scholar]
- Eastman, P., N. Gronbech-Jensen, and S. Doniach. 2001. Simulation of protein folding by reaction path annealing. J. Chem. Phys. 114:3823–3841. [Google Scholar]
- Elber, R. 1990. Calculation of the potential of mean force using molecular dynamics with linear constraints: an application to a conformational transition in a solvated dipeptide. J. Chem. Phys. 93:4312–4321. [Google Scholar]
- Elber, R. 1996. Reaction path studies of biomolecules. In Recent Developments in Theoretical Studies of Proteins. R. Elber, editor. World Scientific, Singapore. 65–136.
- Elber, R., A. Ghosh, and A. Cárdenas. 2002. Long time dynamics of complex systems. Acc. Chem. Res. 35:396–403. [DOI] [PubMed] [Google Scholar]
- Elber, R., A. Ghosh, A. Cárdenas, and H. Stern. 2003. Bridging the gap between reaction pathways, long time dynamics and calculation of rates. Adv. Chem. Phys. 126:93–129. [Google Scholar]
- Elber, R., J. Meller, and R. Olender. 1999. Stochastic path approach to compute atomically detailed trajectories: application to the folding of c peptide. J. Phys. Chem. B. 103:899–911. [Google Scholar]
- Elber, R., A. Roitberg, C. Simmerling, R. Goldstein, H. Y. Li, G. Verkhivker, C. Keasar, J. Zhang, and A. Ulitsky. 1995. MOIL: a program for simulations of macromolecules. Computer Physics Communications. 91:159–189. [Google Scholar]
- Elber, R., and D. Shalloway. 2000. Temperature-dependent reaction coordinates. J. Chem. Phys. 128:118–127. [Google Scholar]
- Garcia, A. E., and K. Y. Sanbonmatsu. 2002. Alpha-helical stabilization by side chain shielding of backbone hydrogen bonds.. Proc. Natl. Acad. Sci. USA. 99:2782–2787. [DOI] [PMC free article] [PubMed] [Google Scholar]
- Ghosh, A., R. Elber, and H. A. Scheraga. 2002. An atomically detailed study of the folding pathways of protein A with the stochastic difference equation. Proc. Natl. Acad. Sci. USA. 99:10394–10398. [DOI] [PMC free article] [PubMed] [Google Scholar]
- Gnanakaran, S., H. Nymeyer, J. Portman, K. Y. Sanbonmatsu, and A. E. Garcia. 2003. Peptide folding simulations. Curr. Opin. Struct. Biol. 13:168–174. [DOI] [PubMed] [Google Scholar]
- Hansmann, U. H. E. 2003. New algorithms and the physics of proteins. Physica A—Statistical Mechanics and Its Applications. 321:152–163. [Google Scholar]
- Hawkins, G. D., C. J. Cramer, and D. G. Truhlar. 1995. Pairwise solute screening of solute charges from a dielectric medium. Chem. Phys. Lett. 246:122–129. [Google Scholar]
- Huang, C. Y., Z. Getahun, Y. J. Zhu, J. W. Klemke, W. F. DeGrado, and F. Gai. 2002. Helix formation via conformation diffusion search. Proc. Natl. Acad. Sci. USA. 99:2788–2793. [DOI] [PMC free article] [PubMed] [Google Scholar]
- Hummer, G., A. E. Garcia, and S. Garde. 2001. Helix nucleation kinetics from molecular simulations in explicit solvent. Proteins. 42:77–84. [PubMed] [Google Scholar]
- Huo, S. H., and J. E. Straub. 1997. The MaxFlux algorithm for calculating variationally optimized reaction paths for conformational transitions in many body systems at finite temperature. J. Chem. Phys. 107:5000–5006. [Google Scholar]
- Huo, S. H., and J. E. Straub. 1999. Direct computation of long time processes in peptides and proteins: reaction path study of the coil-to-helix transition in polyalanine. Proteins. 36:249–261. [PubMed] [Google Scholar]
- Jonsson, H., G. Mills, and K. W. Jacobsen. 1998. Nudge elastic band method for finding minimum energy paths of transitions. In Classical and Quantum Dynamics in Condensed Phase Simulations. D. F. Coker, editor. World Scientific, Singapore. 385.
- Jorgensen, W. L., and J. Tirado-Rives. 1988. The OPLS potential functions for proteins: energy minimizations for crystals of cyclic-peptides and crambin. J. Am. Chem. Soc. 110:1666–1671. [DOI] [PubMed] [Google Scholar]
- Landau, L. D., and E. M. Lifshitz. 1984. Mechanics. Pergamon Press, Oxford.
- Mayor, U., N. R. Guydosh, C. M. Johnson, J. G. Grossmann, S. Sato, G. S. Jas, S. M. Freund, D. O. Alonso, V. Daggett, and A. R. Fersht. 2003. The complete folding pathway of a protein from nanoseconds to microseconds. Nature. 421:863–867. [DOI] [PubMed] [Google Scholar]
- Mitsutake, A., Y. Sugita, and Y. Okamoto. 2003. Replica-exchange multicanonical and multicanonical replica exchange Monte Carlo simulations of peptides. I. Formulation and benchmarks. J. Chem. Phys. 118:6664–6675. [Google Scholar]
- Olender, R., and R. Elber. 1996. Calculation of classical trajectories with a very large time step: formalism and numerical examples. J. Chem. Phys. 105:9299–9315. [Google Scholar]
- Olender, R., and R. Elber. 1997. Yet another look at the steepest descent path. J. Mol. Struct. 398–399:63–72. [Google Scholar]
- Pande, V. S., I. Baker, J. Chapman, S. P. Elmer, S. Khaliq, S. M. Larson, Y. M. Rhee, M. R. Shirts, C. D. Snow, E. J. Sorin, and B. Zagrovic. 2003. Atomistic protein folding simulations on the submillisecond time scale using worldwide distributed computing. Biopolymers. 68:91–109. [DOI] [PubMed] [Google Scholar]
- Passerone, D., M. Ceccarelli, and M. Parrinello. 2003. A concerted variational strategy for investigating rare events. J. Chem. Phys. 118:2025–2032. [Google Scholar]
- Press, W. H., B. P. Flannery, S. A. Teukosky, and W. T. Vetterling. 1986. Numerical Recipes. Cambridge University Press, Cambridge.
- Ryckaert, J. P., G. Ciccotti, and H. J. C. Berendsen. 1977. Numerical integration of Cartesian equations of motion of a system with constraints: molecular-dynamics of n-alkanes. Journal of Computational Physics. 23:327–341. [Google Scholar]
- Snow, C. D., N. Nguyen, V. S. Pande, and M. Gruebele. 2002. Absolute comparison of simulated and experimental-folding dynamics. Nature. 420:102–106. [DOI] [PubMed] [Google Scholar]
- Stillinger, F. H., and T. A. Weber. 1984. Packing structures and transitions in liquids and solids. Science. 225:983–989. [DOI] [PubMed] [Google Scholar]
- Straub, J. E., J. Guevara, S. H. Huo, and J. P. Lee. 2002. Long time dynamic simulations: exploring the folding pathways of an Alzheimer's amyloid β-peptide. Acc. Chem. Res. 35:473–481. [DOI] [PubMed] [Google Scholar]
- Thompson, P. A., V. Munoz, G. S. Jas, E. R. Henry, W. A. Eaton, and J. Hofrichter. 2000. The helix-coil kinetics of a heteropeptide. J. Phys. Chem. B. 104:378–389. [Google Scholar]
- Tsui, V., and D. A. Case. 2000. Theory and applications of the generalized Born solvation model in macromolecular simulations. Biopolymers. 56:275–291. [DOI] [PubMed] [Google Scholar]
- Ulitsky, A., and R. Elber. 1990. A new technique to calculate steepest descent paths in flexible polyatomic systems. J. Chem. Phys. 92:1510–1511. [Google Scholar]
- Vila, J. A., D. R. Ripoll, and H. A. Scheraga. 2000. Physical reasons for the unusual α-helix stabilization afforded by charged or neutral residues in alanine-rich peptides. Proc. Natl. Acad. Sci. USA. 97:13075–13079. [DOI] [PMC free article] [PubMed] [Google Scholar]
- Voter, A. F., F. Montalenti, and T. C. Germann. 2002. Extending the time scale in atomistic simulation of materials. Annual Review of Materials Research. 32:321–346. [Google Scholar]
- Weiner, S. J., P. A. Kollman, D. A. Case, U. C. Singh, C. Ghio, G. Alagona, S. Profeta, and P. Weiner. 1984. A new force field for molecular mechanical simulation of nucleic acids and proteins. J. Am. Chem. Soc. 106:765–784. [Google Scholar]


