

Abstract
In recent years, the implication of sphingomyelin in lipid raft formation has intensified the long sustained interest in this membrane lipid. Accumulating evidences show that cholesterol preferentially interacts with sphingomyelin, conferring specific physicochemical properties to the bilayer membrane. The molecular packing created by cholesterol and sphingomyelin, which presumably is one of the driving forces for lipid raft formation, is known in general to differ from that of cholesterol and phosphatidylcholine membranes. However, in many studies, saturated phosphatidylcholines are still considered as a model for sphingolipids. Here, we investigate the effect of cholesterol on mixtures of dioleoyl-phosphatidylcholine (DOPC) and dipalmitoyl-phosphatidylcholine (DPPC) or distearoyl-phosphatidylcholine (DSPC) and compare it to that on mixtures of DOPC and sphingomyelin analyzed in previous studies. Giant unilamellar vesicles prepared from ternary mixtures of various lipid compositions were imaged by confocal fluorescence microscopy and, within a certain range of sterol content, domain formation was observed. The assignment of distinct lipid phases and the molecular mobility in the membrane bilayer was investigated by fluorescence correlation spectroscopy. Cholesterol was shown to affect lipid dynamics in a similar way for DPPC and DSPC when the two phospholipids were combined with cholesterol in binary mixtures. However, the corresponding ternary mixtures exhibited different spatial lipid organization and dynamics. Finally, evidences of a weaker interaction of cholesterol with saturated phosphatidylcholines than with sphingomyelin (with matched chain length) are discussed.
INTRODUCTION
Lipid rafts have received much attention in the past years as they are thought to be involved in many important biological processes (Simons and Ikonen, 1997; Sankaram and Thompson, 1990; Brown and London, 1998). Since their postulation (Simons and van Meer, 1988), more than ten years ago, it appeared that in epithelial cells the main lipid raft components are sphingolipids and cholesterol. In particular, sphingomyelin (SM) is an important component of plasma membranes of eukaryotic cells (between 2 and 15% of the total lipid amount, depending on the tissue studied) (Koval and Pagano, 1989, 1991). Involved in cell signaling (for review see Simons and Toomre, 2000), SM is also considered to have a central role in various cell functions, e.g., development, apoptosis, and signal transduction (Huwiler et al., 2000; Hannun et al., 2001). These cellular functions are connected to the ability of sphingolipids to cluster as rafts, the driving force being the special interaction they would be able to engage with cholesterol (Ramstedt and Slotte, 2002). Rafts co-existing with the fluid matrix of the plasma membrane have been proposed to be in the liquid-ordered phase (lo) (Ahmed et al., 1997; Brown and London, 1998; Schroeder et al., 1998). Model membranes provide a well-defined system to characterize the physical properties of lipid components in domains. Raftlike assembly in mixed bilayers has been shown to be favored by the presence of long, saturated sphingo- or phospholipids with high phase transition temperature (Tm) as well as physiological amounts of cholesterol (Brown and London, 1998, 2000). Moreover, it has been demonstrated that, in model membranes made of ternary mixtures of a saturated sphingolipid, an unsaturated phospholipid and cholesterol, the sphingolipid-enriched domains are in the liquid-ordered phase while the glycerophospholipid-rich domains correspond to the liquid-disordered phase (Brown and London, 2000; Bagatolli and Gratton, 1999; 2000; Brown, 2001; Dietrich et al., 2001a,b).
The effects of cholesterol on the packing of sphingo- and glycerophospholipids have been the main goal of intensive research (see for review: Ohvo-Rekilä et al., 2002; McConnell and Vrljic, 2003). In particular, extensive work has been devoted for more than 20 years to the physicochemical properties of binary systems of (un)saturated phospholipids and cholesterol (Yeagle, 1985; Demel and de Kruijff, 1976; McIntosh, 1999; Needham and Nunn, 1990; Anderson and McConnell, 2001). Since saturated glycerophospholipids show similar properties as sphingolipids, the question whether saturated glycerophospholipids could intercalate with cholesterol and form rafts in the plasma membrane is a very debated one (Ohvo-Rekilä et al., 2002). Besides, if this is the case, then what is the peculiar role of sphingolipids in regulating raft formation?
Although one of the most important features of raft-assembly is the tight acyl chain packing, other chemical interactions seem to play important roles in lipid spatial distribution (Brown and London, 2000). The interfacial region of saturated glycerophospholipids significantly differ from that of SM, mainly because the amide group present in SM can act as hydrogen-bond acceptor, that feature being absent in phospholipids (Brown, 1998). These interfacial differences prevent glycerophospholipids from forming as many intra- and intermolecular hydrogen bonds as in SM (Ramstedt and Slotte, 2002). Conventional techniques, e.g., the test for detergent insolubility, have often been used in the past to reveal rafts in vitro and in vivo. However, they did not show considerable differences between sphingomyelin- and saturated glycerophospholipid (i.e., DPPC) liquid-ordered phases (Ahmed et al., 1997; Nyholm and Slotte, 2001). Recent advances in confocal optical microscopy have supported the direct visualization of raft-assembly in supported planar membranes (Dietrich et al., 2001a,b) and giant unilamellar vesicles (GUVs) (Bagatolli and Gratton, 2000; Kahya et al., 2003).
In this article, we report on the visualization by confocal fluorescence microscopy of domains in GUVs made of ternary mixtures of saturated (DPPC, DSPC), unsaturated (DOPC) phospholipids, and cholesterol. Fluorescence correlation spectroscopy (FCS) (Eigen and Rigler, 1994; Schwille, 2001) has been exploited to characterize in detail the lipid dynamics for several lipid compositions of these ternary mixtures. We discuss the role of cholesterol in tuning the lipid bilayer mobility in distinct lipid phases. Finally, by comparing this study with our recent findings for the DOPC/SM/cholesterol mixture (Kahya et al., 2003), we point out the differences regarding lipid organization and dynamics between SM and saturated glycerophospholipids in their interaction with cholesterol.
EXPERIMENTAL PROCEDURES
Materials
1,2-dioleoyl-sn-glycero-3-phosphocholine (dioleoyl-phosphatidylcholine; DOPC), 1,2-dipalmitoyl-sn-glycero-3-phosphocholine (dipalmitoyl-phosphatidylcholine; DPPC), 1,2-distearoyl-sn-glycero-3-phosphocholine (distearoyl-phosphatidylcholine; DSPC), n-stearoyl-d-erythrosphingosylphosphorylcholine (stearoyl sphingomyelin, SM); and cholesterol were purchased from Avanti Polar Lipids (Alabaster, AL). 1,1′-dioctadecyl-3,3,3′,3′-tetramethylindocarbocyanine perchlorate (DiI-C18) was from Molecular Probes (Eugene, OR). All other chemicals were of reagent grade.
Preparation of giant unilamellar vesicles (GUVs)
GUVs were prepared by electroformation (Angelova and Dimitrov, 1986; Angelova et al., 1992). With this approach, truly unilamellar vesicles are produced with sizes varying from 10 up to 100 μm. The flow chamber (closed-bath perfusion chamber, RC-21, Warner Instruments, Hamden, CT) used for vesicle preparation was equipped with two microscope slides, each coated with optically transparent and electrically conductive indium tin oxide (ITO). Lipids in chloroform/methanol 9:1 (5 mM) were deposited on preheated ITO coverslips and the solvent was evaporated in the oven at 55–60°C. After adding water into the chamber (∼300 μl), a voltage of 1,1 V at 10 Hz was applied for 1 h. After lipid swelling, the chamber was put either directly at room temperature or cooled down slowly by using a heat-block. Both cooling procedures led to the same type of vesicles and domain pattern. The experiments were also performed in the presence of a reducing agent, dithiotreitol (DTT; 2 mM, final concentration), to prevent possible lipid oxidation. This treatment did not affect domain formation and lipid mobility under our conditions of GUV formation. Whatever procedure was used, the GUVs were always prepared from fresh lipid mixtures and kept under a nitrogen atmosphere as long as possible. Lipids were checked for oxidation by UV/Vis spectroscopy and thin layer chromatography. Under the conditions of GUV preparation, it was found that <0.1% of lipids was oxidized.
DiI-C18 was added in the amount of 0.1 mol % for confocal imaging and 0.001 mol % for FCS.
Confocal fluorescence microscopy and fluorescence correlation spectroscopy (FCS)
Confocal fluorescence microscopy and FCS were performed on a commercial ConfoCor2 (Zeiss, Jena, Germany). Confocal images were taken with the laser scanning microscopy (LSM) module. The excitation light of a He-Ne laser at λ = 543 nm was reflected by a dichroic mirror (HTF 543) and focused through a Zeiss C-Apochromat 40×, NA = 1.2 water immersion objective onto the sample. The fluorescence emission was recollected by the same objective and, after passing a 560-nm longpass filter, focused into a photomultiplier. The confocal geometry was ensured by pinholes (60-μm) in front of the photomultiplier.
FCS measurements were performed by epi-illuminating the sample with the 543-nm HeNe laser (Iex ≈ 1.2 kW/cm2). The excitation light was reflected by a dichroic mirror (HTF 543) and focused onto the sample by the same objective as for the LSM. The fluorescence emission was recollected back and sent to an avalanche photodiode via a 560–615-nm bandpass filter. Out-of-plane fluorescence was reduced by a pinhole (90-μm) in front of the detector (APD). The laser focus was positioned on the topside/bottomside of GUVs, by performing an axial (z-) scan through the membrane before the FCS recording. Routine tests were carried out to search for the optimal x,y,z position of the laser focus on the membrane and rule out artifacts due to movements of the bilayer with respect to the focal spot (see e.g., Milon et al., 2003). The fluorescence temporal signal was recorded and the autocorrelation function G(τ) was calculated, according to Magde et al. (1972). The apparatus was calibrated by measuring the known three-dimensional diffusion coefficient of rhodamine in solution. The detection area on the focal plane was approximated to a Gaussian profile and had a radius of ≈0.18 μm at 1/e2 relative intensity. Data fitting was performed with the Levenberg-Marquardt nonlinear least-squares fit algorithm (ORIGIN, OriginLab, Northampton, MA). The fitting equation made use of a two-dimensional Brownian diffusion model, assuming a Gaussian beam profile:
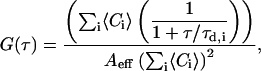 |
where 〈Ci〉 is the two-dimensional time average concentration of the species i in the detection area Aeff (∼0.1 μm2) and τd,i is the average residence time of the species i. The diffusion coefficient Di for the species i is proportional to τd,i.
In the FCS measurements, three independent GUVs preparations for every lipid composition were analyzed and, for each of them, data from at least 20 different GUVs were recorded with 100-s acquisition time per FCS measurement. When membrane phase separation was visualized with the LSM, the laser focus was always positioned onto one phase only for the FCS experiment.
RESULTS
Domain formation in GUVs made from DOPC/DPPC/cholesterol mixtures
Confocal fluorescence microscopy was used to image the lipid spatial distribution in GUVs obtained from DOPC/DPPC/cholesterol mixtures at various compositions. We exploited the ability of a fluorescent marker, DiI-C18, to partition differently in different domains, as lipids undergo phase separation. DiI-C18 has been employed in mixtures of saturated phospholipids and shown to partition preferentially with saturated, long-tailed phospholipids, e.g., dipalmitoylphosphatidylcholine-phases over coexisting fluid phases by a factor of ∼3 (Spink et al., 1990). Fig. 1 shows a collection of three-dimensional projection obtained by assembling confocal images of GUVs taken at room temperature: Fig. 1 A shows homogeneous fluorescence obtained for a GUV made of pure DOPC. One can deduce the membrane fluidity for such a composition by assessing the fast fluorescence recovery in a bleached spot. On the contrary, in Fig. 1 B, a three-dimensional projection is shown of a GUV obtained from pure DPPC. The fluorescence from DiI-C18 appeared homogeneously distributed in the plane of the membrane, which was entirely in the gel-phase, as deduced by the hampered fluorescence recovery after photobleaching of a squared spot. Fluorescence recovery did not occur within hours. GUVs made from DOPC/DPPC 0.5/0.5 (molar ratio) clearly exhibited phase separation (see Fig. 1 C), as evident from the preferential partitioning of the probe in the DPPC-enriched phase (by a factor of ∼3), as discussed in detail later. The domain pattern, consisting of an intricate network of fiberlike features, was characteristic of a gel-phase at equilibrium with a fluid-phase and strongly resembled the domain pattern imaged in GUVs with similar lipid composition (Korlach et al., 1999). By adding 10 mol % of cholesterol to the DOPC/DPPC (0.5/0.5) mixture, phase separation disappeared and the fluorescence became homogeneous (within the optical resolution). However, if 20 mol % of cholesterol was added, a domain pattern was readily visualized (see Fig. 1 D), with different properties from the one in the absence of cholesterol. Here, circular domains with diameters from 1 μm up to 20 μm indicated that phases at equilibrium are both fluid (Bagatolli and Gratton, 2000). Unilamellarity of the vesicles allowed us to look for phase interlayer coupling and it was concluded that, in all GUVs, the phase domains comprised both apposing membrane leaflets. For this lipid composition, phase assignment could be carried out by looking at the lipid dynamics characteristic of each phase by FCS, as discussed later. At cholesterol concentration of 33 mol % and higher (DOPC/DPPC 0.5/0.5 molar ratio), lipids did not show segregation and confocal imaging yielded homogeneous fluorescence on the GUV membrane in a way totally identical to Fig. 1 A.
FIGURE 1.

(A) Three-dimensional projection of a GUV (DOPC with 0.1 mol % DiI-C18) reconstructed from confocal slices (∼0.4-μm-thick) with the Zeiss software of ConfoCor2, showing a homogeneous fluorescence corresponding to a single fluid phase. (B) Topside of a GUV (DPPC with 0.1 mol % DiI-C18): after photobleaching of a spot, the fluorescence did not recover within hours, revealing the presence of a single gel-phase. (C) Visualization of phase separation (liquid-disordered and gel-phase) for the binary DPPC/DOPC mixture: the fluorescence image represents a three-dimensional projection of a GUV reconstructed from confocal slices as described in A. (D) Visualization of phase separation (liquid-disordered and gel-phase) for the ternary DOPC/DPPC (0.5/0.5 molar ratio) and cholesterol (20 mol %) mixture: the fluorescence image represents a three-dimensional projection of a GUV reconstructed from confocal slices as described in A.
Domain formation in GUVs from DOPC/DSPC/cholesterol mixtures
A series of confocal images was taken at room temperature for GUVs made of DOPC/DSPC/cholesterol mixtures at various compositions. By mixing DOPC and DSPC in equal amounts, phase separation in GUVs was readily observed because of the preferential partitioning of DiI-C18 for one phase (Fig. 2 A). The domain morphology indicated coexistence of gel-phase (DSPC) and liquid-disordered (DOPC) and the pattern appeared to be the mirror image of that for DOPC/DPPC 0.5/0.5 (compare to Fig. 1 C). The partitioning of DiI-C18 for the fluid phase (DOPC-enriched), by a factor of ∼4, was confirmed by FCS analysis of the lipid dynamics in different phases, as discussed later. As for the DOPC/DPPC/cholesterol system, upon addition of 10 mol % of cholesterol to the DOPC/DSPC (0.5/0.5 molar ratio) mixture, domains vanished (see Fig. 2 B). Similarly, extended lipid segregation took place at 20 mol % of cholesterol, as shown in Fig. 2 C, in the form of large circular domains and persisted at 33 mol % of cholesterol (Fig. 2 D). Note the difference in the partitioning behavior of the fluorescent probe DiIC18, between the mixture with 20 (∼2) and 33 mol % of cholesterol (∼1.2). At this stage, it can be concluded that the domain morphology is characteristic of a phase equilibrium between fluid phases, while the phase assignment for these mixtures will be discussed in the next sections. At cholesterol concentrations ≥ 50 mol %, domains were no longer visualized by confocal microscopy.
FIGURE 2.

(A) Visualization of phase separation (liquid-disordered and gel-phase) for the binary DSPC/DOPC (0.5/0.5 molar ratio) mixture (0.1 mol % DiI-C18): the fluorescence image represents a three-dimensional projection of a GUV reconstructed from confocal slices (∼0.4-μm-thick) with the Zeiss software of ConfoCor2. (B) three-dimensional projection of a GUV (DOPC/DSPC 0.5/0.5 molar ratio and 10 mol % of cholesterol, with 0.1 mol % DiI-C18) reconstructed from confocal slices as described in A. The homogeneous fluorescence corresponds to a single fluid phase. (C) Phase separation as visualized in GUV prepared from the ternary mixture DOPC/DSPC (0.5/0.5 molar ratio) and 20 mol % of cholesterol (0.1 mol % DiI-C18): the fluorescence image represents a three-dimensional projection of a GUV reconstructed from confocal slices as described in A. (D) Phase separation as visualized in GUV prepared from the ternary mixture DOPC/DSPC (0.5/0.5 molar ratio) and 33 mol % of cholesterol (0.1 mol % DiI-C18): the fluorescence image represents a three-dimensional projection of a GUV reconstructed from confocal slices as described in A.
Lipid dynamics in membranes made of DPPC/cholesterol and DSPC/cholesterol
Lipid dynamics in GUVs made of DPPC/cholesterol and DSPC/cholesterol was assessed by FCS. The temporal fluctuations of the fluorescence signal from DiI-C18 molecules diffusing in the plane of the GUV bilayer were autocorrelated in time, giving thus a measure of the dye mobility in a particular lipid environment.
GUVs obtained from binary DPPC/cholesterol and DSPC/cholesterol mixtures were first imaged confocally. At cholesterol concentration <30 mol %, two phases could be visualized by confocal imaging and assigned to DPPC gel-phase and DPPC/cholesterol liquid-ordered phase (Silvius et al., 1996). For all other compositions analyzed, homogeneous fluorescence distribution on the GUV surface was observed and single-phase autocorrelation curves were collected. The FCS curves for the DPPC/cholesterol system are reported in Fig. 3 A and for the DSPC/cholesterol mixtures in Fig. 3 B, as a function of cholesterol concentration. At cholesterol concentrations <30 mol %, FCS curves presented artifacts typical of dye photobleaching due to the almost immobile nature of the lipid dynamics. For this reason, the corresponding FCS measurements are not reported.
FIGURE 3.

(A) FCS autocorrelation curves are shown for DiI-C18 mobility in DPPC/cholesterol GUVs, for 33 mol % of cholesterol (solid), for 50 mol % (dashed), and for 67 mol % (dot). (B) FCS autocorrelation curves are shown for DiI-C18 mobility in DSPC/cholesterol GUVs, for 33 mol % of cholesterol (solid), for 50 mol % (dashed), and for 67 mol % (dot). (C) Average diffusion coefficients of DiI-C18 in DPPC/cholesterol (solid squares), in DSPC/cholesterol (unfilled squares), and sphingomyelin/cholesterol (triangles) GUVs, as determined from the fitting of the autocorrelation curves, are reported as a function of cholesterol concentration. Bars represent the standard deviation from the average values (see Materials and Methods for details).
Evidently, cholesterol increased the fluidity of DPPC and DSPC membranes, similarly to what was observed in SM membranes (Kahya et al., 2003). In Fig. 3 C, the diffusion coefficients of DiI-C18, as calculated from the fitting of the FCS curves, are plotted against the cholesterol concentration and compared to the diffusion coefficients obtained for the SM/cholesterol GUVs (Kahya et al., 2003). As previously reported, the opposite “condensing” effect of cholesterol was observed in DOPC membranes. In Fig. 4, the diffusion coefficient of DiI-C18 in DOPC GUVs is reported as a function of cholesterol concentration (Kahya et al., 2003).
FIGURE 4.

Average diffusion coefficients of DiI-C18 in DOPC/cholesterol GUVs, as determined from the fitting of the autocorrelation curves, are reported as a function of cholesterol concentration (Kahya et al., 2003). Bars represent the standard deviation from the average values (see Materials and Methods for details).
Lipid dynamics in GUVs made of DOPC/DPPC/cholesterol mixtures
FCS measurements following DiI-C18 fluorescence were carried out to probe membrane fluidity in GUVs made of DOPC/DPPC/cholesterol at various compositions. As GUVs provided single free-standing bilayers, when phase separation occurred, the laser focus was always positioned in one domain only.
In the absence of cholesterol, in GUVs made of DOPC/DPPC (0.5/0.5 molar ratio), phases could be assigned by FCS. Domains that appeared bright in the confocal image (compare to Fig. 1 C) exhibited very slow dynamics, typical of the gel-phase, and FCS could not be measured without artifacts due to the virtual lipid immobility. On the contrary, lipid dynamics in the dark phase was not significantly different (within the experimental error) from that in pure DOPC bilayers previously measured (Kahya et al., 2003). In Fig. 5, FCS curves collected in GUVs at various cholesterol concentrations are shown. The diffusion coefficient obtained for the dark regions in DOPC/DPPC (0.5/0.5) GUVs was 5.9 ± 0.3 × 10⁻⁸ cm2/s (Fig. 5, solid line). Upon addition of 10 mol % of cholesterol to the DOPC/DPPC (0.5/0.5) mixture, single-phases FCS curves were obtained (Fig. 5, dashed). Here, the lipid mobility was slower compared to that of the DOPC-rich phase in the absence of cholesterol (D = 3.9 ± 0.2 × 10⁻⁸ cm2/s). At 20 mol % of cholesterol, two different phases at equilibrium visualized by confocal imaging yielded different lipid mobility. Domains, from which DiI-C18 was excluded, were characterized by a very slow dynamics (Fig. 5, dashed-dot) and a diffusion coefficient of 0.44 ± 0.07 × 10⁻⁸ cm2/s. In the bright regions, lipids were almost as mobile as in pure DOPC membranes (Fig. 5, dot) and their diffusion coefficient measured 5.2 ± 0.2 × 10⁻⁸ cm2/s. From these results, we concluded that, in the absence of cholesterol, DiI-C18 partitioned in the DPPC gel-phase (by a factor of ∼3), whereas the probe was associated with the DOPC-enriched domains when cholesterol-promoted phase separation occurred (by a factor of ∼3). At higher amounts of cholesterol, phase separation vanished. At 33 mol % of cholesterol, lipid mobility was characterized by a diffusion coefficient of 2.5 ± 0.2 × 10⁻⁸ cm2/s (Fig. 5, dashed-dot-dot). At 50 mol % of cholesterol, dynamics further slowed down (D = 1.85 ± 0.13 × 10⁻⁸ cm2/s), as shown in Fig. 5 (short dash). In Fig. 7 A, the diffusion coefficients calculated from the fitting of the FCS curves are plotted against the cholesterol percentage.
FIGURE 5.

FCS autocorrelation curves are shown for DiI-C18 mobility in DOPC/DPPC/cholesterol GUVs (DOPC/DPPC 0.5 molar fraction), for 0 mol % of cholesterol (liquid-disordered phase, solid line), for 10 mol % of cholesterol (single-phase, dashed), for 20 mol % of cholesterol in the bright phase (liquid-disordered, dot), for 20 mol % of cholesterol in the dark phase (liquid-ordered, dash-dot), for the 33 mol % of cholesterol (single-phase, dash-dot-dot), and 50 mol % of cholesterol (single-phase, short dash).
FIGURE 7.

(A) Average diffusion coefficients of DiI-C18 in DOPC/DPPC/cholesterol GUVs, as determined from the fitting of the autocorrelation curves (Fig. 5), are reported as a function of cholesterol concentration (single-phase and DPPC-enriched phase, black; DOPC-enriched phase, gray). Bars represent the standard deviation from the average values (see Materials and Methods for details). (B) Average diffusion coefficients of DiI-C18 in DOPC/DSPC/cholesterol GUVs, as determined from the fitting of the autocorrelation curves (Fig. 6, A and B), are reported as a function of cholesterol concentration (single-phase and DOPC-enriched phase, black; DSPC-enriched phase, gray). Bars represent the standard deviation from the average values (see Materials and Methods for details). (C) Average diffusion coefficients of DiI-C18 in DOPC/sphingomyelin/cholesterol GUVs, as determined from the fitting of FCS curves (Kahya et al., 2003), are reported as a function of cholesterol concentration (single-phase and sphingomyelin-enriched phase, black; DOPC-enriched phase, gray). Bars represent the standard deviation from the average values (see Materials and Methods for details).
Lipid dynamics in GUVs made of DOPC/DSPC/cholesterol mixtures
We investigated lipid dynamics in DOPC/DSPC/cholesterol GUVs and compared it to the results found for DOPC/DPPC/cholesterol GUVs. In the absence of cholesterol, in DOPC/DSPC (0.5/0.5 molar ratio) GUVs, FCS measurements could be performed only in the domains with fast lipid dynamics, where the DiI-C18 preferentially partitioned (Fig. 6 A, solid line). Here, lipid lateral diffusion (D = 6.5 ± 0.4 × 10⁻⁸ cm2/s) matched that of pure DOPC, implying that this was the fluid-disordered, DOPC-enriched phase. In Fig. 6 A, FCS curves collected from bright membrane regions are shown. At least 20 mol % of cholesterol needed to be added to observe extended lipid segregation. At this point, the partitioning behavior of the fluorescent marker strikingly changed and favored the DSPC-enriched region, which was characterized by a very slow lipid dynamics, compared to the diffusion dynamics measured in the dark regions (Fig. 6 B). Furthermore, cholesterol not only promoted phase separation but also had a considerable effect on the lipid dynamics of DSPC-enriched domains. Namely, the lipid mobility in DSPC-enriched membrane regions increased from D = 0.13 ± 0.02 × 10⁻⁸ cm2/s (20 mol % of cholesterol, Fig. 6 A, dashed) up to D = 0.19 ± 0.03 × 10⁻⁸ cm2/s (33 mol % cholesterol, Fig. 6 A, dot). On the other hand, in DiIC18-depleted, DOPC-enriched domains, lipid lateral diffusion was rather fast and slightly decreased upon addition of cholesterol, shifting from D = 5.1 ± 0.4 × 10⁻⁸ cm2/s (20 mol % of cholesterol, Fig. 6 B, solid line) up to D = 4.6 ± 0.2 × 10⁻⁸ cm2/s (33 mol % of cholesterol, Fig. 6 B, dashed). At 42 mol % of cholesterol, phase separation was not detectable anymore and single-phase FCS curves yielded a diffusion coefficient of 1.7 ± 0.2 × 10⁻⁸ cm2/s (Fig. 6, A and B, dash-dot). Upon further addition of cholesterol, lipid dynamics considerably slowed down (50 mol % corresponded to D = 1.4 ± 0.1 × 10⁻⁸ cm2/s, Fig. 6, A and B, dash-dot-dot). The diffusion coefficients calculated from the fitting of the FCS data were plotted against the cholesterol concentration and reported in Fig. 7 B.
FIGURE 6.

(A) FCS autocorrelation curves are shown for DiI-C18 mobility in DOPC/DSPC/cholesterol (DOPC/DSPC 0.5 molar fraction) GUVs, for 10 mol % of cholesterol (single-phase, solid), for 20 mol % (bright, liquid-ordered phase, dashed), for 33 mol % (bright, liquid-ordered phase, dot), for 42 mol % (single-phase, dash-dot), and for 50 mol % (single-phase, dash-dot-dot). (B) FCS autocorrelation curves are shown for DiI-C18 mobility in DOPC/DSPC/cholesterol (DOPC/DSPC 0.5 molar fraction) GUVs, for 10 mol % of cholesterol (single-phase, solid), for 20 mol % (dark, liquid-disordered phase, dashed), for 33 mol % (dark, liquid-disordered phase, dot), for 42 mol % (single-phase, dash-dot), and for 50 mol % (single-phase, dash-dot-dot).
DISCUSSION
In this article, we report on a study of lipid organization and dynamics in binary and ternary mixtures of an unsaturated phospholipid (DOPC), a saturated phospholipid (DPPC, DSPC) and cholesterol. Domain formation was visualized by confocal fluorescence microscopy only for certain lipid compositions at room temperature. The main focus of this study is to gain insight into how lipids move in the membrane bilayer and the effect of cholesterol on lipid dynamics in the presence of phase coexistence.
A variety of previous studies have presented phase diagrams of binary systems combining cholesterol with saturated or unsaturated phosphatidylcholines (PCs) (Vist and Davis, 1990; Almeida et al., 1993; Hagen and McConnell, 1997; McMullen and McElhaney, 1995). One interesting feature of such data is the coexistence of a cholesterol-enriched phase (also called liquid-ordered, lo), theoretically predicted by Ipsen et al. (1987), and a cholesterol-depleted liquid-crystalline (liquid-disordered, ld) or a gel-phase, depending on the temperature, pressure, and sterol content. In particular, the phase diagram of DPPC/cholesterol shows that at room temperature two phases, lo and gel, coexist at equilibrium up to a sterol content of ∼30 mol % (Vist and Davis, 1990). By increasing the cholesterol concentration above this threshold, lipids were found to be homogeneously distributed in a liquid-ordered phase. These data are entirely consistent with our results. Homogeneous fluorescence from the lipid probe DiI-C18 was observed at all of the binary mixtures of DPPC/ or DSPC/cholesterol with sterol content ≥ 33 mol %. Differential scanning calorimetry (DSC) experiments (McMullen and McElhaney, 1996) were performed on sterol/saturated phospholipid interactions in dependence of the hydrophobic mismatch, i.e., the difference in hydrophobic length of the interacting molecules. They showed that cholesterol progressively decreased the phase transition temperature (Tm) of PC bilayers with saturated acyl chains of 18 or more carbon atoms and the hydrophobic length of cholesterol was estimated to be equivalent to that of a saturated acyl chain with 17 carbon atoms. This behavior might reflect the “fluidizing” effect of cholesterol for gel-state bilayers. Our observations of a sterol-induced increase in the lipid lateral diffusion rates in DPPC/ and DSPC/cholesterol bilayers are consistent with those studies. Moreover, both the absolute values and the trend of the diffusion coefficients as a function of sterol content for DPPC bilayers equal those for DSPC bilayers, within the experimental error. If one takes the lipid diffusion coefficient as a measure of the PC/cholesterol interaction strength, these results imply that no detectable difference in molecular interactions occurs by varying the chain length by two carbon atoms. Most importantly, the observed changes of diffusion coefficient as a function of sterol content in PC/cholesterol membranes was found to be only qualitatively but not quantitatively similar to those in SM/cholesterol bilayers (Kahya et al., 2003). In the case of SM, the lipid mobility was found always lower than that of PC with comparable saturated chain length, i.e., DPPC and DSPC. For instance, an increase in cholesterol content from 33 mol % to 50 mol % yields a three- to fivefold increase in the lipid diffusion coefficient for DPPC and DSPC bilayers and only a 1.4-fold increase for SM bilayers. This result is in agreement with a considerable amount of data, which indicate that cholesterol favors SM over other phosphatidylcholines, in bilayers and monolayers (Grönberg et al., 1991; Mattjus and Slotte, 1996; Slotte, 1999; Silvius, 2003). It has been shown that water permeability is lower in SM/cholesterol membranes than in PC/cholesterol bilayers, indicative of a more dense lateral packing density and a stronger interaction in the former system (Needham and Nunn, 1990). Furthermore, the rate of cholesterol desorption from SM bilayers is known to be much slower than desorption from membranes containing phospholipids with acyl chains of comparable length (Mattjus and Slotte, 1996; Ramstedt and Slotte, 1999). At 50 mol % cholesterol, the desorption rate was found to be ∼10-fold slower for SM (18:0) than for DSPC. Here, we report a lipid diffusion coefficient for SM/cholesterol bilayers also 10-fold slower than for DSPC/cholesterol bilayer membranes.
The molecular basis of the “fluidizing” effect of cholesterol relies on the delicate balance between lipid/cholesterol and lipid/lipid interactions. In the case of phospholipids, the largest contribution to the intermolecular interactions comes from van der Waals forces and hydrophobic forces. In the case of sphingolipids, it has been suggested that intermolecular interactions can be further strengthened by hydrogen bonds induced by the amide group at the polar-apolar interface, which can act as both hydrogen bond-donating and -accepting group (Ohvo-Rekilä et al., 2002). A strong network of hydrogen bonds is thus responsible for the higher stiffness of SM membranes with respect to PCs bilayers. The lipid/lipid interactions are disrupted when cholesterol inserts in the bilayer and, as a consequence, the mobility of the headgroup is enhanced (Yeagle et al., 1977). As the sphingolipid/cholesterol interaction is stronger than the phospholipid/cholesterol interaction, cholesterol intercalates more tightly in SM bilayers than in glycerophospholipid bilayers, producing a less pronounced “fluidizing” effect in the former system and, as a consequence, a lower lipid mobility.
Although in the PCs/cholesterol mixtures very few differences were observed in the lipid dynamic properties of the bilayers, considerable changes characterize the corresponding ternary mixtures, obtained by adding an unsaturated phospholipid with matched chain length, i.e., DOPC. When phase separation is visualized in the presence of cholesterol, the topology of the domains appears to be the same for DPPC and DSPC: circular domains with diameter ranging between 1 and 20 μm indicate the presence of fluid-phases at equilibrium. However, the region of phase coexistence for DOPC/DPPC 0.5/0.5 (only at ∼20 mol % of cholesterol) is less extended than for DOPC/DSPC 0.5/0.5 (between 20 and 33 mol % of cholesterol). Compared to the DOPC/SM/cholesterol mixture, where extensive phase separation occurs between 10 mol % and 33 mol % of cholesterol (Kahya et al., 2003), we can conclude that, for DPPC and DSPC, domain-assembly requires more cholesterol and the region phase coexistence is smaller. The partitioning behavior of the lipophilic probe DiI-C18 shows dramatic differences if DPPC is replaced by DSPC in the ternary mixtures with DOPC and cholesterol. As already previously reported (Spink et al., 1990), DiI-C18 tends to favor phospholipids with a saturated matched acyl chain over other (un)saturated phospholipid. Thus, in the case of DPPC, DiI-C18 favors the DPPC gel-phase over the DOPC fluid-phase, in the absence of cholesterol, as predicted by previous studies. On the other hand, when phase separation occurs as a result of the cholesterol addition, the dye stays preferentially in the liquid-disordered, DOPC-enriched phase. Overall, this behavior qualitatively matches that in SM/DOPC/cholesterol membranes, as shown in our previous study (Kahya et al., 2003), although in the latter case the partitioning coefficient of DiI-C18 is much higher (∼50). To the contrary, in the case of DSPC, DiI-C18 prefers the DOPC fluid-phase in the absence of cholesterol, whereas upon addition of cholesterol and domain formation, the dye slightly favors the liquid-ordered, DSPC-enriched phase. In all these cases, the partitioning behavior of the dye reflects the molecular packing in the membrane and, in particular, depends on how tightly cholesterol intercalates with the saturated phospholipid.
Along with the spatial organization of the lipids, the lipid dynamic properties are also distinctively different when replacing DPPC by DSPC in the ternary mixtures with DOPC and cholesterol. Marked changes are present within the phase separation region. For both DPPC and DSPC, cholesterol causes the largest “fluidizing” effect in the domain with lowest mobility, implying that it prefers DPPC (or DSPC) to DOPC. Cholesterol has indeed been demonstrated to interact specifically with certain phospholipid components (Silvius et al., 1996) and to partition differently between vesicles with distinct (i.e., saturated vs. unsaturated) phospholipid compositions (Lange et al., 1979; Yeagle and Young, 1986). Extensive studies on phospholipid/cholesterol interactions, in which cholesterol is shown to interact more strongly with saturated than with unsaturated PCs, support our conclusions (Brzustowicz et al., 2002; Ohvo-Rekilä et al., 2002). The same behavior of cholesterol is also observed in the ternary SM/DOPC/cholesterol system, although with a much stronger effect on the mobility within the SM-enriched phase (Kahya et al., 2003).
The comparison of the lipid dynamic properties between the DPPC- and DSPC-enriched regions in the ternary mixtures shows that a change in the PC backbone by two carbon atoms causes a large change in the lipid dynamics of these domains. This implies that an important role in regulating lipid-to-lipid interactions and, therefore, the physicochemical properties in domain-forming bilayers is also played by the presence of a third component, i.e., DOPC.
Overall, by combining information obtained from confocal imaging and FCS, we can conclude that, by replacing SM with saturated glycerophospholipids (with matched chain length) in ternary mixtures with DOPC (for molar ratios SM/DOPC, DPPC/DOPC, and DSPC/DOPC = 1) and cholesterol, domain-assembly still occurs but more cholesterol is required. Also, the molecular packing properties and the diffusion dynamics reflect weaker PC/cholesterol interactions compared to SM/cholesterol.
Finally, FCS has proven to be a valuable tool to systematically characterize molecular mobility in distinct phases, providing information not only on the molecular interactions underlying the packing density in the membrane but also on the lipid composition within one phase. In fact, even if phase separation is not immediately evident on the confocal image (see, for instance, Fig. 2 D), because of the weak contrast created by the partitioning of the lipid probe, FCS is able to provide direct evidences for the existence of domain formation. The findings presented here are of great biological interest because of their potential implications for the assembly of lipid rafts, which appear to favor sphingomyelin over saturated glycerophospholipids as a partner for cholesterol. Also, they bear potential to the understanding of the energetics underlying lipid-lipid and lipid-sterol interactions in the regulation of lipid dynamics and organization in membranes.
Acknowledgments
We thank the members of the Experimental Biophysics group, in particular Kirsten Bacia, for stimulating discussions.
Financial support from the Volkswagen Foundation is gratefully acknowledged. N.K. was the recipient of a Max Planck fellowship.
References
- Ahmed, S. N., D. A. Brown, and E. London. 1997. On the origin of sphingolipid/cholesterol-rich detergent-insoluble cell membranes: physiological concentrations of cholesterol and sphingolipid induce formation of detergent-insoluble, liquid-ordered lipid-phase in model membranes. Biochemistry. 36:10944–10953. [DOI] [PubMed] [Google Scholar]
- Almeida, P. F. F., W. L. C. Vaz, and T. E. Thompson. 1993. Percolation and diffusion in three-component lipid bilayers: effect of cholesterol on an equimolar mixture of two phosphatidylcholines. Biophys. J. 64:399–412. [DOI] [PMC free article] [PubMed] [Google Scholar]
- Anderson, T. G., and H. M. McConnell. 2001. Condensed complexes and the calorimetry of cholesterol-phospholipid bilayers. Biophys. J. 81:2774–2785. [DOI] [PMC free article] [PubMed] [Google Scholar]
- Angelova, M. I., and D. S. Dimitrov. 1986. Liposome electroformation. Faraday Discuss. Chem. Soc. 81:303–308. [Google Scholar]
- Angelova, M. I., S. Soléau, P. Méléard, J. F. Faucon, and P. Bothorel. 1992. Preparation of giant vesicles by external AC electric fields. Kinetics and applications. Progr. Coll. Polym. Sci. 89:127–131. [Google Scholar]
- Bagatolli, L. A., and E. Gratton. 1999. Two-photon fluorescence microscopy observation of shape changes at the phase transition in phospholipid giant unilamellar vesicles. Biophys. J. 77:2090–2101. [DOI] [PMC free article] [PubMed] [Google Scholar]
- Bagatolli, L. A., and E. Gratton. 2000. A correlation between lipid domain shape and binary phospholipid mixture composition in free standing bilayers: a two-photon fluorescence microscopy study. Biophys. J. 79:434–447. [DOI] [PMC free article] [PubMed] [Google Scholar]
- Brown, D. A., and E. London. 1998a. Functions of lipid rafts in biological membranes. Annu. Rev. Cell Dev. Biol. 14:111–136. [DOI] [PubMed] [Google Scholar]
- Brown, D. A., and E. London. 1998b. Structure and origin of lipid domains in biological membranes. J. Membr. Biol. 164:103–114. [DOI] [PubMed] [Google Scholar]
- Brown, D. A., and E. London. 2000. Structure and function of sphingolipid- and cholesterol-rich membrane rafts. J. Biol. Chem. 275:17221–17224. [DOI] [PubMed] [Google Scholar]
- Brown, D. A. 2001. Seeing is believing: visualization of rafts in model membranes. Proc. Natl. Acad. Sci. USA. 98:10517–10518. [DOI] [PMC free article] [PubMed] [Google Scholar]
- Brown, R. E. 1998. Sphingolipid organization in biomembranes: what physical studies of model membranes reveal. J. Cell Sci. 111:1–9. [DOI] [PMC free article] [PubMed] [Google Scholar]
- Brzustowicz, M. R., V. Cherezov, M. Caffrey, W. Stillwell, and S. R. Wassall. 2002. Molecular organization of cholesterol in polyunsaturated membranes: microdomain formation. Biophys. J. 82:285–298. [DOI] [PMC free article] [PubMed] [Google Scholar]
- Demel, R. A., and B. de Kruijff. 1976. The function of sterols in membranes. Biochim. Biophys. Acta. 457:109–132. [DOI] [PubMed] [Google Scholar]
- Dietrich, C., L. A. Bagatolli, Z. N. Volovyk, N. L. Thompson, M. Levi, K. Jacobson, and E. Gratton. 2001a. Lipid rafts reconstituted in model membranes. Biophys. J. 80:1417–1428. [DOI] [PMC free article] [PubMed] [Google Scholar]
- Dietrich, C., Z. N. Volovyk, M. Levi, N. L. Thompson, and K. Jacobson. 2001b. Partitioning of Thy-1, GM1, and cross-linked phospholipid analogs into lipid rafts reconstituted in supported model membrane monolayers. Proc. Natl. Acad. Sci. USA. 98:10642–10647. [DOI] [PMC free article] [PubMed] [Google Scholar]
- Eigen, M., and R. Rigler. 1994. Sorting single molecules. Applications to diagnostics and evolutionary biotechnology. Proc. Natl. Acad. Sci. USA. 91:5740–5747. [DOI] [PMC free article] [PubMed] [Google Scholar]
- Grönberg, M., Z.-S. Ruan, R. Bittman, and J. P. Slotte. 1991. Interaction of cholesterol with synthetic sphingomyelin derivatives in mixed monolayers. Biochemistry. 30:10746–10754. [DOI] [PubMed] [Google Scholar]
- Hagen, J. P., and H. M. McConnell. 1997. Liquid-liquid immiscibility in lipid monolayers. Biochim. Biophys. Acta. 1329:7–11. [DOI] [PubMed] [Google Scholar]
- Hannun, Y. A., C. Luberto, and K. M. Argraves. 2001. Enzymes of sphingolipid metabolism: from modular to integrative signaling. Biochemistry. 40:4893–4903. [DOI] [PubMed] [Google Scholar]
- Huwiler, A., T. Kolter, J. Pfeilshifter, and K. Sandhoff. 2000. Physiology and pathophysiology of sphingolipid metabolism and signaling. Biochim. Biophys. Acta. 1485:63–99. [DOI] [PubMed] [Google Scholar]
- Ipsen, J. H., G. Karlstrom, O. G. Mouritsen, H. Wennerstrom, and M. J. Zuckermann. 1987. Phase equilibria in the phosphatidylcholine-cholesterol system. Biochim. Biophys. Acta. 905:162–172. [DOI] [PubMed] [Google Scholar]
- Kahya, N., D. Scherfeld, K. Bacia, B. Poolman, and P. Schwille. 2003. Probing lipid mobility of raft-exhibiting model membranes by fluorescence correlation spectroscopy. J. Biol. Chem. 278:28109–28115. [DOI] [PubMed] [Google Scholar]
- Korlach, J., P. Schwille, W. W. Webb, and G. W. Feigenson. 1999. Characterization of lipid bilayer phases by confocal microscopy and fluorescence correlation spectroscopy. Proc. Natl. Acad. Sci. USA. 96:8461–8466. [DOI] [PMC free article] [PubMed] [Google Scholar]
- Koval, M., and R. E. Pagano. 1991. Intracellular transport and metabolism of sphingomyelin. Biochim. Biophys. Acta. 1082:113–125. [DOI] [PubMed] [Google Scholar]
- Koval, M., and R. E. Pagano. 1989. Lipid recycling between the plasma membrane and intracellular compartments: transport and metabolism of fluorescent sphingomyelin analogues in cultured fibroplasts. J. Cell Biol. 108:2169–2181. [DOI] [PMC free article] [PubMed] [Google Scholar]
- Lange, Y., J. S. d'Alessandro, and D. M. Small. 1979. The affinity of cholesterol for phosphatidylcholine and sphingomyelin. Biochim. Biophys. Acta. 556:338–398. [DOI] [PubMed] [Google Scholar]
- Magde, D., E. Elson, and W. W. Webb. 1972. Thermodynamic fluctuations in a reacting system. Measurement by fluorescence correlation spectroscopy. Phys. Rev. Lett. 29:705–708. [Google Scholar]
- Mattjus, P., and J. P. Slotte. 1996. Does cholesterol discriminate between sphingomyelin and phosphatidylcholine in mixed monolayers containing both phospholipids? Chem. Phys. Lipids. 81:69–80. [DOI] [PubMed] [Google Scholar]
- McConnell, H. M., and M. Vrljic. 2003. Liquid-liquid immiscibility in membranes. Annu. Rev. Biophys. Biomol. Struct. 32:469–492. [DOI] [PubMed] [Google Scholar]
- McIntosh, T. J. 1999. Current Topics in Membranes. D. W. Deamer, editor. Academic Publishers, UK. 23–47.
- McMullen, T. P. W., and R. N. McElhaney. 1995. New aspects of the interaction of cholesterol with dipalmitoylphosphatidylcholine bilayers as revealed by high-sensitivity differential scanning calorimetry. Biochim. Biophys. Acta. 1234:90–98. [DOI] [PubMed] [Google Scholar]
- McMullen, T. P. W., and R. N. McElhaney. 1996. Physical studies on cholesterol/phospholipid interactions. Curr. Op. Coll. Interf. Sci. 1:83–90. [Google Scholar]
- Milon, S., R. Hovius, H. Vogel, and T. Wohland. 2003. Factors influencing fluorescence correlation spectroscopy measurements on membranes: simulation and experiments. Chem. Phys. 288:171–186. [Google Scholar]
- Needham, D., and R. S. Nunn. 1990. Elastic deformation and failure of lipid bilayer membranes containing cholesterol. Biophys. J. 58:997–1009. [DOI] [PMC free article] [PubMed] [Google Scholar]
- Nyholm, T., and J. P. Slotte. 2001. Comparison of Triton X-100 penetration into phosphatidylcholine and sphingomyelin mono- and bilayers. Langmuir. 17:4724–4730. [Google Scholar]
- Ohvo-Rekilä, H., B. Ramstedt, P. Leppimäki, and J. P. Slotte. 2002. Cholesterol interactions with phospholipids in membranes. Progr. Lip. Res. 41:66–97. [DOI] [PubMed] [Google Scholar]
- Ramstedt, B., and J. P. Slotte. 1999. Interaction of cholesterol with sphingomyelins and acyl-chain-matched phosphatidylcholines: a comparative study of the effect of the chain length. Biophys. J. 76:908–915. [DOI] [PMC free article] [PubMed] [Google Scholar]
- Ramstedt, B., and J. P. Slotte. 2002. Membrane properties of sphingomyelins. FEBS Lett. 531:33–37. [DOI] [PubMed] [Google Scholar]
- Sankaram, M. B., and T. E. Thompson. 1990. Interaction of cholesterol with various glycerophospholipids and sphingomyelin. Biochemistry. 29:10670–10675. [DOI] [PubMed] [Google Scholar]
- Schroeder, R. J., S. N. Ahmed, Y. Zhu, E. London, and D. A. Brown. 1998. Cholesterol and sphingolipid enhance the Triton x-100 insolubility of glycosylphosphatidylinositol-anchored proteins by promoting the formation of detergent-insoluble ordered membrane domains. J. Biol. Chem. 273:1150–1157. [DOI] [PubMed] [Google Scholar]
- Schwille, P. 2001. Fluorescence correlation spectroscopy and its potential for intracellular applications. Cell Biochem. Biophys. 34:383–408. [DOI] [PubMed] [Google Scholar]
- Silvius, J. R. 2003. Role of cholesterol in lipid raft formation: lessons from lipid model systems. Biochim. Biophys. Acta. 1610:174–183. [DOI] [PubMed] [Google Scholar]
- Silvius, J. R., D. del Giudice, and M. Lafleur. 1996. Cholesterol at different bilayer concentrations can promote or antagonize lateral segregation of phospholipids of differing acyl chain length. Biochemistry. 35:15198–15208. [DOI] [PubMed] [Google Scholar]
- Simons, K., and E. Ikonen. 1997. Functional rafts in cell membranes. Nature. 387:569–572. [DOI] [PubMed] [Google Scholar]
- Simons, K., and G. van Meer. 1988. Lipid sorting in epithelial cells. Biochemistry. 27:6197–6202. [DOI] [PubMed] [Google Scholar]
- Simons, K., and D. Toomre. 2000. Lipid rafts and signal transduction. Nat. Rev. Mol. Cell Biol. 1:31–39. [DOI] [PubMed] [Google Scholar]
- Slotte, J. P. 1999. Sphingomyelin-cholesterol interactions in biological and model membranes. Partitioning behavior of indocarbocyanine probes between coexisting gel and fluid phases in model membranes. Chem. Phys. Lipids. 102:13–27. [DOI] [PubMed] [Google Scholar]
- Spink, C. H., M. D. Yeager, and G. W. Feigenson. 1990. Partitioning behavior of indocarbocyanine probes between coexisting gel and fluid phases in model membranes. Biochim. Biophys. Acta. 1023:25–33. [DOI] [PubMed] [Google Scholar]
- Vist, M. R., and J. H. Davis. 1990. Phase equilibria of cholesterol/dipalmitoyl-phosphatidylcholine mixtures: 2H nuclear magnetic resonance and differential scanning calorimetry. Biochemistry. 29:451–464. [DOI] [PubMed] [Google Scholar]
- Yeagle, P. L. 1985. Cholesterol and the cell membrane. Biochim. Biophys. Acta. 822:267–287. [DOI] [PubMed] [Google Scholar]
- Yeagle, P. L., W. C. Hutton, C. Huang, and R. B. Martin. 1977. Phospholipid-headgroup conformations; intermolecular interactions and cholesterol effects. Biochemistry. 16:4344–4349. [DOI] [PubMed] [Google Scholar]
- Yeagle, P. L., and J. E. Young. 1986. Factors contributing to the distribution of cholesterol among phospholipid vesicles. J. Biol. Chem. 261:8175–8181. [PubMed] [Google Scholar]