

Abstract
Poly(ethylene glycol) (PEG) decorated lipid bilayers are widely used in biomembrane and pharmaceutical research. The success of PEG-lipid stabilized liposomes in drug delivery is one of the key factors for the interest in these polymer/lipid systems. From a more fundamental point of view, it is essential to understand the effect of the surface grafted polymers on the physical-chemical properties of the lipid bilayer. Herein we have used cryo-transmission electron microscopy and dynamic light scattering to characterize the aggregate structure and phase behavior of mixtures of PEG-lipids and distearoylphosphatidylcholine or dipalmitoylphosphatidylcholine. The PEG-lipids contain PEG of molecular weight 2000 or 5000. We show that the transition from a dispersed lamellar phase (liposomes) to a micellar phase consisting of small spherical micelles occurs via the formation of small discoidal micelles. The onset of disk formation already takes place at low PEG-lipid concentrations (<5 mol %) and the size of the disks decreases as more PEG-lipid is added to the lipid mixture. We show that the results from cryo-transmission electron microscopy correlate well with those obtained from dynamic light scattering and that the disks are well described by an ideal disk model. Increasing the temperature, from 25°C to above the gel-to-liquid crystalline phase transition temperature for the respective lipid mixtures, has a relatively small effect on the aggregate structure.
INTRODUCTION
The development of poly(ethylene glycol) (PEG) stabilized lipid vesicles (sterically stabilized liposomes) for drug delivery (see, e.g., Čeh et al., 1997, and references therein) has triggered fundamental research on the physical chemistry of PEG-grafted lipid membranes. From both a fundamental and practical point of view, it is of interest to investigate the phase and aggregation behavior of PEG-lipid/phospholipid mixtures (Lasic et al., 1991; Kenworthy et al., 1995a; Hristova et al., 1995; Holland et al., 1996; Edwards et al., 1997; Belsito et al., 2000, 2001; Montesano et al., 2001; Johnsson and Edwards, 2001) and how the presence of the PEG-lipids affects intermembrane interactions (Kuhl et al., 1994; Kenworthy et al., 1995b; Hansen et al., 2003), permeability (Silvander et al., 1998; Nicholas et al., 2000), and adsorption of proteins (or other macromolecules) (Kaasgaard et al., 2001; Price et al., 2001; Rex et al., 2002; Bartucci et al., 2002; Allende et al., 2003). Perhaps the most important issue to be determined to optimize the PEG-lipid content in the lipid bilayer is the phase behavior of lipid/PEG-lipid mixtures. Such studies have been undertaken for a number of the most commonly used mixtures in drug delivery as noted above. However, there are still issues that are not completely settled, not least regarding the structural evolution of the aggregates as the PEG-lipid content in the mixture increases. Furthermore, PEG-lipid concentrations exceeding those needed for the onset of micelle formation have been used in recent studies without taking the micelle formation into account when interpreting the data (Nicholas et al., 2000; Allende et al., 2003). To avoid misinterpretations of data, there is a need for more information on the phase behavior and aggregate structure of these mixtures in dilute aqueous solution. This is especially so in the case of gel phase phosphatidylcholines since in this case there exist only indirect measurements of the phase behavior and aggregate structure (Belsito et al., 2000, 2001; Montesano et al., 2001; Kenworthy et al., 1995a). In contrast, several other systems have been characterized in terms of the structural evolution by means of cryo-transmission electron microscopy (cryo-TEM), giving a more direct picture of the behavior of the systems (Edwards et al., 1997; Johnsson and Edwards, 2001).
In the present study we determine the phase behavior and aggregate structure in four different systems: i), DSPC/DSPE-PEG(2000), ii), DSPC/DSPE-PEG(5000), iii), DPPC/DPPE-PEG(2000), and iv), DPPC/DPPE-PEG(5000). The PEG-lipids used, with PEG molecular weight 2000 or 5000, are the most commonly used PEG-lipids in preparations of sterically stabilized liposomes intended for drug delivery (Čeh et al., 1997). We use a powerful combination of dynamic light scattering (DLS) and cryo-TEM to elucidate the behavior of the systems and we find good agreement between the results obtained using the two techniques. In accordance with the behavior predicted from previous indirect measurements (Montesano et al., 2001; Belsito et al., 2001) we find that micelle formation sets in at an early stage in all the above systems. Furthermore, we present evidence that the transition from a dispersed lamellar phase (liposomes) to a micellar phase consisting of small spherical micelles proceeds via the formation of discoidal micelles. This result is in sharp contrast to the behavior found for mixtures of liquid crystalline egg phosphatidylcholine (EPC) and PEG-lipids where the first micellar structures to appear are cylindrical or worm-like micelles (Edwards et al., 1997). On the basis of the results from cryo-TEM and DLS, we propose a structural model for the disks. The results indicate that the disks can be viewed in a way similar to that of the so-called bicelles; that is, discoidal micelles formed in mixtures of dimyristoylphosphatidylcholine and dihexanoylphosphatidylcholine (Glover et al., 2001).
MATERIALS AND METHODS
Materials
1,2-Distearoylphosphatidylcholine (DSPC), 1,2-dipalmitoylphosphatidylcholine (DPPC), and PEG-lipids with PEG of molecular weight 2000 or 5000 covalently attached to 1,2-distearoylethanolamine or 1,2-dipalmitoylphosphatidylethanolamine (DSPE-PEG(2000), DSPE-PEG(5000), DPPE-PEG(2000), and DPPE-PEG(5000)) were purchased from Avanti Polar Lipids (Alabaster, AL). EPC was obtained from Lipid Products (Nutfield, UK). All other salts and reagents were of analytical grade and were used as received.
Sample preparation
Lipids and PEG-lipids were codissolved in chloroform and the solvent was subsequently removed under N2(g) followed by evaporation under vacuum for at least 12 h. Hepes buffer (150 mM NaCl, 20 mM Hepes, 0.01% NaN3, pH 7.4) was added to the dried lipid films and the samples were heated to 70°C in the case of the DSPC samples and to 60°C in the case of the DPPC samples (i.e., well above the gel-to-liquid crystalline phase transition temperature (Tm) for the respective systems). The samples were equilibrated at the relevant temperatures for 15–20 min, with intermittent vigorous vortex mixing, and were thereafter allowed to cool to room temperature during 15–20 min before the cycle was repeated (3–4 times). The EPC samples were freeze-thawed (N2(l) ↔ 50°C) 3–4 times with intermittent vortex mixing. The total concentration of lipid (including the PEG-lipid) was kept at 10 mM. No size-reduction step was employed in the preparation of the samples for cryo-TEM and the samples were equilibrated at 25°C for at least 24 h before inspection. Samples for DLS, prepared as described above, were diluted with Hepes buffer to 5 mM, or, in the case of the more turbid samples (with <15 mol % PEG-lipid) to 1 mM. The samples were filtered through 0.2 μm filters (the temperature was kept at 60°C or 70°C for DPPC samples and DSPC samples, respectively, during the filtration) to remove any interfering dust particles and equilibrated at the relevant temperatures for at least 24 h.
Cryo-transmission electron microscopy
Electron microscopy investigations were carried out using a Zeiss (Oberkochen, Germany) 902 A instrument operating at 80 kV. Details about the sample preparation procedure have been described previously (Almgren et al., 2000) but a brief account will be given here. A drop of the sample solution was placed on a copper EM grid coated with a perforated polymer film. A thin film (<∼0.5 μm) of the sample solution was prepared by a blotting procedure performed in a custom-built environmental chamber with controlled temperature (25°C) and humidity. A thin sample film was obtained by removing excess solution by means of a filter paper and vitrification of the film was achieved by rapidly plunging the EM grid into liquid ethane. The vitrified specimen was thereafter transferred to the microscope. The temperature was kept below 108 K during both the transfer and the viewing procedures to prevent sample perturbation.
Dynamic light scattering
The light-scattering setup consists, as previously described (Schillén et al., 1994), of a coherent (Palo Alto, CA) Ar ion laser emitting vertically polarized light at 488 nm. The detector optics include an ITT FW 130 photo multiplier (Fort Wayne, IN) and an ALV-PM-PD amplifier-discriminator (Langen, Germany) connected to an ALV-5000 autocorrelator built into a computer. The autocorrelation functions obtained from the DLS measurements were analyzed using a constrained regularization routine (Schillén et al., 1994). From the obtained relaxation rate Γ, the mean translational diffusion coefficient D may be obtained as
 |
(1) |
where q is the magnitude of the scattering vector q = (4πns/λ)sin(θ/2), with ns the refractive index of the solution, λ the wavelength of the radiation in vacuum, and θ the scattering angle. The measurements were performed at five different angles (50–130°) and D was obtained by plotting Γ versus q2 and performing linear fits according to Eq. 1. D was converted into an apparent hydrodynamic radius Rh through the Stokes-Einstein relation
 |
(2) |
where kB is the Boltzmann constant, T is the absolute temperature, and η is the viscosity of the solvent. Note that we have here neglected any concentration dependence of D. However, the samples are relatively dilute and in neat PEG-lipid systems, the concentration dependence of D was found to be weak in the relevant concentration regime (Johnsson et al., 2001). Thus, the obtained Rh values should be close to the true values at infinite dilution.
RESULTS
Aggregate structure as observed by cryo-TEM
Fig. 1 displays the structural evolution of aggregates formed in mixtures of DPPC and DPPE-PEG(2000). The dominating structures at low PEG-lipid concentration (4.5 mol %) are liposomes that appear relatively well separated but with an uneven or corrugated surface (Fig. 1 a). The almost polygonal shape of these liposomes arises because the sample was prepared for cryo-TEM at 25°C, a temperature significantly below Tm of DPPC (∼41.5°C) (Lasic, 1993; Andersson et al., 1995; Frederik et al., 1996). It is also important to emphasize that the polydispersity of the liposome preparation was very high and that unilamellar as well as multilamellar liposomes could be observed in the sample. We also found a small but significant amount of relatively small disk-like aggregates and the proportion of aggregates exhibiting disk-like shapes increased with increasing PEG-lipid concentration as shown in Fig. 1 b (9.5 mol % DPPE-PEG(2000)). The disks can be observed in all projections but are most evident in the edge-on projection. At 19.5 mol % of PEG-lipid, only a few liposomes were found and the strongly dominating structure were relatively small disks (Fig. 1 c). From Fig. 1 c it is evident that in positions where the vitrified film is relatively thin (typically in the center of the holes spanning the polymer support film on the EM-grid), the disks are mainly observed face-on. From the structures observed face-on, we conclude that the disks have a close to circular shape. In parts of the specimen where the vitrified film is slightly thicker, both face-on and edge-on projections are observed. It is also noteworthy that the disks seem to be fairly monodisperse in size. As shown in Fig. 1 d, increasing the PEG-lipid concentration even further resulted in the complete disappearance of the liposomes and a significant decrease in size of the disk-like micelles The progressive size decrease continued at higher PEG-lipid concentrations and the shape of the micelles approached spherical micelles, as shown for 49.7 and 68 mol % DPPE-PEG(2000) in Fig. 1, e and f, respectively. Thus, the structural evolution of the aggregates formed in this system with increasing PEG-lipid concentration can be summarized as: liposomes → discoidal micelles → spherical micelles. It is important to note that there is a region where liposomes and disks coexist and that a complete conversion of all liposomes into disks seems to occur at concentrations close to 20 mol % of DPPE-PEG(2000).
FIGURE 1.

Cryo-TEM images of DPPC dispersions containing DPPE-PEG(2000) in concentrations of 4.5 mol % (a), 9.5 mol % (b), 19.5 mol % (c), 30.2 mol % (d), 49.7 mol % (e), and 68 mol % (f). The arrows and arrowheads in b and c denote disks observed edge-on and face-on, respectively. Bar, 100 nm.
The results presented in Fig. 1 are actually representative of all the investigated systems; that is, very similar behavior was observed regardless of whether DPPC or DSPC was used as the lipid component or whether PEG-lipids with PEG molecular weight 2000 or 5000 were used. However, there are a few differences regarding the exact concentration of PEG-lipid needed for the complete solubilization of the liposomes into disk-like micelles. To show this, we have selected a number of representative cryo-TEM images from the respective systems. Fig. 2 a shows a micrograph obtained from a sample containing DPPC and 8.3 mol % DPPE-PEG(5000). The micrograph reveals coexistence between relatively small disks and liposomes of varying size. Increasing the concentration of DPPE-PEG(5000) led to the disappearance of the liposomes and a progressively smaller micelle size. At 34.7 mol %, relatively small micelles were the only observed structures (Fig. 2 b). Complete solubilization of the liposomes into micelles seems to occur at slightly higher concentrations of PEG(5000)-lipid (20–30 mol %) compared to that of the PEG(2000)-lipid (20 mol %).
FIGURE 2.

Cryo-TEM images of DPPC dispersions containing DPPE-PEG(5000) in concentrations of 8.3 mol % (a) and 34.7 mol % (b). The arrow and arrowhead in a denote disks observed edge-on and face-on, respectively. Bar, 100 nm.
Replacing DPPC with DSPC did not result in a significantly different behavior. Similarly to the DPPC-based systems, formation of relatively small disks was already observed at DSPE-PEG(2000) concentrations of 5 mol %. As shown in Fig. 3 a, the proportion of disks increased with PEG-lipid concentration, and at 19.8 mol % DSPE-PEG(2000), disk-like micelles were the dominating structures. Again, as a consequence of preparing the cryo-TEM specimen below the phase transition temperature, the liposomes appear more or less polygonal. Liposomes were observed in the samples up to a concentration of ∼33 mol % DSPE-PEG(2000). At higher PEG-lipid concentration only micelles were observed as shown in Fig. 3 b. A very similar behavior was observed for the DSPC system containing DSPE-PEG(5000) (Fig. 4, a–c). The only difference was that slightly more PEG(5000)-lipid was needed to convert all liposomes into micelles (35–40 mol %). It may also be noted that in comparison with the DPPC/PEG-lipid systems, more PEG-lipid is needed in the DSPC-based systems to convert all lamellar material into micelles.
FIGURE 3.

Cryo-TEM images of DSPC dispersions containing DSPE-PEG(2000) in concentrations of 19.8 mol % (a) and 34.7 mol % (b). The arrows denote disks observed edge-on and the arrowheads denote disks observed face-on. Bar, 100 nm.
FIGURE 4.

Cryo-TEM images of DSPC dispersions containing DSPE-PEG(5000) in concentrations of 7.1 mol % (a), 20.5 mol % (b), and 34.9 mol % (c). The arrows in a and b denote disks observed edge-on and the arrowhead in a denotes a disk observed face-on. Bar, 100 nm.
No disks were observed in preparations of pure DPPC or DSPC dispersions (not shown). These preparations exhibited poor colloidal stability, and precipitated material was observed within a few days of equilibration at 25°C. As expected, the colloidal stability of the liposomes was dramatically enhanced by adding relatively small amounts of PEG-lipid to the lipid mixture.
We have previously shown that when PEG-lipids are added to liquid crystalline lipid membranes, such as EPC membranes, cylindrical (or worm-like) micelles are the first micellar structures to appear (Edwards et al., 1997). To recall that result and to emphasize the dramatically different behavior, we prepared an EPC sample containing 12.1 mol % of DSPE-PEG(5000) (Fig. 5). Coexistence between liposomes and long cylindrical micelles is clearly observed, and this image provides a nice contrast to the results presented in Figs. 1–4. It also emphasizes the complexity of these systems and that subtle differences in the lipid composition may have a huge impact on the behavior of the system.
FIGURE 5.
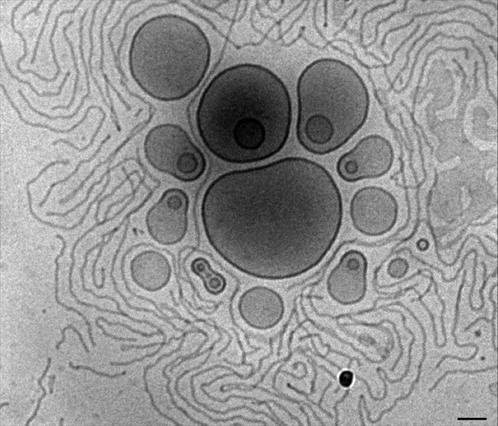
Cryo-TEM image of an EPC sample containing 12.1 mol % DSPE-PEG(5000). Bar, 100 nm.
Aggregate size as a function of PEG-lipid concentration
Cryo-TEM is a powerful technique when it comes to determining the aggregate structure in dilute dispersions of surfactants/lipids. However, because only a small fraction of the aggregates present in solution is observed in a single preparation and because there is often a size sorting in the vitrified film, there is a risk of misleading size determinations. Furthermore, although the rapid vitrification of the sample film ensures a minimum of sample perturbation, there is always a small risk of preparation-induced artifacts. On the other hand, if one combines light-scattering techniques with cryo-TEM, a more powerful tool is at hand.
Fig. 6 shows relaxation time distributions from the various systems obtained using DLS. In the DPPC/DPPE-PEG(2000) system (Fig. 6 a), a bimodal distribution was obtained at low PEG-lipid concentration (4.5 and 9.5 mol %). This is clearly consistent with the results shown in Fig. 1, provided that the fast mode corresponds to the small disks and that the slow mode corresponds to liposomes. It is important to note that since the samples were filtered before the DLS measurements, the measured mean size of the liposomes is not representative for the liposome population in the nonfiltered dispersion (many significantly larger liposomes were observed by cryo-TEM). The obtained hydrodynamic radius of slightly above 100 nm is, however, an expected result because the filters used to remove any interfering dust particles had a pore size of 0.2 μm. From Fig. 6 a, it is clear that the size of the micelles (fast mode) is decreasing with increasing PEG-lipid concentration in accordance with the cryo-TEM results. A more quantitative comparison between the results obtained from DLS and cryo-TEM will be presented in the next section. Fig. 6, b and c, show relaxation time distributions obtained from the DPPC/DPPE-PEG(5000) and DSPC/DSPE-PEG(2000) systems, respectively. A behavior similar to that of the system displayed in Fig. 6 a can be observed. Again bimodal distributions were obtained for samples where cryo-TEM suggested coexistence between micelles and liposomes.
FIGURE 6.

Relaxation time (τ = Γ−1) distributions obtained at θ = 90° of dispersions of DPPC/DPPE-PEG(2000) (a), DPPC/DPPE-PEG(5000) (b), and DSPC/DSPE-PEG(2000) (c). The sample composition is indicated on the right and the calculated mean hydrodynamic radius (Rh) is indicated next to the respective peak (units in nanometers). The temperature was 25°C.
The fact that the micelle size is decreasing with increasing PEG-lipid concentration is shown more clearly in Fig. 7. Note that this is the case also in the region where coexistence between liposomes and micelles is observed. We have also measured the hydrodynamic radius of pure DPPE-PEG micelles and obtained Rh ≈ 6 nm and Rh ≈ 9 nm for DPPE-PEG(2000) and DPPE-PEG(5000) micelles, respectively. This is slightly smaller than the corresponding radii measured for pure DSPE-PEG micelles (Johnsson et al., 2001) but still in reasonable agreement because we have here neglected the concentration dependence of the diffusion coefficient.
FIGURE 7.

Hydrodynamic radius of the fast mode (micelles) in DPPC dispersions as a function of the molar fraction of DPPE-PEG(2000) at 25°C (•), 55°C (○), and DPPE-PEG(5000) at 25°C (□).
An interesting question is whether the discoidal micelles are stable with respect to temperature. As shown in Fig. 7, no significant changes of the apparent hydrodynamic size occurred for the DPPC/DPPE-PEG(2000) samples incubated at 55°C for four days. Similar results were obtained for the corresponding DSPC-based system after equilibration at 70°C (results not shown). Note that the DLS measurements on the samples equilibrated at elevated temperatures were conducted at either 55°C (DPPC samples) or 70°C (DSPC samples); that is, no quenching of the samples below Tm was employed.
Disk model and correlation between cryo-TEM and DLS
The apparent hydrodynamic radius determined for the disks by DLS corresponds to the “equivalent sphere radius”. Therefore, to be able to more directly compare the results obtained by cryo-TEM and DLS, we have to adopt a model for the disks and convert the apparent hydrodynamic radius into a disk radius. A reasonable start would be to regard the disks as “ideal” disks, that is, perfectly circular disks with a highly curved rim. This type of model was used in early studies of the bile salt/lecithin systems (Mazer et al., 1980) and has lately been adopted to interpret the structure of the so-called bicelles (Glover et al., 2001). In Fig. 8, we show a schematic model of a cross section of the disks observed in the present study. We assume that there is a (partial) component segregation in the aggregate such that the highly curved rim is covered with PEG-lipids. The thickness of the polymer layer at the rim is denoted λPEG,edge. The total thickness of the disks is given by the thickness of the bilayer (λbil) plus twice the thickness of the polymer layer at the planar part of the disk (λPEG). The radius of the disk is denoted Rdisk and the radius of the purely lipid part of the disk is denoted Rlip (equal to Rdisk − λPEG,edge). The model proposed by Mazer et al. (1980) gives the following relation between the apparent hydrodynamic radius (Rh) and α (where α = Ldisk/2 Rdisk and Ldisk is the thickness of the disk equal to λbil + 2·λPEG):
 |
(3) |
To compare the DLS results with the cryo-TEM results, we are more interested in the value of Rlip (Fig. 8) because this is the observable quantity (together with λbil) using cryo-TEM. The reason for this is that the PEG-layers are practically invisible to the electron beam due to the poor contrast between PEG and the vitrified water matrix. This means that we have to estimate the PEG-layer thickness at the rim (λPEG,edge, Fig. 8) in addition to the estimated disk thickness. However, assuming that λPEG,edge is of similar magnitude as the PEG-layer thickness for pure spherical PEG-lipid micelles, we can use previously published values (Johnsson et al., 2001) for this parameter. In addition, assuming that the PEG-layer thickness at the flat disk regions (see Fig. 8) is similar to the layer thickness giving rise to a maximum in the osmotic pressure between PEG-grafted lipid bilayers, we can use the data published by Kenworthy et al. (1995b) to estimate Ldisk. Note that we here assume that λPEG remains constant after the onset of micelle formation. In Table 1 we have collected all the estimated parameters used in the calculation of Rlip from the corresponding Rh.
FIGURE 8.

Schematic view of the disk-like micelles (see text for more information).
TABLE 1.
Structural dimensions used for the disks in the PC/PEG-lipid systems (see Fig. 8)
| Lipid/PEG-lipid | λbil/nm | λPEG/nm | λPEG,edge/nm | Ldisk/nm |
|---|---|---|---|---|
| DPPC/DPPE-PEG(2000) | 4.4* | 6.5† | 3.5‡ | 17.4 |
| DPPC/DPPE-PEG(5000) | 4.4* | 8.5† | 7.5‡ | 21.4 |
| DSPC/DSPE-PEG(2000) | 4.7† | 6.5† | 3.5‡ | 17.7 |
| DSPC/DSPE-PEG(5000) | 4.7† | 8.5† | 7.5‡ | 21.7 |
Data from Nagle and Tristram-Nagle (2000).
Data from Kenworthy et al. (1995b).
Data from Johnsson et al. (2001).
By plotting the Rlip obtained from DLS and the calculations using Eq. 3 versus the estimated Rlip from cryo-TEM, we should be able to judge whether the model in Fig. 8 is reasonable and whether there is a reasonable correlation between DLS and cryo-TEM. Such a plot is shown in Fig. 9. Indeed, the correlation is relatively good, and considering that it is somewhat difficult to get an accurate estimate of the mean Rlip from cryo-TEM, the agreement is satisfactory. There is a larger uncertainty for the larger disks (lower PEG-lipid concentrations) because the polydispersity of the disks was found to be larger at low PEG-lipid concentration (e.g., compare Fig. 1, b and c).
FIGURE 9.

Correlation between the results obtained from DLS and model calculations and the results obtained from cryo-TEM. The fully drawn line represents the ideal correlation. Error bars represent the uncertainty in the determination of the “lipid disk radius” (Rlip) from cryo-TEM. Samples contained DPPC with 9.5 mol % (▪), 19.5 mol % (□), and 30.2 mol % (×) of DPPE-PEG(2000); and 8.3 mol % (•), 20.1 mol % (○), and 29.2 mol % (♦) of DPPE-PEG(5000); or DSPC with 32.9 mol % of DSPE-PEG(2000) (▵) and 34.9 mol % of DSPE-PEG(5000) (▴).
DISCUSSION
Liposome to micelle transition
The results presented above indicate that small amounts of PEG-lipid (<5 mol %) included in DPPC or DSPC mixtures induce the formation of disks. In this respect, it is interesting to note that Montesano et al. (2001) set the onset of micelle formation in DPPC/DPPE-PEG(2000) and DPPC/DPPE-PEG(5000) systems to 4–10 mol % and 2–4 mol %, respectively, using ESR spectroscopy. Similarly, Belsito et al. (2001) set the onset of micelle formation in the DSPC/DSPE-PEG(2000) system to ∼5 mol %. These results are in broad agreement with those presented here. However, until now, there has been no clear information on the shape or structure of the micelles. The data obtained in the present study provide clear-cut evidence that the micelles are disk-like in shape at low to moderate PEG-lipid concentration whereas they become spherical at higher PEG-lipid concentrations.
In contrast to the discoidal micelles obtained for the gel phase lipids, cylindrical micelles are formed in mixtures of EPC and PEG-lipids (Fig. 5). Clearly, the major difference between a long cylindrical micelle and the relatively small disks is the possibility of a component segregation in the case of the latter (Fig. 8). This segregation has several consequences: i), There is an obvious cost in mixing entropy when segregation occurs. ii), There is a lowering of the curvature free energy (or elastic free energy) of the PEG-layer because the higher curvature at the rim provides a larger polymer-accessible volume compared to that obtained in the flat region. iii), In the case of cylindrical micelles, the phospholipids are necessarily situated in aggregates of high curvature because both the end caps of the micelles and the cylindrical body are comparably highly curved. In contrast, the unfavorable packing of the phospholipids in parts of the micelles of high curvature is largely avoided in the case of the disks (Fig. 8). A balance of the above factors should then determine the final shape of the aggregate. It is plausible that the unfavorable packing of DPPC and DSPC in cylindrical micelles of comparably high curvature is the main reason for the formation of disks instead of cylinders in these systems.
We may also add that an additional mechanism or driving force for the partial component segregation in the case of the disks could be that the samples were cycled through Tm with the formation of defects (grain boundaries) between coexisting gel and liquid crystalline phases in the membrane close to Tm. It is possible that the PEG-lipids have a preference for these defects or boundaries and a (partial) component segregation would then follow from the preparation procedure. In this respect it would be interesting to investigate the structural behavior of mixtures of DPPC or DSPC and more conventional PEG-surfactants, such as TritonX-100, to check if the structures observed in the present study are unique for the PEG-lipids or if similar results are obtained using other surfactants.
Interestingly, the size of the micelles (disks) in the liposome-micelle coexistence region is decreasing with increasing PEG-lipid concentration (Figs. 6 and 7). This means that the composition of the micelles must change in this region. At equilibrium, the chemical potential of the components must be the same in the different aggregates and it is thus clear that the composition of the liposomes must change as well. Previous data obtained in the DPPC/PEG-lipid system have indicated a similar behavior (Montesano et al., 2001); in the study it was argued that an apparent decrease of the outer hyperfine splitting in the ESR spectra of spin-labeled lipids in the liposome-micelle coexistence region was due to changes of the particle size. The authors argue, however, that a change of the liposome composition was unlikely. The data in the present study clearly indicate otherwise; that is, the lipid composition of the liposomes (dispersed lamellar phase) is changing in the coexistence region. Further support for this finding is offered by the fact that when measuring the range and magnitude of the steric pressure between PEG-grafted lipid bilayers, a maximum in the range of the steric interaction has been observed at PEG-lipid concentrations exceeding that for the onset of micelle formation (Kenworthy et al., 1995b; Hansen et al., 2003). At first sight, this may appear rather odd because one would expect that the bilayer should be saturated with PEG-lipid when the onset of micelle formation occurs. However, if as discussed above composition changes occur even after this point, the apparent disparity between the aggregation/phase behavior data presented here and by others (Montesano et al., 2001; Belsito et al., 2001) and the osmotic pressure data (Kenworthy et al., 1995b) can be plausibly explained. Another possible reason for the apparent discrepancy may be that Kenworthy et al. (1995b) employed a higher lipid concentration (∼10 wt %) in the osmotic stress measurements compared to the present and previous studies (Montesano et al., 2001; Belsito et al., 2001).
It is possible that the above-mentioned composition changes of the liposomes after the onset of micelle formation (disks) are rather small. If this is the case, then the saturation concentration of PEG-lipid (both PEG(2000)- and PEG(5000)-lipid) should be close to 5 mol % for both DSPC and DPPC liposomes. Unfortunately, our data are not quantitative in terms of the exact saturation concentration, and more work is clearly needed to fully resolve this issue.
To the above discussion should be added that it is often difficult to ascertain that thermodynamic equilibrium is attained in dispersions of lipids and surfactants. The present lipid/PEG-lipid systems are no exceptions and we cannot be absolutely sure that the measured size of the disks is the equilibrium size. Furthermore, liposomes are rarely equilibrium aggregates but rather meta-stable structures so it is not a simple matter to determine whether the dispersed lipid/PEG-lipid system has reached equilibrium. Nevertheless, we have prepared the samples using a commonly employed procedure (Montesano et al., 2001; Kenworthy et al., 1995a,b) so the aggregate structure and the size of the small disks should certainly be representative in this respect. Therefore, the results can be used as a guide for the behavior of these systems when interpreting various experimental data obtained in gel phase PC/PEG-lipid systems.
Liposome-micelle and micelle-micelle interactions
An interesting observation in many of the cryo-TEM images (see, for example, Fig. 1, c and e, and Fig. 4 c) is the large spacing between the micelles and between the liposomes and the micelles. Typically, the separation between liposomes observed by cryo-TEM depends strongly on the interliposome interactions. With PEG-lipids included in the lipid membrane, we have previously shown that the liposomes always appear well separated in cryo-TEM images whereas nonstabilized DSPC/cholesterol liposomes often appear aggregated (Edwards et al., 1997). This is a consequence of the PEG-PEG repulsive interactions (the steric stabilization) and in the present study we can observe a similar behavior. Consider as an example the liposome appearing in Fig. 4 c from the sample containing 34.9 mol % DSPE-PEG(5000). It is clear that there is a layer around the liposome where micelles are depleted. This layer is ∼200 (±20) Å thick. From data in the literature, we know that the maximum PEG(5000)-layer thickness in DSPC/DSPE-PEG(5000) lipid membranes is ∼85 Å (Kenworthy et al., 1995b) and that the PEG(5000)-layer thickness in pure PEG(5000)-lipid spherical micelles is ∼75 Å (Johnsson et al., 2001). Taken together, we would get ∼160 Å as the liposome-(spherical) micelle distance (closest approach) if this was determined by the onset of repulsive (inter) PEG-PEG interactions. Considering that the micelles are not strictly spherical in Fig. 4 c, that the micelles are not composed of pure PEG(5000)-lipid, and the uncertainty in the estimation of the PEG-layer thickness, the agreement between estimated and measured liposome-micelle separation (160 Å vs. 200 Å) is rather good. In any case, it confirms that the repulsive PEG-PEG interactions are dominating the interaggregate interactions.
Implications for the use of lipid/PEG-lipid dispersions in biomembrane research
Finally, we will briefly discuss the implications of our results for the interpretation of the data obtained in a number of previous studies.
Nicholas et al. (2000) measured the encapsulation efficiency of DPPC-based liposomes containing varying amounts of either DPPE-PEG(2000) or DPPE-PEG(5000). They found a dramatic decrease in the encapsulation efficiency of glucose in going from 0 to 7.5 mol % of PEG-lipid. This decrease was interpreted as an excluded volume effect caused by the grafted PEG-layer. In view of the results presented in this study, the formation of disks that completely lack the ability to encapsulate hydrophilic compounds seems a more plausible explanation for the decreasing encapsulation efficiency. As shown in Fig. 1 a, the disk-like micelles are frequently observed already at 4.5 mol % of DPPE-PEG(2000) and at 9.5 mol % they dominate the sample (Fig. 1 b). Similar results were obtained for DPPE-PEG(5000) (Fig. 2 a).
In a recent study, the adsorption of amphiphilic peptides onto PEG-grafted EPC bilayers was studied (Allende et al., 2003). In this case, PEG-lipids of PEG molecular weight 2000 or 5000 covalently attached to POPE (1-palmitoyl-2-oleoyl-phosphatidylethanolamine) were used at concentrations of 15 mol %. Although the identity of the lipid anchor is different from what we have used here (DSPE-PEG), it is very likely that 15 mol % of POPE-PEG(2000) or POPE-PEG(5000) in mixtures with EPC will induce cylindrical micelle formation (Fig. 5; see also Edwards et al., 1997). The effect of micelle formation was not taken into account by Allende et al. (2003) when interpreting the obtained peptide adsorption data. Although it may be difficult to say exactly how the presence of cylindrical micelles would affect the binding of the peptides, a partitioning of the peptides between the long cylinders and the liposomes is expected.
We also believe that the results on lipid/PEG-lipid systems presented here, as well as in earlier studies (Edwards et al., 1997; Johnsson and Edwards, 2001), should have a bearing on the theoretical modeling of PEG-grafted lipid bilayers. For example, in a recent interesting article on spontaneously formed liposomes (or “equilibrium liposomes”) in lipid/PEG-lipid mixtures, the aggregate structure was assumed to go from planar bilayers via liposomes to spherical micelles as the PEG-grafting density was increased (Roivra-Bru et al., 2002). It would be interesting to explore whether the agreement between theory and experiment could be improved by including disk-like structures in the theoretical models.
CONCLUSIONS
Formation of disk-like micelles occurs at low PEG-lipid concentrations (<5 mol %) in mixtures of DPPC or DSPC with PEG-lipids. The micelles are well described by an ideal disk model where partial component segregation results in an accumulation of PEG-lipids at the highly curved rim. The size of the disks decreases with increasing PEG-lipid concentration, and at high enough PEG-lipid content spherical micelles are formed. The structural evolution of the DPPC/PEG-lipid and DSPC/PEG-lipid dispersions with increasing PEG-lipid content can be summarized as follows: liposomes → disk-like micelles → spherical micelles. In contrast, for EPC/DSPE-PEG(5000)-lipid mixtures, large cylindrical micelles are the first micellar structures to appear as the concentration of PEG-lipid is increased above the bilayer saturation concentration.
Acknowledgments
Financial support from the Swedish Cancer Foundation and the Swedish Research Council is gratefully acknowledged.
References
- Allende, D., A. Vidal, S. A. Simon, and T. J. McIntosh. 2003. Bilayer interfacial properties modulate the binding of amphipathic peptides. Chem. Phys. Lip. 122:65–76. [DOI] [PubMed] [Google Scholar]
- Almgren, M., K. Edwards, and G. Karlsson. 2000. Cryo transmission electron microscopy of liposomes and related structures. Colloids Surf. A. 174:3–21. [Google Scholar]
- Andersson, M., L. Hammarström, and K. Edwards. 1995. Effect of bilayer phase transitions on vesicle structure and its influence on the kinetics of viologen reduction. J. Phys. Chem. 99:14531–14538. [Google Scholar]
- Bartucci, R., M. Pantusa, D. Marsh, and L. Sportelli. 2002. Interaction of human serum albumin with membranes containing polymer-grafted lipids: spin-label ESR studies in the mushroom and brush regimes. Biochim. Biophys. Acta. 1564:237–242. [DOI] [PubMed] [Google Scholar]
- Belsito, S., R. Bartucci, G. Montesano, D. Marsh, and L. Sportelli. 2000. Molecular and mesoscopic properties of hydrophilic polymer-grafted phospholipids mixed with phosphatidylcholine in aqueous dispersion: interaction of dipalmitoyl N-poly(ethylene glycol)phosphatidylethanolamine with dipalmitoylphosphatidylcholine studied by spectrophotometry and spin-label electron spin resonance. Biophys. J. 78:1420–1430. [DOI] [PMC free article] [PubMed] [Google Scholar]
- Belsito, S., R. Bartucci, and L. Sportelli. 2001. Lipid chain length effect on the phase behaviour of PCs/PEG:2000-PEs mixtures. A spin label electron spin resonance and spectrophotometric study. Biophys. Chem. 93:11–22. [DOI] [PubMed] [Google Scholar]
- Čeh, B., M. Winterhalter, P. M. Frederik, J. J. Vallner, and D. D. Lasic. 1997. Stealth liposomes: from theory to product. Adv. Drug Deliv. Rev. 24:165–177. [Google Scholar]
- Edwards, K., M. Johnsson, G. Karlsson, and M. Silvander. 1997. Effect of polyethyleneglycol-phospholipids on aggregate structure in preparations of small unilamellar liposomes. Biophys. J. 73:258–266. [DOI] [PMC free article] [PubMed] [Google Scholar]
- Frederik, P. M., M. C. A. Stuart, P. H. H. Bomans, and D. D. Lasic. 1996. Cryo-electron microscopy of liposomes. In Nonmedical Applications of Liposomes, Theory and Basic Sciences. D. D. Lasic and Y. Barenholz, editors. CRC Press, Boca Raton, FL. 309–322.
- Glover, K. J., J. Whiles, G. Wu, N. Yu, R. Deems, J. O. Struppe, R. E. Stark, E. A. Komives, and R. R. Vold. 2001. Structural evaluation of phospholipid bicelles for solution-state studies of membrane-associated biomolecules. Biophys. J. 81:2163–2171. [DOI] [PMC free article] [PubMed] [Google Scholar]
- Hansen, P. L., J. A. Cohen, R. Podgornik, and V. A. Parsegian. 2003. Osmotic properties of poly(ethylene glycols): quantitative features of brush and bulk scaling laws. Biophys. J. 84:350–355. [DOI] [PMC free article] [PubMed] [Google Scholar]
- Holland, J. W., P. R. Cullis, and T. D. Madden. 1996. Poly(ethylene glycol)-lipid conjugates promote bilayer formation in mixtures of non-bilayer-forming lipids. Biochemistry. 35:2610–2617. [DOI] [PubMed] [Google Scholar]
- Hristova, K., A. Kenworthy, and T. J. McIntosh. 1995. Effect of bilayer composition on the phase behavior of liposomal suspensions containing poly(ethylene glycol)-lipids. Macromolecules. 28:7693–7699. [Google Scholar]
- Johnsson, M., and K. Edwards. 2001. Phase behavior and aggregate structure in mixtures of dioleoylphosphatidylethanolamine and poly(ethylene glycol)-lipids. Biophys. J. 80:313–323. [DOI] [PMC free article] [PubMed] [Google Scholar]
- Johnsson, M., P. Hansson, and K. Edwards. 2001. Spherical micelles and other self-assembled structures in dilute aqueous mixtures of poly(ethylene glycol) lipids. J. Phys. Chem. B. 105:8420–8430. [Google Scholar]
- Kaasgaard, T., O. G. Mouritsen, and K. Jørgensen. 2001. Screening effect of PEG on avidin binding to liposome surface receptors. Int. J. Pharm. 214:63–65. [DOI] [PubMed] [Google Scholar]
- Kenworthy, A. K., S. A. Simon, and T. J. McIntosh. 1995a. Structure and phase behavior of lipid suspensions containing phospholipids with covalently attached poly(ethylene glycol). Biophys. J. 68:1903–1920. [DOI] [PMC free article] [PubMed] [Google Scholar]
- Kenworthy, A. K., K. Hristova, D. Needham, and T. J. McIntosh. 1995b. Range and magnitude of the steric pressure between bilayers containing phospholipids with covalently attached poly(ethylene glycol). Biophys. J. 68:1921–1936. [DOI] [PMC free article] [PubMed] [Google Scholar]
- Kuhl, T. L., D. E. Leckband, D. D. Lasic, and J. N. Israelachvili. 1994. Modulation of interaction forces between bilayers exposing short-chained ethylene oxide headgroups. Biophys. J. 66:1479–1488. [DOI] [PMC free article] [PubMed] [Google Scholar]
- Lasic, D. D. 1993. Liposomes: From Physics to Applications. Elsevier Science Publishers, Amsterdam.
- Lasic, D. D., M. C. Woodle, F. J. Martin, and T. Valentincic. 1991. Phase behavior of stealth-lipid-lecithin mixtures. Period. Biol. 93:287–290. [Google Scholar]
- Mazer, N. A., G. B. Benedek, and M. C. Carey. 1980. Quasielastic light-scattering studies of aqueous biliary lipid systems. Mixed micelle formation in bile salt-lecithin solutions. Biochemistry. 19:601–615. [DOI] [PubMed] [Google Scholar]
- Montesano, G., R. Bartucci, S. Belsito, D. Marsh, and L. Sportelli. 2001. Lipid membrane expansion and micelle formation by polymer-grafted lipids: scaling with polymer length studied by spin-label electron spin resonance. Biophys. J. 80:1372–1383. [DOI] [PMC free article] [PubMed] [Google Scholar]
- Nagle, J. F., and S. Tristram-Nagle. 2000. Structure of lipid bilayers. Biochim. Biophys. Acta. 1469:159–195. [DOI] [PMC free article] [PubMed] [Google Scholar]
- Nicholas, A. R., M. J. Scott, N. I. Kennedy, and M. N. Jones. 2000. Effect of grafted polyethylene glycol (PEG) on the size, encapsulation efficiency and permeability of vesicles. Biochim. Biophys. Acta. 1463:167–178. [DOI] [PubMed] [Google Scholar]
- Price, M. E., R. M. Cornelius, and J. L. Brash. 2001. Protein adsorption to polyethylene glycol modified liposomes from fibrinogen solution and from plasma. Biochim. Biophys. Acta. 1512:191–205. [DOI] [PubMed] [Google Scholar]
- Rex, S., J. Bian, J. R. Silvius, and M. Lafleur. 2002. The presence of PEG-lipids in liposomes does not reduce melittin binding but decreases melittin-induced leakage. Biochim. Biophys. Acta. 1558:211–221. [DOI] [PubMed] [Google Scholar]
- Roivra-Bru, M., D. H. Thompson, and I. Szleifer. 2002. Size and structure of spontaneously forming liposomes in lipid/PEG-lipid mixtures. Biophys. J. 83:2419–2439. [DOI] [PMC free article] [PubMed] [Google Scholar]
- Schillén, K., W. Brown, and R. M. Johnsen. 1994. Micellar sphere-to-rod transition in an aqueous triblock copolymer solution. A dynamic light scattering study of translational and rotational diffusion. Macromolecules. 27:4825–4832. [Google Scholar]
- Silvander, M., M. Johnsson, and K. Edwards. 1998. Effects of PEG-lipids on permeability of phosphatidylcholine/cholesterol liposomes in buffer and in human serum. Chem. Phys. Lipids. 97:15–26. [DOI] [PubMed] [Google Scholar]