

Abstract
The positively charged protein transduction domain of the HIV-1 TAT protein (TAT-PTD; residues 47–57 of TAT) rapidly translocates across the plasma membrane of living cells. This property is exploited for the delivery of proteins, drugs, and genes into cells. The mechanism of this translocation is, however, not yet understood. Recent theories for translocation suggest binding of the protein transduction domain (PTD) to extracellular glycosaminoglycans as a possible mechanism. We have studied the binding equilibrium between TAT-PTD and three different glycosaminoglycans with high sensitivity isothermal titration calorimetry and provide the first quantitative thermodynamic description. The polysulfonated macromolecules were found to exhibit multiple identical binding sites for TAT-PTD with only small differences between the three species as far as the thermodynamic parameters are concerned. Heparan sulfate (HS, molecular weight, 14.2 ± 2 kDa) has 6.3 ± 1.0 independent binding sites for TAT-PTD which are characterized by a binding constant K0 = (6.0 ± 0.6) × 105 M−1 and a reaction enthalpy  kcal/mol at 28°C. The binding affinity,
  , is determined to equal extent by enthalpic and entropic contributions. The HS-TAT-PTD complex formation entails a positive heat capacity change of
 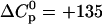 cal/mol peptide, which is characteristic of a charge neutralization reaction. This is in contrast to hydrophobic binding reactions which display a large negative heat capacity change. The stoichiometry of 6–7 TAT-PTD molecules per HS corresponds to an electric charge neutralization. Light scattering data demonstrate a maximum scattering intensity at this stoichiometric ratio, the intensity of which depends on the order of mixing of the two components. The data suggest cross-linking and/or aggregation of HS-TAT-PTD complexes. Two other glycosaminoglycans, namely heparin and chondroitin sulfate B, were also studied with isothermal titration calorimetry. The thermodynamic parameters are K0 = (6.0 ± 0.8) × 105 M−1 and
 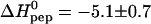 kcal/mol for heparin and K0 = (2.5 ± 0.5) × 105 M−1 and
 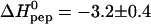 kcal/mol for chondroitin sulfate B at 28°C. The close thermodynamic similarity of the three binding molecules also implies a close structural relationship. The ubiquitous occurrence of glycosaminoglycans on the cell surface together with their tight and rapid interaction with the TAT protein transduction domain makes complex formation a strong candidate as the primary step of protein translocation.
INTRODUCTION
The human immunodeficiency virus type 1 (HIV-1) encodes 15 distinct proteins (for a review see Frankel and Young, 1998). One of them is the trans-acting activator of transcription (TAT) (Sodroski et al., 1985), a protein of 101 (in human blood) or 86 amino acids, depending on the cleavage of the C-terminus observed in some laboratory HIV strains (Rana and Jeang, 1999). The main function of this protein is to potentiate the transcription of the viral DNA insert (a proviral genome of ∼9200 nucleic acid basepairs inserted into the host cell's DNA) (Clavel et al., 1986; Howard and Rasheed, 1996; Roy et al., 1989; Salminen et al., 1995) into mRNA carried out by the host cell RNA polymerase. Without TAT, the host cell polymerase complex stops the elongation of the viral RNA soon after ∼100 nucleotides (Laspia et al., 1989). From a physical-chemical point of view, the TAT protein can be divided into six regions—namely the acidic (residues 2–11) and cysteine-rich regions (residues 22–37), the hydrophobic core (residues 38–48), the basic (residues 49–57) and the glutamine-rich regions (residues 58–72), and the RGD motif (residues 72–86) (Bayer et al., 1995; Churcher et al., 1993; Orsini et al., 1996). Essential for binding to the negatively charged mRNA is the basic region of TAT (Long and Crothers, 1995; Luo et al., 1993; Weeks et al., 1990), and this binding becomes specific for TAT activation region (TAR) when the hydrophobic core is flanking the basic region (Churcher et al., 1993). (The trans-acting TAT binds to a structure designated as TAR, which is a 59-base mRNA hairpin located at the 5′ end of the initial HIV RNA transcript, i.e., located close to the point at which the RNA transcription begins, but far away, i.e., trans, from the location of the TAT gene, at nucleotides 5365–5607. The binding of TAT to TAR induces a structural change of the TAR. This structural change enables binding of host cell kinases that phosphorylate the RNA polymerase II enzyme complex which, in turn, promotes prolongation of the transcription; see Rana and Jeang, 1999.) The cystein-rich region of TAT, in turn, is important for activation of a complex containing kinases, an elongation factor, and a polymerase, an activation which occurs even without other regions of TAT. When handling larger amounts of TAT it should be realized that TAT (residues 31–61) produced neurotoxicity in a dose-dependent manner (Mabrouk et al., 1991; Nath et al., 1996).
Small fragments of TAT, comprising the basic region of TAT, have been found to traverse biological membranes in vivo very efficiently within 5 to 10 min (Frankel and Pabo, 1988; Green and Loewenstein, 1988) by a still unknown mechanism. They may cargo at the same time covalently bound proteins through the membrane (Fawell et al., 1994), a process which has been termed protein transduction (PT) (Gius et al., 1997). Related peptides of similar structure (arginine- and lysine-rich) and similar protein transduction properties were found in Drosophila (AntP = penetratin) and herpesvirus (vp22), or were created synthetically (transportan). These peptides are also called cell-penetrating peptides (CPP) (Lindgren et al., 2000). CPPs may transport large proteins through biological membranes such as enzymes of molecular size up to 120 kDa (Schwarze et al., 1999), antibodies (Stein et al., 1999), DNA phages (Eguchi et al., 2001), 200-nm liposomes (Torchilin et al., 2001), and 40-nm iron beads (Lewin et al., 2000), provided these entities are covalently attached to the CPPs. This rapid and apparently cell-strain-independent (Mann and Frankel, 1991) transduction makes the CPPs especially interesting for intracellular drug delivery (Wadia and Dowdy, 2002; Wender et al., 2000) and rapid nonviral gene transfer (Eguchi et al., 2001).
For the TAT protein it has been found that the minimal amino acid sequence required for membrane translocation comprises residues 47–57 (H3N+-YGRKKRRQRRR-COO−; Fig.1 A) (Ho et al., 2001; Vives et al., 1997), denoted TAT protein transduction domain (TAT-PTD) in the following. The physical mechanism of how TAT, TAT-PTD, and related peptides translocate across the membrane is currently unknown. It has been observed that a d-amino acid substituted enantiomer of TAT crosses the membrane with similar efficiency as the natural l-enantiomer so that a specific receptor for TAT was excluded (Derossi et al., 1996). The translocation was not impaired when cells were treated with extracellular proteases and, furthermore, the TAT peptide could not be cross-linked to membrane proteins (Mann and Frankel, 1991). The translocation was not abolished at 4°C where cellular energy production should be significantly reduced (Derossi et al., 1996; Pooga et al., 1998); however, inhibition of the oxidative phosphorylation with sodium azide inhibited the translocation of CPPs (Mitchell et al., 2000). The transduction could be reproduced in many eukaryotic cells (Mann and Frankel, 1991), but the degree of internalization was cell-type-dependent (Mai et al., 2002; Violini et al., 2002) and was not found in yeast (Schwarze et al., 2000). The involvement of endocytosis is controversial. Whereas two studies exclude a classical endocytosis (Mitchell et al., 2000; Vives et al., 1997), two other studies suggest an adsorptive-mediated endocytosis as a possible mechanism (Huang et al., 1995; Mann and Frankel, 1991).
FIGURE 1.

Chemical structure of the compounds investigated. (A) TAT-PTD: 11-amino acid PTD of HIV-1 TAT (residues 47–57); most abundant (∼70%) disaccharide unit of (B) heparan sulfate/heparin; and (C) chondroitin sulfate B.
From a physical point of view it is unlikely that a short, highly charged peptide such as TAT-PTD (zp = +8 at physiological pH) can cross the hydrophobic lipid bilayer of a cell membrane simply by passive diffusion. Since an active uptake appears to be excluded by the in vivo studies (Derossi et al., 1996), complex formation between the cationic peptide and an anionic binding partner has been proposed as an alternative mechanism to reduce the effective electric charge of the peptide. Recent theories suggest either glycosaminoglycans such as heparan sulfate (Frankel and Pabo, 1988; Sandgren et al., 2002; Tyagi et al., 2001) or lipids (Derossi et al., 1996; Prochiantz, 2000) of the cell membrane as potential complexation agents.
In this study we have therefore characterized the thermodynamic equilibrium between TAT-PTD and three different glycosaminoglycans, i.e., heparan sulfate, heparin, and chondroitin sulfate B. Using high-sensitivity isothermal titration calorimetry (ITC) and static light scattering we investigate the thermodynamic details of the binding mechanism and report on the binding constant K0, the reaction enthalpy, ΔH0, and the number of binding sites.
MATERIALS AND METHODS
Materials
N-α-Fmoc-protected amino acids and OH-functionalized acid-labile TGA resin were purchased from Novabiochem (Laufelfingen, Switzerland). Heparan sulfate, fraction I, sodium salt (average molecular weight, 14,200; sulfate content 6.44%), was from Celsus Laboratories (Cincinnati, OH); chondroitin sulfate B, sodium salt, (from bovine mucosa, average molecular weight, 28,000; sulfate content 5.6%) was from Bio Chemika (Buchs, Switzerland). Low molecular heparin (sodium salt, porcine intestinal mucosa, average molecular weight, 6000; sulfate content 10.2%) and all other chemicals (analytical grade) were from Fluka (Buchs, Switzerland).
Synthesis and purification of TAT-PTD
The peptide employed in this study is shown in Fig. 1. It represents amino acids 47–57 of the human immunodeficiency virus type I (HIV-1) TAT protein. The peptide contains six Arg and two Lys residues and is thus highly charged (net charge zp = +8 at physiological pH). Solid phase peptide synthesis of the 11-amino acid TAT-PTD (H3N+-YGRKKRRQRRR-COO−, molecular weight, 1560.81) was performed on an Abimed EPS221 peptide synthesizer (Langenfeld, Germany) using Fmoc-protected amino acids. After synthesis, the peptide was purified by preparative high pressure liquid chromatography on a reverse phase column Lichrosorb RP-18/250-25 (Merck, Darmstadt, Germany) using a flow rate of 15 mL/min at 70 bar and a linear elution gradient from 5 to 10% acetonitrile within 1 h. The mass of the peptide was confirmed by electrospray ionization mass spectrometry (Finnigan TSQ7000; San Jose, CA). Peptide purity (>98%) was measured by analytical high pressure liquid chromatography. After purification, the peptide was suspended in water, neutralized to pH 7.40, and lyophilized. The effective peptide concentration was measured as amino acid content after acid hydrolysis.
Buffer
Solutions were prepared with buffer containing 100 mM NaCl and 10 mM TRIS at pH 7.4. The samples were filtered (0.44 μm) and degassed immediately before use (140 mbar, 8 min).
Isothermal titration calorimetry
The heat flow resulting from the binding of the TAT-PTD peptide to heparan sulfate and related compounds was measured with high-sensitivity isothermal titration calorimetry using a Microcal VP-ITC calorimeter (Microcal, Northampton, MA) with a reaction cell volume of Vcell = 1.4037 mL.
Two types of titrations were performed. In the first, the calorimeter cell contained the glycosaminoglycan solution (e.g., heparan sulfate) at a low concentration ( μM) which was titrated with Vinj = 10 μL aliquots of a concentrated TAT-PTD solution (
 μM). Each injection increased the total peptide concentration in the calorimeter cell stepwise by δc = 5.7 μM. At the same time the reaction volume was also increased and a correction factor was applied for both reactant concentrations. The heparan sulfate concentration after ni injections is
  Accordingly, the peptide concentration in the calorimeter cell is
  The heparan sulfate employed in this study has a molecular weight of 14.2 ± 2 kDa and contains ∼30 sulfated disaccharides units. For the initial steps of the injection, the heparan sulfate (measured in sulfate residues) is much in excess over the added peptide.
In the second type of experiment, the order of solutions was inverted. The calorimeter cell now contained the TAT-PTD peptide at low concentrations ( μM). The concentration of the injected glycosaminoglycan solutions varied between 140 and 500 μM for heparan sulfate, 100–200 μM for chondroitin sulfate B, and 0.8–1.2 mM for heparin. The injection volume in these titrations was Vinj = 2–10 μL. In the initial phase of these titrations the peptide was much in excess over the added glycosaminoglycan.
For each type of titration, the corresponding control titrations were also performed, i.e., the TAT-PTD solution or the glycosaminoglycan solution were injected into pure buffer. The corresponding heats of dilution were subtracted from the heats measured for the binding reaction. For the glycosaminoglycans the heat of dilution were small (from −1 to +1 μcal), for the concentrated TAT-PTD solutions the heat of dilution were constant at from −10 to −20 μcal. All solutions were degassed immediately before use (140 mbar, 8 min).
Static right-angle light scattering
Quartz cuvettes with a cell length of 1 cm and a volume of 3.5 mL were used for light-scattering experiments. The cells were filled with 2.8 mL of peptide (heparan sulfate) solution and 4 μL aliquots of a heparan sulfate (peptide) solution were added in 1-min intervals. Static light scattering at right-angle was measured with a Jasco FP 777 fluorimeter (Tokyo, Japan) at a wavelength of 350 nm under constant stirring and at a temperature of 28°C. As a control, heparan sulfate (peptide) was injected into buffer without peptide (heparan sulfate).
Circular dichroism
Circular dichroism spectra were recorded between 240 and 190 nm using a quartz cuvette of 0.2-mm length and 180-μL volume, a scanning speed of 50 nm/min, and a response time of 0.5 s. Fifty scans were averaged using a Jasco J720 spectropolarimeter at 28°C. All spectra were corrected by subtracting the buffer baseline. The TAT-PTD concentration was 60 μM for variable concentrations of heparan sulfate.
RESULTS
Interaction of TAT-PTD with heparan sulfate measured with isothermal titration calorimetry
Peptide-into-HS titration
Fig. 2 shows the titration of a heparan sulfate (HS) solution ( μM) with a concentrated TAT-PTD solution (
 μM). The calorimeter cell (Vcell = 1.4037 mL) contained the heparan sulfate and the TAT-PTD solution was injected in 10 μL aliquots every 10 min. The heat flow as a function of time is shown in Fig. 2 A. Integration of the titration peaks yields the heats of reaction, hi (Fig. 2 B). These are initially constant with hi ≈ −55 μcal and then drop sharply to a residual hi ≈ −11.5 μcal. As a control, the same TAT-PTD solution was injected into pure buffer. The heat of dilution was hdil = −11 μcal for this concentrated polyelectrolyte solution. hdil is identical to the hi observed at the end of the titration shown in Fig. 2 A and is subtracted for the evaluation of the thermodynamic parameters.
FIGURE 2.

Isothermal titration calorimetry. Titration of TAT-PTD into heparan sulfate. (A) Heat flow. The heparan sulfate concentration in the reaction cell (Vcell = 1.4037 mL) is 12 μM. The peptide concentration in the injection syringe is 791 μM. Each titration peak corresponds to the injection of 10 μL every 10 min. Buffer for both solutions is 10 mM Tris and 100 mM NaCl at pH 7.4. Temperature is 28°C. (B) Heats of reaction hi (integration of the heat flow peaks of A) as a function of the molar ratio of TAT-PTD/heparan sulfate. Unfilled diamonds represent experimental data. The solid line is a least-square fit using the binding model described by Eq. 2 with the parameters listed in Table 1.
Even without invoking a specific binding model, Fig. 2 allows two quantitative conclusions. First, for the initial injection phase, the heparan sulfate is much in excess over the added TAT-PTD. The plateau region reveals that the added TAT-PTD is bound completely to heparan sulfate. The molar heat of binding for TAT-PTD is given by  where ni,pep is the molar amount of peptide added during each injection. The evaluation of the plateau regions of three different peptide-into-HS titrations yields
 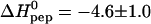 kcal/mol. Secondly, as the titration continues, the supply of free heparan sulfate becomes exhausted and the titration peaks suddenly become smaller. The midpoint of this transition is found at a TAT-PTD/HS molar ratio of rpep/HS = 6.2 ± 0.2 (n = 3). As a second quantitative conclusion it follows that heparan sulfate binds on the average r = 6.2 ± 0.2 TAT-PTD molecules. This binding ratio leads essentially to charge neutralization as will be discussed below.
The evaluation of the TAT-PTD/HS molar ratio rpep/HS was based on a molecular weight of 14.2 kDa for HS. Whereas the peptide concentration was determined with amino acid analysis, the HS concentration was calculated with a nominal molecular weight of 14.2 kD. HS is, however, not homogeneous and the supplier specifies a molecular weight of 14.2 ± 2 kDa. As the molecular weight is uncertain by ∼15%, the error in rpep/HS is increased by the same percentage. We therefore present a second analysis which avoids the problem of polydispersity. The sulfur content of the HS employed in the present studies was determined as 6.44 wt %. The HS concentration of 12.0 μM can thus be replaced by a sulfate concentration of 342.9 μM which is independent of the chain length heterogeneity of HS. The molar sulfate/peptide ratio at half-height of the transition curve (Fig. 2 B) is 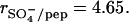 The HS chain also contains ∼1 carboxylate group per sulfate group whereas the peptide carries a formal charge of zp = +8. The ratio of negative HS charges (
 ) to positive peptide charges at the midpoint of the titration curve is 2 × 4.65/8 = 1.16. The midpoint of the transition is thus close to the point of electric charge neutralization. It further follows that the number of sulfate groups per HS molecule is rpep/HS
  The error of 15% is again determined by the uncertainty in the molecular weight of heparan sulfate.
The quantitative results discussed above suggest that heparan sulfate has n independent and equal binding sites for TAT-PTD. It is then straightforward to describe the whole binding isotherm by a simple model. If [M]total is the total concentration of the macromolecule (e.g., heparan sulfate), Lbound is the concentration of bound ligand (TAT-PTD peptide), and [L] is the concentration of free ligand, then the equilibrium can be described by
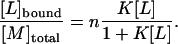 |
(1) |
Even though Eq. 1 appears to be trivial, its derivation involves a statistical averaging over all possible occupation numbers (van Holde et al., 1998). The concentration of bound ligand is given by
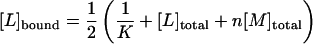 |
 |
(2) |
To connect Eq. 2 with the experimentally accessible heats of reaction, hi, we denote with S an individual peptide binding site. The total concentration of binding sites is [S]total = n[M]total =  The fraction of occupied binding sites after i peptide injections is ΘS,b = [Sb]/[S]total and can be determined from the titration experiment according to
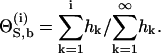 |
(3) |
The concentration of bound peptide, [L]bound, is identical to the concentration of occupied binding sites,
 |
(4) |
[L]bound can thus be determined directly from the titration experiment (Seelig, 1997; Wiseman et al., 1989). It is then possible to evaluate n,  and K0 according to Eq. 2 by a three-parameter least-square fit. The solid line in Fig. 2 is the calculated binding isotherm. The reaction enthalpy at 28°C is
  kcal per mol of TAT-PTD and the binding constant is K0 = (5.7 ± 2) × 105 M−1 (average of three titrations). The number of peptides bound per molecule heparan sulfate, averaged over all measurements, is n = 6.3 ± 0.4 (cf. Table 1). The error is the standard deviation of the thermodynamic titration. Taking into account also the uncertainty in the molecular weight (15%) the error is increased to n ≈ 6.3 ± 1.3. This is in agreement with the direct evaluation given above. In contrast, evaluation of
  and K0 is not affected by the polydispersity of heparan sulfate.
TABLE 1.
Thermodynamic parameters for binding of HIV-1 TAT-PTD to different glycosaminoglycans
| Temp (°C) | Number of binding sites* | K0 (M−1) |
 (kcal/mol peptide) (kcal/mol peptide) |
 (kcal/mol peptide) (kcal/mol peptide) |
TΔS0 (kcal/mol peptide) | Number of measurements† |
|---|---|---|---|---|---|---|
| Heparan sulfate (MW 14.2 ± 2 kDa) | ||||||
| 18 | 6.5 | 8.0 × 10⁵ | −5.6 | −7.8 | 2.2 | 1 |
| 28 | 7.0 ± 0.3 | (6.0 ± 0.6) × 105 | −4.5 ± 0.6 | −7.9 ± 0.1 | 3.4 ± 0.6 | 6‡ |
| 28 | 6.3 ± 0.4 | (5.7 ± 2) × 105 | −4.6 ± 1.0 | −7.9 ± 0.3 | 3.3 ± 1 | 3§ |
| 38 | 7.1 | 5.0 × 10⁵ | −2.9 | −8.1 | 5.2 | 1 |
| Chondroitin sulfate B (MW 28 kDa) | ||||||
| 28 | 14.8 ± 1.5 | (2.5 ± 0.5) × 105 | −3.2 ± 0.4 | −7.4 ± 0.2 | 4.2 ± 0.5 | 6 |
| Heparin (MW 6 ± 1 kDa) | ||||||
| 28 | 4.2 ± 0.4 | (6.0 ± 0.8) × 105 | −5.1 ± 0.7 | −7.9 ± 0.1 | 2.7 ± 0.7 | 7 |
Mean ± SD of the calorimetric measurement. If the dispersion of the molecular weight is included, the total error is ∼20%.
At different peptide and glycosaminoglycan concentrations.
HS-into-TAT-PTD titration.
TAT-PTD-into-HS titration.
HS-into-peptide titration
Next, Fig. 3 shows the inverse HS-into-peptide titration with the peptide (78 μM) in the calorimeter cell and the heparan sulfate solution (500 μM) added in 2-μL aliquots every 5 min. The binding reaction is again very fast and finished within the response time of the instrument. As in the peptide-into-HS titration discussed above, the heats of reaction are initially exothermic, and drop to zero. However, in contrast to the previous measurement, the hi values become slightly endothermic before approaching the zero line again. The cumulative heat of the exothermic reaction is ∼−440 μcal and that of the endothermic reaction ∼+30 μcal, i.e., <7% of the exothermic process. If the titration is performed with more dilute peptide and heparan sulfate solutions, the endothermic reaction can no longer be observed. We will show below, with light scattering, that addition of heparan sulfate to an excess of TAT-PTD probably leads to a cross-linking of several HS molecules via TAT-PTD.
FIGURE 3.

Isothermal titration calorimetry. Titration of heparan sulfate into TAT-PTD. (A) Heat flow. The peptide concentration in the reaction cell is 78 μM. Each peak corresponds to the injection of 2 μL (every 5 min) of heparan sulfate at a concentration of 500 μM. Buffer is 10 mM Tris and 100 mM NaCl at pH 7.4. Temperature is 28°C. (B) Heats of reaction hi (integrated from the heat flow in A) as a function of the molar ratio of heparan sulfate/TAT-PTD. Unfilled diamonds represent experimental data. The solid line is the least-square fit to these data using the binding model described by Eq. 2 with the parameters listed in Table 1.
Fig. 3 reveals an almost constant heat of reaction of 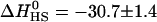 kcal/mol for the first few injections of heparan sulfate. This is only possible if all added heparan sulfate is completely bound to peptide. Since the binding of a single peptide yields −4.7 kcal/mol, the peptide/HS stoichiometry of binding is found to be npep/HS = −30.8/−4.7 = 6.6 which is in excellent agreement with the peptide-into-HS titration described above.
We have evaluated the exothermic stage of the HS-into-peptide titration again according to Eq. 2 and have determined n, K, and  by a least-square fit. We observed no significant difference between those titrations which showed exclusively an exothermic phase and those which also displayed a small endothermic phase. The average
  = −4.5 ± 0.6 kcal/mol (n = 6), measured with different concentrations of TAT-PTD and HS, is in excellent agreement with the reaction enthalpy obtained in the peptide-into-HS titration described before. The data are summarized in Table 1.
We have used ITC to also study the binding of TAT-PTD to another glucosaminoglycan, heparin, and to a galactosaminoglycan, chondroitin sulfate B. The ITC titration patterns were virtually identical to those observed for heparan sulfate. Likewise, the binding isotherms could again be described by the multisite binding model of Eq. 1, and the resulting parameters are included in Table 1. The binding constant, K0, and the reaction enthalpy,  of a single site are similar to the results obtained for heparan sulfate. Indeed, the only major difference found between the three glycosaminoglycans is the number of binding sites for TAT-PTD which is n ∼ 6.5 for heparan sulfate, ∼4.2 for heparin, and ∼14.8 for chondroitin sulfate B. Since the three species have a different molecular weight, a more meaningful comparison is the binding capacity per 1 kDa which is ∼0.46 for heparan sulfate, ∼0.53 for chondroitin sulfate B, and ∼0.69 for heparin. Hence heparin has a 30–50% higher binding capacity for TAT-PTD than heparan sulfate which may be traced back to its higher extent of sulfatation (cf. below).
Light-scattering and circular dichroism
TAT-PTD has a small intrinsic fluorescence due to its single tyrosine residue. When TAT-PTD was titrated into pure buffer, a small linear increase in the fluorescence was observed, as shown in Fig. 4 A. Next TAT-PTD (393 μM) was titrated into heparan sulfate (6 μM). Fig. 4 A displays the difference spectrum after subtraction of pure TAT-PTD. After an initially flat baseline during the first few injections, the difference spectrum shows a weak scattering intensity with a maximum at a peptide/HS molar ratio of npep/HS = 6.4.
FIGURE 4.

Static right-angle light scattering. (A) Titration of TAT-PTD into heparan sulfate (HS). The HS concentration in the optical cuvette (Vcell = 2.8 mL) is 6 μM. Each peak corresponds to the injection of 20 μL (every minute) of TAT-PTD at a concentration of 393 μM. (⋄) TAT-PTD into pure buffer. (♦)TAT-PTD injected into the HS solution (difference spectrum after baseline correction with TAT-PTD-into-buffer injection). (B) Titration of heparan sulfate into TAT-PTD. The TAT-PTD concentration in the optical cuvette is 26 μM (2.8074 mL). (♦) Each peak corresponds to the injection of 4 μL (every minute) of heparan sulfate at a concentration of 167 μM. (⋄) Heparan sulfate is injected into buffer without peptide. Buffer in all experiments is 10 mM Tris and 100 mM NaCl. Temperature is 28°C.
A much more dramatic effect is observed for the inverse HS-into-TAT-PTD titration (Fig. 4 B). HS itself is nonfluorescent, leading to a flat baseline when HS is titrated into buffer only. Next HS (160 μM) was titrated into TAT-PTD (30 μM), both in the same buffer (10 mM Tris and 100 mM NaCl, at pH 7.4, 28°C). The fluorescence scattering was much more pronounced (see below) and the scattering curve showed a maximum at nHS/pep = 0.16 ± 0.02 (n = 4) which corresponds to a peptide/HS ratio of npep/HS = 6.3.
Despite the fact that the maximum of the two scattering curves is characterized by almost the same npep/HS value (which also agrees with the stoichiometry determined from ITC) the peptide-into-HS titration produces a much higher turbidity than the inverse titration. Indeed, when comparing Fig. 4 A with Fig. 4 B it should be realized that the photomultiplier was in the high sensitivity detection mode in Fig. 4 A but in low sensitivity in Fig. 4 B. Thus the scattering intensity is ∼1000-fold less in Fig. 4 A compared to Fig. 4 B. This is also obvious when inspecting the two solutions by eye. At the scattering maximum the solution corresponding to Fig. 4 A is only weakly opalescent. In contrast, solution of Fig. 4 B is milky turbid.
We explain these different results for the two titrations by two structurally different, but thermodynamically almost identical complexes. In the peptide-into-HS titration, HS is much in excess over the added peptide. During the initial stage of the titration individual TAT-PTD molecules are mainly bound to one and only one HS molecule. In the inverse titration, TAT-PTD is in excess over HS. The addition of HS could lead to a cross-linking of several HS molecules via TAT-PTD. At the scattering maximum, cross-linking is observed for both titrations but the complexes are distinctly larger for the HS-into-peptide titration than in the inverse case. In addition, aggregation of neutral complexes could also contribute to the scattering curves. It should also be noted that upon further addition of either reactant beyond the stoichiometric maximum, the complexes/aggregates are brought back into solution.
Circular dichroism spectroscopy reveals a random coil structure for TAT-PTD in buffer. Addition of heparan sulfate produced no conformational change at all molar ratios tested (spectra not shown). However, the signal amplitude decreased with increasing heparan sulfate concentration as a consequence of aggregation and light scattering.
DISCUSSION
Cell-penetrating peptides are polybasic in nature and appear to penetrate the plasma membrane via a temperature-independent, nonendocytotic pathway. Recent reports demonstrate an intriguing role for heparan sulfate proteoglycans as a plasma membrane carrier and cellular entry mechanism (for a review see Belting, 2003). Here we address the question of the thermodynamic forces governing such an interaction.
TAT-PTD-heparan sulfate binding equilibrium
This study is the first thermodynamic characterization of the interaction of a TAT-PTD peptide with heparan sulfate. Heparan sulfate is extracellular in distribution and has been identified in many different tissues. It is localized in the basement membrane and on the cell surface and typical concentrations of heparan sulfate proteoglycans are in the range of 105–106 molecules/cell as measured in various cell culture systems. The interaction of TAT and TAT-derived basic peptides with the ubiquitous heparan sulfate is thus of general biological relevance (Sandgren et al., 2002). Earlier TAT binding studies have used mainly heparin, a compound found in intracellular granules of mast cells, which is more easily available. Heparan sulfate and heparin have the same basic structure consisting of repeating disaccharides IdoA/GlcUA and GlcNAc (Fig. 1). A distinction between the two molecules can be made via the extent of sulfatation that is approximately two sulfate residues per disaccharide unit in heparin compared to approximately one sulfate in heparan sulfate (Rusnati et al., 1997). However, heparin is an intracellular component predominantly localized in mast cells and is thus not immediately accessible to TAT.
Isothermal titration calorimetry shows that the TAT-PTD peptide binds rapidly and tightly to heparan sulfate, heparin, and chondroitin sulfate B with similar intrinsic binding constants in the range of K0 = 3 × 10⁵ M−1 to 6 × 10⁵ M−1 at 28°C. The measurements also demonstrate that the three glycosaminoglycans have multiple independent binding sites for TAT-PTD. The thermodynamic parameters of the binding sites are very similar and it can be concluded that the TAT-PTD recognition sites on the three glycosaminoglycans must have similar structure and charge. In contrast, the binding capacity, i.e., the number of binding sites per unit molecular weight, varies for the three molecules and increases in the order of heparan sulfate (0.46 binding sites per 1 kDa), chondroitin sulfate B (0.53), and heparin (0.69), and follows roughly the extent of sulfatation.
The implication of these binding parameters for biological processes requires further investigations. For the inhibition of TAT transduction, chondroitin sulfate B could not compete with heparin (Rusnati et al., 1997) whereas for the inhibition of TAT transactivation, chondroitin sulfate B was as effective as heparin (Tyagi et al., 2001). For the glycosaminoglycan-binding protein IGFBP, heparin and chondroitin sulfate B had similar binding affinities, but the binding affinity decreased in the order of chondroitin sulfate B > chondroitin sulfate A > chondroitin sulfate C (Fowlkes and Serra, 1996).
The calorimetric titration experiment provides the reaction enthalpy, ΔH0, and the binding constant, K0, of the elementary binding step. Fig. 5 displays the temperature dependence of the two parameters for heparan sulfate. The binding reaction is exothermic at all temperatures studied and the reaction enthalpy is the major driving force for the reaction at low temperatures.  becomes less negative with increasing temperature. The slope of the straight line in Fig. 5 A yields the molar heat capacity which is large and positive with
  cal/mol K (referred to TAT-PTD). This result is in contrast to hydrophobic reactions where
  is negative; however, it is in agreement with the characteristic signature of ionization/charge neutralization reactions. Ionization reactions have substantial negative values of ΔS0 and
  . The values of ΔS0 ∼ −20 cal/mol K and
  cal/mol K are typical of a dissociation to singly charged ions in aqueous solution at room temperature (Lewis et al., 1961). Conversely, charge neutralization is accompanied by a positive
  and may proceed even if ΔH0 is substantially endothermic because of the positive ΔS0. Inspection of Table 1 indeed demonstrates that the interaction of the TAT-peptide with heparan sulfate is accompanied by considerable increase in entropy; at high temperatures (>38°C) the TΔS0-term even exceeds the absolute value of the ΔH0-term. As a general conclusion it follows that the binding of TAT-PTD to heparan sulfate is dominated by electrostatic interactions.
FIGURE 5.

Temperature dependence of the reaction enthalpy, ΔH0, and the binding constant, K0, for TAT-PTD binding to heparan sulfate. (A)  versus temperature. (B) K0 versus temperature. (⋄) Experimental values. Solid line in A, linear regression analysis yielding
  (kcal/mol) = 0.135 T(C°) − 8.108. Solid line in B, predicted temperature dependence of K0 using the above regression formula for ΔH0(T).
The binding constant K0 decreases with increasing temperature as anticipated for an exothermic reaction (Fig. 5 B). The solid line in Fig. 5 B represents the predicted temperature dependence of K0 calculated with the temperature-dependent ΔH0 taken from Fig. 5 A.
For a macromolecule with n independent binding sites the measurable binding constants of the individual binding steps vary with the degree of saturation for statistical reasons according to (Tanford, 1961; van Holde et al., 1998)
 |
(5) |
The first peptide binds with the binding constant K1 = nK0, the last with Kn = K0/n. For heparan sulfate with n = 7 binding sites for TAT-PTD, the ratio K1/Kn = n2 is 49. Hence the initial binding step has an ∼50× larger binding constant than that measured near the saturation limit. This large difference between the initial binding and the binding near the saturation limit could eventually be misinterpreted in terms of two types of binding sites with high and low affinity, respectively. Under in vivo conditions, HS is probably much in excess over TAT-PTD and the initial binding constant K1 = 7 K0 ≈ 4.2 × 10⁶ M−1 applies.
Thermodynamics provides only limited insight into the molecular details of the complexes formed. The light-scattering data reveal two different structures depending on how the equivalence point of the titration is reached. If HS is initially in excess, the few TAT-PTDs are distributed among the many HS molecules and the solution remains optically clear. The HS molecules are not saturated with TAT-PTD. On the other hand, if TAT-PTD is in excess over HS, even the first addition of HS generates some turbidity which increases linearly with the amount of added HS. The HS molecules are immediately saturated with TAT-PTD even on the first injection of HS. We suggest that both cross-linking and aggregation contribute to the observed turbidity. Both processes are, however, not accompanied by significant heat changes as anticipated for amorphous precipitates or colloidal suspensions.
Comparison with related binding studies
To the best of our knowledge, no other quantitative data on the heparan sulfate-TAT (or TAT-PTD) equilibrium are available to date. Earlier studies have focused essentially on heparin as a ligand since it is more easily available. It was demonstrated that heparin binds specifically to recombinant HIV-1 TAT produced as glutathione S-transferase (GST) fusion protein and immobilized on glutathione-agarose beads (Rusnati et al., 1998). However, replacing the six arginins in the TAT domain (residues 49–57) by alanins reduced the binding constant only by a factor 3. This would argue against a strong electrostatic contribution (Rusnati et al., 1998). Using heparins of different chain length it was further found that the GST-TAT:heparin stoichiometry is between 6:1 and 3:1 when the heparin concentration is low and the chain length is 22 monomer units or more. For short chains and high heparin concentrations a 1:1 stoichiometry was observed. In addition, a low and a high affinity binding site were postulated based on Scatchard plots (Rusnati et al., 1999). These data partially agree with our results but cannot be made completely consistent. For a critical evaluation of the discrepancies it should be realized that ITC is a simple and straightforward physical-chemical experiment which is finished in 60–90 min and delivers the whole binding isotherm in a single experiment. In addition our experiments were performed with the short TAT-PTD peptide comprising just 11 amino acids. In contrast, the glutathione-agarose assay is a lengthy biochemical procedure where the TAT peptide is immobilized and the entire peptide (86 residues) is coupled to a larger protein.
Biological consequences of complex formation with heparan sulfate
Heparan sulfate at the cell surface is not freely diffusible but is part of larger HSPG glycoproteins (such as agrin, syndecan, etc.) which are transmembranous. These HSPGs might act as co-receptors for various functions (Carey, 1997). In the absence of ligands, HSPGs are distributed at random on the cell surface whereas in the presence of specific ligands HSPGs may aggregate and co-localize with other components of the cytoplasmic machinery (Martinho et al., 1996). The TAT-PTD peptide investigated here has a sufficiently strong binding affinity to HS to induce aggregation by cross-linking HS molecules located on neighboring HSPGs. After cross-linking additional mechanisms of uptake could be activated (Carey, 1997).
The indiscriminate and almost equally tight binding of TAT-PTD to different glycosaminoglycans can explain both activating and inhibitory mechanisms of TAT. If the cell surface carries only a few selected proteoglycans, TAT-PTD binding is limited to a few receptor molecules. In contrast, if the cell surface offers a broad range of glycosaminoglycans, TAT-PTD binding is nonselective and will follow statistical principles. Addition of external HS could also produce regulatory effects. Added at stoichiometric amounts, a neutral TAT-PTD/heparan sulfate complex can be formed which, in turn, can be adsorbed to the membrane surface and activate consecutive reaction steps. Added in excess, heparan sulfate brings the HS/TAT-PTD complex back into solution and the peptide is removed from further interactions.
By analogy, we expect a similar mechanism for heparin which may explain both stimulatory and inhibitory effects of heparin/TAT interaction observed in cell proliferation. The full length HIV-TAT protein has been found to be an angiogenic growth factor. TAT induces endothelial cell proliferation after the cells have been stimulated by cytokines (Barillari et al., 1992). Low doses of heparin enhanced this response to TAT and high doses of heparin inhibited this proliferative response (Albini et al., 1996). At low heparin concentrations, the added heparin will be completely complexed with TAT. The electrically neutral complex might then interact with outer cell membrane components (HSPGs) or translocate diffusively through the cell membrane. As more heparin is added, the neutral, TAT-saturated complex will be dissolved in favor of heparin/TAT complexes with an excess negative charge. At this stage the complex is repelled from the membrane surface and heparin acts inhibitorily.
In summary, isothermal titration calorimetry has provided detailed quantitative insight into the interaction between the cationic TAT-PTD peptide and anionic glycosaminoglycans. The anionic macromolecules have several independent binding sites for TAT-PTD and the density of binding sites is roughly correlated with the extent of sulfatation. The dissociation constant of the TAT-PTD complex is KD ∼ 1 μM and is approximately three orders-of-magnitude smaller than that observed for negatively charged lipid membranes (Ziegler et al., 2003). Binding of TAT-PTD (and, in turn, TAT) to glycosaminoglycans on the cell surface is hence distinctly more probable than binding to the lipid bilayer. The tight interaction of TAT-PTD with glycosaminoglycans and the formation of different types of charged or neutral TAT-PTD glycosaminoglycan complexes provides a solid physical-chemical foundation for the involvement of proteoglycans in TAT translocation across the cell membrane.
Acknowledgments
This work was supported by the Swiss National Science Foundation Grant 31-58800.99.
Abbreviations used: CPP, cell-penetrating peptides; GlcUA, D-glucuronic acid; GlcNAc, N-acetyl-D-glucosamine; HIV, human immunodeficiency virus; HS, heparan sulfate; HSPG, heparan sulfate proteoglycans; IdoA, L-iduronic acid; ITC, isothermal titration calorimetry; PTD, protein transduction domain; TAT, trans-acting activator of transcription; TAR, TAT activation region.
References
- Albini, A., R. Benelli, M. Presta, M. Rusnati, M. Ziche, A. Rubartelli, G. Paglialunga, F. Bussolino, and D. Noonan. 1996. HIV-TAT protein is a heparin-binding angiogenic growth factor. Oncogene. 12:289–297. [PubMed] [Google Scholar]
- Barillari, G., L. Buonaguro, V. Fiorelli, J. Hoffman, F. Michaels, R. C. Gallo, and B. Ensoli. 1992. Effects of cytokines from activated immune cells on vascular cell-growth and HIV-1 gene-expression—implications for AIDS-Kaposi's Sarcoma pathogenesis. J. Immunol. 149:3727–3734. [PubMed] [Google Scholar]
- Bayer, P., M. Kraft, A. Ejchart, M. Westendorp, R. Frank, and P. Rosch. 1995. Structural studies of HIV-1 TAT protein. J. Mol. Biol. 247:529–535. [DOI] [PubMed] [Google Scholar]
- Belting, M. 2003. Heparan sulfate proteoglycan as a plasma membrane carrier. Trends Biochem. Sci. 28:145–151. [DOI] [PubMed] [Google Scholar]
- Carey, D. J. 1997. Syndecans: multifunctional cell-surface co-receptors. Biochem. J. 327:1–16. [DOI] [PMC free article] [PubMed] [Google Scholar]
- Churcher, M. J., C. Lamont, F. Hamy, C. Dingwall, S. M. Green, A. D. Lowe, P. J. G. Butler, M. J. Gait, and J. Karn. 1993. High-affinity binding of TAR RNA by the HIV type-1 TAT protein requires base-pairs in the RNA stem and amino-acid residues flanking the basic region. J. Mol. Biol. 230:90–110. [DOI] [PubMed] [Google Scholar]
- Clavel, F., M. Guyader, D. Guetard, M. Salle, L. Montagnier, and M. Alizon. 1986. Molecular cloning and polymorphism of the human immune deficiency virus type 2. Nature. 324:691–695. [DOI] [PubMed] [Google Scholar]
- Derossi, D., S. Calvet, A. Trembleau, A. Brunissen, G. Chassaing, and A. Prochiantz. 1996. Cell internalization of the third helix of the Antennapedia homeodomain is receptor-independent. J. Biol. Chem. 271:18188–18193. [DOI] [PubMed] [Google Scholar]
- Eguchi, A., T. Akuta, H. Okuyama, T. Senda, H. Yokoi, H. Inokuchi, S. Fujita, T. Hayakawa, K. Takeda, M. Hasegawa, and M. Nakanishi. 2001. Protein transduction domain of HIV-1 TAT protein promotes efficient delivery of DNA into mammalian cells. J. Biol. Chem. 276:26204–26210. [DOI] [PubMed] [Google Scholar]
- Fawell, S., J. Seery, Y. Daikh, C. Moore, L. L. Chen, B. Pepinsky, and J. Barsoum. 1994. TAT-mediated delivery of heterologous proteins into cells. Proc. Natl. Acad. Sci. USA. 91:664–668. [DOI] [PMC free article] [PubMed] [Google Scholar]
- Fowlkes, J. L., and D. M. Serra. 1996. Characterization of glycosaminoglycan-binding domains present in insulin-like growth factor-binding protein-3. J. Biol. Chem. 271:14676–14679. [DOI] [PubMed] [Google Scholar]
- Frankel, A. D., and C. O. Pabo. 1988. Cellular uptake of the TAT protein from human immunodeficiency virus. Cell. 55:1189–1193. [DOI] [PubMed] [Google Scholar]
- Frankel, A. D., and J. A. Young. 1998. HIV-1: fifteen proteins and an RNA. Annu. Rev. Biochem. 67:1–25. [DOI] [PubMed] [Google Scholar]
- Gius, D., A. M. Vocero-Akbani, M. Wei, and S. F. Dowdy. 1997. TAT mediated protein transduction into cells: examination phosphorylation status of the retinoblastoma protein in vivo. Int. J. Radiat. Oncol. Biol. Phys. 39:160–160. [Google Scholar]
- Green, M., and P. M. Loewenstein. 1988. Autonomous functional domains of chemically synthesized human immunodeficiency virus TAT trans-activator protein. Cell. 55:1179–1188. [DOI] [PubMed] [Google Scholar]
- Ho, A., S. R. Schwarze, S. J. Mermelstein, G. Waksman, and S. F. Dowdy. 2001. Synthetic protein transduction domains: enhanced transduction potential in vitro and in vivo. Cancer Res. 61:474–477. [PubMed] [Google Scholar]
- Howard, T. M., and S. Rasheed. 1996. Genomic structure and nucleotide sequence analysis of a new HIV type 1 subtype A strain from Nigeria. AIDS Res. Hum. Retrovir. 12:1413–1425. [DOI] [PubMed] [Google Scholar]
- Huang, L., H. Farhood, N. Serbina, A. G. Teepe, and J. Barsoum. 1995. Endosomolytic activity of cationic liposomes enhances the delivery of human immunodeficiency virus-1 trans-activator protein (TAT) to mammalian cells. Biochem. Biophys. Res. Commun. 217:761–768. [DOI] [PubMed] [Google Scholar]
- Laspia, M. F., A. P. Rice, and M. B. Mathews. 1989. HIV-1 TAT protein increases transcriptional initiation and stabilizes elongation. Cell. 59:283–292. [DOI] [PubMed] [Google Scholar]
- Lewin, M., N. Carlesso, C. H. Tung, X. W. Tang, D. Cory, D. T. Scadden, and R. Weissleder. 2000. TAT peptide-derivatized magnetic nanoparticles allow in vivo tracking and recovery of progenitor cells. Nat. Biotechnol. 18:410–414. [DOI] [PubMed] [Google Scholar]
- Lewis, G. N., M. Randall, K. S. Pitzer, and L. Brewer. 1961. Thermodynamics, 2nd Ed. McGraw-Hill, New York. 524.
- Lindgren, M., M. Hallbrink, A. Prochiantz, and U. Langel. 2000. Cell-penetrating peptides. Trends Pharmacol. Sci. 21:99–103. [DOI] [PubMed] [Google Scholar]
- Long, K. S., and D. M. Crothers. 1995. Interaction of HIV type-1 TAT-derived peptides with TAR RNA. Biochemistry. 34:8885–8895. [DOI] [PubMed] [Google Scholar]
- Luo, Y., S. J. Madore, T. G. Parslow, B. R. Cullen, and B. M. Peterlin. 1993. Functional analysis of interactions between TAT and the trans-activation response element of human immunodeficiency virus type 1 in cells. J. Virol. 67:5617–5622. [DOI] [PMC free article] [PubMed] [Google Scholar]
- Mabrouk, K., J. Vanrietschoten, E. Vives, H. Darbon, H. Rochat, and J. M. Sabatier. 1991. Lethal neurotoxicity in mice of the basic domains of HIV and SIV REV proteins—study of these regions by circular-dichroism. FEBS Lett. 289:13–17. [DOI] [PubMed] [Google Scholar]
- Mai, J. C., H. M. Shen, S. C. Watkins, T. Cheng, and P. D. Robbins. 2002. Efficiency of protein transduction is cell type-dependent and is enhanced by dextran sulfate. J. Biol. Chem. 277:30208–30218. [DOI] [PubMed] [Google Scholar]
- Mann, D. A., and A. D. Frankel. 1991. Endocytosis and targeting of exogenous HIV-1 TAT protein. EMBO J. 10:1733–1739. [DOI] [PMC free article] [PubMed] [Google Scholar]
- Martinho, R. G., S. Castel, J. Urena, M. Fernandez-Borja, R. Makiya, G. Olivercrona, M. Reina, A. Alonso, and S. Vilaro. 1996. Ligand binding to heparan sulfate proteoglycans induces their aggregation and distribution along actin cytoskeleton. Mol. Biol. Cell. 7:1771–1788. [DOI] [PMC free article] [PubMed] [Google Scholar]
- Mitchell, D. J., D. T. Kim, L. Steinman, C. G. Fathman, and J. B. Rothbard. 2000. Polyarginine enters cells more efficiently than other polycationic homopolymers. J. Pept. Res. 56:318–325. [DOI] [PubMed] [Google Scholar]
- Nath, A., K. Psooy, C. Martin, B. Knudsen, D. S. K. Magnuson, N. Haughey, and J. D. Geiger. 1996. Identification of a human immunodeficiency virus type-1 TAT epitope that is neuroexcitatory and neurotoxic. J. Virol. 70:1475–1480. [DOI] [PMC free article] [PubMed] [Google Scholar]
- Orsini, M. J., C. M. Debouck, C. L. Webb, and P. G. Lysko. 1996. Extracellular human immunodeficiency virus type-1 TAT protein promotes aggregation and adhesion of cerebellar neurons. J. Neurosci. 16:2546–2552. [DOI] [PMC free article] [PubMed] [Google Scholar]
- Pooga, M., M. Hallbrink, M. Zorko, and U. Langel. 1998. Cell penetration by transportan. FASEB J. 12:67–77. [DOI] [PubMed] [Google Scholar]
- Prochiantz, A. 2000. Messenger proteins: homeoproteins, TAT et al. Curr. Opin. Cell Biol. 12:400–406. [DOI] [PubMed] [Google Scholar]
- Rana, T. M., and K. T. Jeang. 1999. Biochemical and functional interactions between HIV-1 TAT protein and TAR RNA. Arch. Biochem. Biophys. 365:175–185. [DOI] [PubMed] [Google Scholar]
- Roy, C., C. Knaak, P. Garvie, B. Limmer, and J. Campione-Piccardo. 1989. Plasmid library for the transcription of RNA probes complementary to the entire genome of the human immunodeficiency virus type 1 (HIV-1). Biochem. Cell. Biol. 67:510–515. [DOI] [PubMed] [Google Scholar]
- Rusnati, M., D. Coltrini, P. Oreste, G. Zoppetti, A. Albini, D. Noonan, F. D. diFagagna, M. Giacca, and M. Presta. 1997. Interaction of HIV-1 TAT protein with heparin—role of the backbone structure, sulfation, and size. J. Biol. Chem. 272:11313–11320. [DOI] [PubMed] [Google Scholar]
- Rusnati, M., G. Tulipano, D. Spillmann, E. Tanghetti, P. Oreste, G. Zoppetti, M. Giacca, and M. Presta. 1999. Multiple interactions of HIV-I TAT protein with size-defined heparin oligosaccharides. J. Biol. Chem. 274:28198–28205. [DOI] [PubMed] [Google Scholar]
- Rusnati, M., G. Tulipano, C. Urbinati, E. Tanghetti, R. Giuliani, M. Giacca, M. Ciomei, A. Corallini, and M. Presta. 1998. The basic domain in HIV-1 TAT protein as a target for polysulfonated heparin-mimicking extracellular TAT antagonists. J. Biol. Chem. 273:16027–16037. [DOI] [PubMed] [Google Scholar]
- Salminen, M. O., C. Koch, E. Sandersbuell, P. K. Ehrenberg, N. L. Michael, J. K. Carr, D. S. Burke, and F. E. McCutchan. 1995. Recovery of virtually full-length HIV-1 provirus of diverse subtypes from primary virus cultures using the polymerase chain-reaction. Virology. 213:80–86. [DOI] [PubMed] [Google Scholar]
- Sandgren, S., F. Cheng, and M. Belting. 2002. Nuclear targeting of macromolecular polyanions by an HIV-TAT derived peptide—role for cell-surface proteoglycans. J. Biol. Chem. 277:38877–38883. [DOI] [PubMed] [Google Scholar]
- Schwarze, S. R., A. Ho, A. Vocero Akbani, and S. F. Dowdy. 1999. In vivo protein transduction: delivery of a biologically active protein into the mouse. Science. 285:1569–1572. [DOI] [PubMed] [Google Scholar]
- Schwarze, S. R., K. A. Hruska, and S. F. Dowdy. 2000. Protein transduction: unrestricted delivery into all cells? Trends Cell Biol. 10:290–295. [DOI] [PubMed] [Google Scholar]
- Seelig, J. 1997. Titration calorimetry of lipid-peptide interactions. Biochim. Biophys. Acta. Rev. Biomembr. 1331:103–116. [DOI] [PubMed] [Google Scholar]
- Sodroski, J., R. Patarca, C. Rosen, F. Wong Staal, and W. Haseltine. 1985. Location of the trans-activating region on the genome of human T-cell lymphotropic virus type III. Science. 229:74–77. [DOI] [PubMed] [Google Scholar]
- Stein, S., A. Weiss, K. Adermann, P. Lazarovici, J. Hochman, and H. Wellhoner. 1999. A disulfide conjugate between anti-tetanus antibodies and HIV (37–72) TAT neutralizes tetanus toxin inside chromaffin cells. FEBS Lett. 458:383–386. [DOI] [PubMed] [Google Scholar]
- Tanford, C. 1961. Physical Chemistry of Macromolecules. John Wiley & Sons, New York. 532.
- Torchilin, V. P., R. Rammohan, V. Weissig, and T. S. Levchenko. 2001. TAT peptide on the surface of liposomes affords their efficient intracellular delivery even at low temperature and in the presence of metabolic inhibitors. Proc. Natl. Acad. Sci. USA. 98:8786–8791. [DOI] [PMC free article] [PubMed] [Google Scholar]
- Tyagi, M., M. Rusnati, M. Presta, and M. Giacca. 2001. Internalization of HIV-1 TAT requires cell surface heparan sulfate proteoglycans. J. Biol. Chem. 276:3254–3261. [DOI] [PubMed] [Google Scholar]
- van Holde, K. E., W. C. Johnson, and S. P. Ho. 1998. Principles of Physical Biochemistry. Prentice Hall, Upper Saddle River, New Jersey. 605.
- Violini, S., V. Sharma, J. L. Prior, M. Dyszlewski, and D. Piwnica-Worms. 2002. Evidence for a plasma membrane-mediated permeability barrier to TAT basic domain in well-differentiated epithelial cells: lack of correlation with heparan sulfate. Biochemistry. 41:12652–12661. [DOI] [PubMed] [Google Scholar]
- Vives, E., P. Brodin, and B. Lebleu. 1997. A truncated HIV-1 TAT protein basic domain rapidly translocates through the plasma membrane and accumulates in the cell nucleus. J. Biol. Chem. 272:16010–16017. [DOI] [PubMed] [Google Scholar]
- Wadia, J. S., and S. F. Dowdy. 2002. Protein transduction technology. Curr. Opin. Biotechnol. 13:52–56. [DOI] [PubMed] [Google Scholar]
- Weeks, K. M., C. Ampe, S. C. Schultz, T. A. Steitz, and D. M. Crothers. 1990. Fragments of the HIV-1 TAT protein specifically bind TAR RNA. Science. 249:1281–1285. [DOI] [PubMed] [Google Scholar]
- Wender, P. A., D. J. Mitchell, K. Pattabiraman, E. T. Pelkey, L. Steinman, and J. B. Rothbard. 2000. The design, synthesis, and evaluation of molecules that enable or enhance cellular uptake: peptoid molecular transporters. Proc. Natl. Acad. Sci. USA. 97:13003–13008. [DOI] [PMC free article] [PubMed] [Google Scholar]
- Wiseman, T., S. Williston, J. F. Brandts, and L. N. Lin. 1989. Rapid measurement of binding constants and heats of binding using a new titration calorimeter. Anal. Biochem. 179:131–137. [DOI] [PubMed] [Google Scholar]
- Ziegler, A., X. Li Blatter, A. Seelig, and J. Seelig. 2003. Protein transduction domains of HIV-1 and SIV TAT interact with charged lipid vesicles. Binding mechanism and thermodynamic analysis. Biochemistry. 41:9185–9194. [DOI] [PubMed] [Google Scholar]