

Abstract
High-field (i.e., 94 GHz) electron paramagnetic resonance is used to characterize the nonaxial ordering of spin-labeled lipid chains in membranes containing cholesterol. Employing high magnetic fields (and microwave frequencies) allows investigation of both the lateral and transverse ordering of the phospholipid chains by cholesterol, from the x-y and z-elements, respectively, of the spin-label g-tensor. Transverse ordering is described by the conventional order parameter, 〈P2(cosβ)〉, where β is the instantaneous inclination of the chain axis to the membrane normal; and lateral ordering is described by the order parameter 〈cos2(φ −  )〉, where φ is the azimuthal angle about the chain axis and
  is the mean azimuthal orientation about which angular fluctuations take place. To obtain high positional resolution, phosphatidylcholines spin labeled at all odd and even positions from n = 4 to n = 14 in the sn-2 chain (1-acyl-2-[n-(4,4′-dimethyloxazolidine-N-oxyl)]stearoyl-sn-glycero-3-phosphocholine) are used at probe amounts in membranes of dimyristoyl phosphatidylcholine containing either high (40 mol %) or low (5 mol %) concentrations of cholesterol. At high-cholesterol content, lateral ordering of the spin-labeled lipid chains is detected over a wide range of temperature throughout the liquid-ordered phase. The transverse profile of lateral φ-ordering with position, n, of chain labeling follows the profile of the rigid steroid nucleus of cholesterol. It becomes progressively averaged toward the terminal methyl group of the sn-2 chain, in the region of the flexible hydrocarbon chain of cholesterol. At low-cholesterol content, lateral chain ordering is prominent at low temperature, but diminishes at progressively higher chain positions with increasing temperature. The nonaxial lipid ordering may be related to the formation of in-plane lipid domains in membranes containing cholesterol and saturated lipids.
INTRODUCTION
Cholesterol is well known to exert a transverse ordering and a lateral condensing effect on the lipid chains in biological membranes (see, e.g., Schreier-Muccillo et al. (1973); Marsh and Smith (1973)). Transverse ordering is intimately connected with trans-gauche isomerism of the lipid chains and has been investigated extensively by magnetic resonance methods, both spin-label electron paramagnetic resonance (EPR) and 2H-NMR (see, e.g., Knowles and Marsh (1991)). Lateral ordering, by contrast, has been far less studied. The latter, however, is likely to be associated directly with the possible induction of spatially differentiated in-plane membrane microdomains (Simons and Ikonen, 1997; Simons and Toomre, 2000) or condensed complexes (McConnell and Radhakrishnan, 2003). As a potential platform for intracellular signaling and membrane sorting, such mechanisms currently attract considerable interest.
Previously, we have found that nonaxial ordering of lipid chains can be studied by spin-label EPR employing high magnetic fields (Gaffney and Marsh, 1998). At conventional EPR fields and frequencies, the spectra of spin-labeled lipid chains are dominated by the 14N-hyperfine anisotropy, which has axial symmetry. Only at high field does the Zeeman anisotropy come to dominate and the EPR spectra become sensitive to lateral ordering of the spin-labeled lipid chains. This nonaxial ordering is characterized by incomplete motional averaging of the x- and y-features of the g-tensor for doxyl spin labels, the principal z axis of which is directed along the lipid-chain long axis. Subsequent spectral simulations, with different dynamic models, confirmed that the nonaxial x-y spectral anisotropy is a consequence of rapid rotation about the lipid chain axis that is of strictly limited amplitude, rather than simply a result of slow unrestricted azimuthal rotation that is slow on the spin-label EPR timescale (Livshits and Marsh, 2000). Indeed, it was shown recently that high-field EPR spectra are sensitive only to the very rapid components of spin-label rotational motion (Lou et al., 2001), in agreement with this finding. Essentially, the high-field resonance data provide a “high-speed snapshot” of the molecular conformation and orientation. The time constant for this snapshot is less than the time required for a single step in lateral diffusion of the lipid molecule. Thus, the molecular orientation recorded is that of the immediate local environment, which is likely to differ between different membrane microdomains, and possibly between molecules in complexes and those not in complexes. The same is also true of the local mobility of the spin-labeled lipid.
In this work, we characterize the lateral and transverse order of the lipid chain segments in cholesterol-containing membranes at high positional resolution. This is done by using 94-GHz EPR spectroscopy, in conjunction with a series of phosphatidylcholine probes that are spin-labeled site specifically in their sn-2 chain, at each C-atom position—odd and even—from C4 to C14. Membranes of dimyristoyl phosphatidylcholine containing both high (40 mol %) and low (5 mol %) cholesterol concentrations are investigated over a wide range of temperature, encompassing the liquid-ordered phase. By exploiting the site selection of high-field spectroscopy, it is possible to determine order parameters, 〈P2(cos β)〉 and 〈cos 2(φ− )〉, respectively, for both uniaxial (β) and azimuthal (φ) ordering of the lipid chains. These are obtained from measurements of the principal elements, 〈gxx〉, 〈gyy〉, and 〈gzz〉, of the partially averaged g-tensor. In membranes with high-cholesterol content, it is found that the transverse profile of lateral chain ordering corresponds to the vertical location of the cholesterol steroid nucleus in the membrane and that the liquid-ordered phase persists over an extended range of temperature. In membranes with low-cholesterol content, lateral ordering is detected only for the higher chain segment positions and diminishes rapidly with increasing temperature. These results have direct implications for the formation of spatially differentiated in-plane lipid domains in membranes containing cholesterol.
MATERIALS AND METHODS
Materials
Dimyristoyl phosphatidylcholine (DMPC) was obtained from Avanti Polar Lipids (Alabaster, AL) and cholesterol from Merck (Darmstadt, Germany). Spin-labeled stearic acid positional isomers (n-(4,4-dimethyoxazolidine-N-oxyl)stearic acid; n-SASL) were synthesized as described by Hubbell and McConnell (1971). The corresponding phosphatidylcholines spin labeled in the sn-2 chain (1-acyl-2-[n-(4,4-dimethyloxazolidine-N-oxyl)]stearoyl-sn-glycero-3-phosphocholine; n-PCSL) were synthesized by acylating lysophosphatidylcholine with the corresponding n-SASL isomer, as described in Marsh and Watts (1982).
Sample preparation
DMPC, the required mol percentage of cholesterol and 0.5 mol % n-PCSL spin label were codissolved in dichloromethane; the solvent was evaporated under a nitrogen gas stream; and the samples were dried under vacuum overnight. The dried lipid mixtures were then hydrated with an excess of buffer (100 mM KCl; 10 mM Tris; 1 mM EDTA) at pH 7.5. The resulting lipid dispersions were introduced into 0.5 or 0.2 mm ID quartz capillaries, and then concentrated by centrifugation and the excess aqueous supernatant removed. The capillaries were flame sealed.
EPR spectroscopy
EPR spectra were recorded at a microwave frequency of 94 GHz on a Bruker E680 heterodyne W-band EPR spectrometer with a TE011-mode cylindrical cavity resonator and a split-coil superconducting magnet. The intermediate frequency of 9.6 GHz was provided by a Gunn diode oscillator, with up-conversion by mixing with a phase-locked W-band Gunn source. Microwave power was normally 0.05 mW and loaded cavity Q was in the region of 1500 or higher, depending on the sample. Field scans with room temperature coils were of 30 mT width about a center magnetic field of 3.35 T. The magnetic field was calibrated with a Mn:CaO standard sample (Bruker, Karlsruhe, Germany). The Zeeman modulation frequency was 100 kHz, with peak-to-peak amplitude of 0.1 mT. Sampling times were typically 20 ms, with 1 K points and filter time constants of 5 ms. Spectra were signal averaged over 1–16 scans, depending on signal strength. Measurements were made at variable temperature by using a thermostatted nitrogen gas-flow system. Peak maxima in the low- and high-field regions, and an intermediate region in the center of the spectrum (that is defined by powder-pattern simulations), were used to determine the effective g-tensor elements. No attempt was made to correct for any dispersion admixture in the experimental spectra.
THEORETICAL BACKGROUND
Simulation of 94-GHz EPR spectra of chain-labeled phospholipids in cholesterol-containing membranes reveals that the lateral ordering of the lipid chain segments is described adequately by rapid axial rotations of limited amplitude (Livshits and Marsh, 2000). Multifrequency studies have recently confirmed that high-field EPR spectra are sensitive only to very rapid (i.e., segmental) chain motions (Lou et al., 2001), at least for one position of labeling. Under these circumstances, motional narrowing theory can be used to derive the motional amplitudes directly, as described below.
In the high-field approximation, the nitroxide spin Hamiltonian is given by:
 |
(1) |
where the magnetic field vector, H, is oriented at polar angles (θ,φ) with respect to the x, y, z axes of the nitroxide magnetic tensors. The isotropic and anisotropic components of the latter are given by:
 |
(2) |
 |
(3) |
 |
(4) |
and similar expressions for the hyperfine tensor. From Eq. 1, the effective g-value for a general polar orientation (θ,φ) of the magnetic field relative to the spin label axes is given by:
 |
(5) |
where angular brackets indicate angular averaging over the restricted rotational motion of the spin label. This is assumed to be rapid relative to the frequency equivalent of the anisotropies to be averaged.
We choose a model in which the nitroxide performs limited angular oscillations about its z axis, that are independent of the orientation of the z axis itself (see Israelachvili et al. (1975)). If the mean φ-orientation between nitroxide x axis and magnetic field direction is  , then the nonaxial angular average becomes:
 |
(6) |
where the two angular averages on the right-hand side are independent. The condition:  corresponding to symmetric fluctuations about
  , has been used to obtain Eq. 6.
Israelachvili et al. (1975) present a model for restricted nonaxial anisotropic rotation that is consistent with the above assumptions (see Fig. 1). The nitroxide z axis is inclined at an instantaneous angle β to the director, which is oriented at an angle γ to the magnetic field direction. The magnetic field makes an azimuthal angle η to the mean nitroxide x-direction in the director axis system. The instantaneous azimuthal orientation of the nitroxide z-direction in the director axis system is given by the angle α, relative to the azimuthal orientation of the magnetic field in the same system. With these definitions, the angular variables appearing in Eqs. 5 and 6 are given by Israelachvili et al. (1975):
 |
(7) |
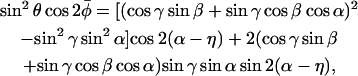 |
(8) |
where the angles γ and η are fixed. They specify the orientation of the magnetic field relative to the two axes of motional averaging.
FIGURE 1.

Relations between the instantaneous spin-label axis, zA, the magnetic field direction, H, and the membrane normal (director, N). For the lipid spin labels (n-PCSL), the nitroxide z axis coincides with the chain axis that has uniaxial ordering, about N. zA and H are inclined at β and γ, respectively, to N. zA is inclined at θ, with azimuth α in the director system, to H. The maximum amplitude of β is βo.  is the direction of the mean nitroxide x axis which performs φ-rotations about zA, with mean value
  and fluctuation amplitude ±φo. η is the azimuthal orientation of the
  axis for β = 0, in the director system.
The axially anisotropic rotation of the nitroxide z axis around the principal director results in averaging over the azimuthal angle α from 0 to 2π. The angular averages required in Eqs. 5 and 6 that are obtained from Eqs. 7 and 8 are then:
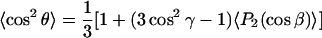 |
(9) |
 |
(10) |
where the second order Legendre polynomial is P2(x) = (1/2)(3x2 − 1). Thus 〈P2(cosβ)〉 is the conventional order parameter of the nitroxide z axis. The averaging over α has been performed explicitly in Eqs. 9 and 10, but that over β is left implicit. Not only the order parameter 〈P2(cosβ)〉, but also the average 〈cosβ〉 is required to specify the composite nonaxial average 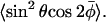
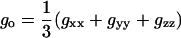
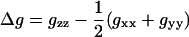
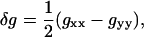
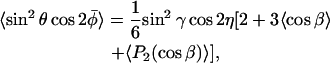
The motionally averaged principal g-tensor elements can now be obtained from Eq. 5, by using Eqs. 6, 9, and 10. They are defined for the magnetic field orientations specified by (γ,η) = (90°, 0°), (90°,90°) and γ = 0° corresponding to the x, y, and z diagonal elements, respectively (see Fig. 1). The resulting (partially) motionally averaged g-tensor elements are then:
 |
(11) |
 |
(12) |
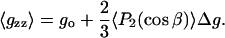 |
(13) |
These three independent g-values depend on three linearly independent terms. Thus, it is possible to obtain the isotropic g-value, go, and the conventional order parameter 〈P2(cos β)〉 directly from the experimental measurements. The third parameter that may be extracted from the experimental g-values, however, is the composite angular average  that depends on both the axial and nonaxial ordering. To obtain the angular averages it is necessary to assume values for the intrinsic g-tensor anisotropies Δg and δg, respectively. These depend on the environmental polarity, but may be corrected partially for this by using the standard ratios Δg/go and δg/go, together with the value of go obtained experimentally.
The angular average  that characterizes the nonaxial ordering can be determined from the composite average if a model is assumed for the axial distribution in β. For a restricted random walk of the nitroxide z axis within a cone of half-angle βo (see Fig. 1), each orientation is weighted by sinβ and the axial order parameter is given by:
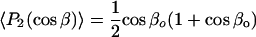 |
(14) |
and the other angular average required is:
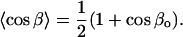 |
(15) |
From Eqs. 14 and 15, together with Eqs. 11–13, it is then possible to determine go, βo, and  If the azimuthal x axis ordering is characterized by completely random φ-angle fluctuations of maximum amplitude ±φo about the mean value
  , then also:
 |
(16) |
The rapid restricted angular motion can then be parameterized by the two independent maximum amplitudes, βo of the z axis tilt, and φo of the rotation or twist about the z axis. More generally, but less explicitly, the axial ordering is characterized by 〈P2(cosβ)〉 and the nonaxial or lateral ordering by 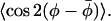
RESULTS
94-GHz spectra for high-cholesterol samples
Fig. 2 shows 94-GHz EPR spectra of different positional isomers (n = 4−14) of the n-PCSL phosphatidylcholine spin label in membranes of dimyristoyl phosphatidylcholine plus 40 mol % cholesterol. Spectra are given for temperatures of 30°C and 40°C, which is above the chain-melting temperature of DMPC bilayers (23°C). At this cholesterol content, the membranes are expected to be in a liquid-ordered state (see, e.g., Almeida et al. (1992)). For n = 4−8, in the upper part of the chain, the nonaxial anisotropy between the gxx- and gyy-positions in the spectra is seen very clearly in Fig. 2. This upper part of the phospholipid chain corresponds to the membrane location of the rigid steroid nucleus of cholesterol. Beyond this region of the chain, from n = 10 onwards, a progressive, temperature-dependent averaging of the x-y g-anisotropy takes place. The nonaxial anisotropy of gxx and gyy is completely averaged for 14-PCSL, producing a first-derivative feature centered at the mean g-value: (1/2)(〈gxx〉 + 〈gyy〉). The 14-PCSL label is positioned close to the terminal methyl region of the DMPC chains, and corresponds to the location of the aliphatic chain of cholesterol.
FIGURE 2.

94 GHz EPR spectra of n-PCSL spin labels in membranes of dimyristoyl phosphatidylcholine + 40 mol % cholesterol at 30°C (left panel) and 40°C (right panel).
Fig. 3 gives the positional dependence of the motionally averaged g-tensor elements, 〈gii〉, for three different temperatures. These are determined from the canonical x, y, and z turning points that are resolved in the pseudo-powder patterns (see Fig. 2). This exploits the site selection in nonaligned samples that can be achieved at high field. As can be seen from Fig. 3, the temperature-dependent averaging of the nonaxial x-y g-anisotropy begins at chain positions C-10 to C-11 and is complete at chain position C-14. At the same time, a restricted averaging of the off-axis z-(x,y) g-anisotropy begins at the C-10 to C-11 position. At C-14, however, the off-axis averaging is still of limited amplitude. Because of the opposing shifts induced by x-y and z-(x,y) averaging, the averaged value of 〈gyy〉 remains almost constant (see Fig. 3).
FIGURE 3.

Effective g-tensor elements, 〈gxx〉, 〈gyy〉, and 〈gzz〉, for n-PCSL phosphatidylcholine spin probes in membranes of dimyristoyl phosphatidylcholine + 40 mol % cholesterol at 10°, 30°, and 40°C (dotted, solid, and dashed lines, respectively). Data are given as a function of the position, n, of the spin label in the sn-2 chain of n-PCSL.
It is worthwhile to note that the EPR spectra of Fig. 2 show no indication of spin-spin broadening that would arise if the spin-labeled molecules were aggregated. Thus, the spin probes are well dispersed in the unlabeled host lipids. The EPR spectra from the same spin labels in membranes of low cholesterol content that are discussed later are similarly without detectable spin-spin broadening.
Azimuthal and uniaxial order parameters
To obtain order parameters and rotational amplitudes from the motionally averaged g-tensors requires making allowance for the polarity dependence of the rigid-limit values of the g-tensor. For different n-PCSL spin labels in bilayers of DMPC + 40 mol % cholesterol at −100°C, the g-tensor anisotropies are related to the isotropic go-value by: Δg/go = −(26.7 ± 0.6) × 10−4 and δg/go = (7.9 ± 0.7) × 10−4, respectively, over the entire range of n. These values are used to extract the values of the order parameters 〈P2(cos β)〉 and 〈cos 2(φ −  )〉 from Eqs. 11–13, as described in the theoretical section.
Fig. 4 gives the dependence on position, n, of chain labeling of the order parameters 〈cos2(φ −  )〉 and 〈P2(cos β)〉 for membranes of DMPC + 40 mol % cholesterol at three different temperatures. Both order parameters remain high and essentially constant up to the C-9 position of the chain. Beyond the C-11 position, the degree of order declines rapidly, more so for the axial rotation determined by 〈cos 2(φ −
  )〉 than for the off-axis fluctuation determined by 〈P2(cosβ)〉. At the C-14 position in the terminal methyl region of the chain, 〈cos 2(φ −
  )〉 = 0 at the higher temperatures. Here the φ-orientation is completely random, whereas the segmental order along the chain axis direction 〈P2(cos β)〉 ∼ 0.4−0.5 is still appreciable.
FIGURE 4.

Dependence of the order parameters (solid symbols) and rotational amplitudes (open symbols) on spin-label position n in the sn-2 chain of n-PCSL spin probes in membranes of dimyristoyl phosphatidylcholine + 40 mol % cholesterol at 10°, 30°, and 40°C (dotted, solid, and dashed lines, respectively). (Upper panel) Order parameter 〈cos2(φ −  )〉 and azimuthal angular amplitude φo. (Lower panel) Order parameter 〈P2(cosβ)〉 and off-axis angular amplitude βo.
Fig. 4 also gives the angular amplitudes, βo and φo, derived from the order parameters by using the models described in Eqs. 14 and 16. They clearly reflect, in an inverse fashion, the dependences on chain-labeling position, n, of the corresponding order parameters. In the upper part of the chain, up to C-10, the maximum angular excursions of β and φ are very limited, 30° or less at 30°C. At the terminal methyl region (C-14), full axial rotation of the chain segments, i.e., φo = 90°, is achieved at the higher temperatures, but the segmental fluctuation is restricted to maximum amplitudes βo ∼ 55°.
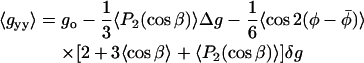
The off-axis fluctuation is also reflected in the motionally averaged value of the 14N hyperfine tensor element, 〈Azz〉, which is related to the order parameter 〈P2(cos β)〉 by an expression analogous to Eq. 13. From the latter, 〈Azz〉 is related to the corresponding g-tensor element, 〈gzz〉, by:
 |
(17) |
A linear relation between 〈Azz〉 and 〈gzz〉 is therefore expected for spin label positions with the same local polarity (which affects the values of ΔA, Δg, ao, and go). Fig. 5 shows that linear dependences are obtained, but with different gradients for the upper part of the chain (n = 4−7) and lower part of the chain (n = 10−14), respectively. This corresponds to the two regions of different polarity with a short intervening transitional region for n = 8−9. Fig. 5 therefore confirms that consistent off-axial amplitudes (i.e., values of 〈P2(cosβ)〉) are registered by both 〈Azz〉 and 〈gzz〉.
FIGURE 5.

Dependence of the motionally averaged hyperfine splitting, 〈Azz〉, on the motionally averaged g-value, 〈gzz〉, for n-PCSL spin labels in membranes of DMPC + 40 mol % cholesterol at 10°C (○), 30°C (•), and 40°C (□), respectively. Solid lines are linear regressions for the two separate regions, n ≤ 8 and n ≥ 9.
Low-cholesterol samples
Fig. 6 gives the parameters governing the lateral and transverse ordering of the lipid chains in membranes with low cholesterol content. Data are for the n-PCSL spin probes in membranes of dimyristoyl phosphatidylcholine plus 5 mol % cholesterol, at 10°, 30°, and 40°C. According to the phase diagram presented by Almeida et al. (1992), a sample with this composition does not display a liquid-ordered phase. The lowest temperature would correspond to the Lβ′ gel phase of membranes composed of DMPC alone. At this temperature, both lateral and transverse order parameters are close to unity for all chain positions up to n = 12 and decrease only little toward the terminal methyl group. It is of relevance that the tilt of the lipid chains in the Lβ′ gel phase of phosphatidylcholines is eliminated at cholesterol concentrations close to this range (Ladbrooke et al., 1968). The two higher temperatures correspond to the fluid Lα phase (i.e., liquid-disordered phase) of pure DMPC membranes. Despite the high lateral and transverse order at 10°C, the lateral order diminishes rapidly at higher temperature, in contrast to the situation for membranes with high cholesterol content (compare Figs. 4 and 6). At 40°C, the lateral order parameter  declines from C7 onwards and is reduced to zero on reaching C10, compared with C13 for DMPC membranes with 40 mol % cholesterol.
FIGURE 6.

Ordering profiles of n-PCSL spin-labeled lipid chains in membranes of dimyristoyl phosphatidylcholine + 5 mol % cholesterol at 10°, 30°, and 40°C (dotted, solid, and dashed lines, respectively). Order parameters are given by solid symbols and rotational amplitudes by open symbols. (Upper panel) Lateral chain order parameter 〈cos2(φ −  )〉 and azimuthal angular amplitude φo. (Lower panel) Transverse chain order parameter 〈P2(cosβ)〉 and off-axis angular amplitude βo.
It should be noted that the above determinations of the motional amplitudes from motional narrowing theory represent upper estimates for the rapid segmental motion. This is because of residual effects from slow components of the overall chain motion that might not be driven completely into the rigid limit at 94 GHz.
DISCUSSION
Lateral and transverse ordering
EPR spectra at high magnetic field are sensitive to the influence of cholesterol on both the lateral and the transverse ordering of spin-labeled lipid chain segments. At microwave frequencies of 94 GHz and above, the EPR spectra register primarily only the very rapid segmental chain motions, which can be analyzed directly by motional narrowing theory (Livshits and Marsh, 2000; Lou et al., 2001). The transverse order parameter, 〈P2(cos β)〉, can be obtained from the motional averaging of the 〈gzz〉 tensor element. Consistent values are obtained also from the motionally averaged 14N-hyperfine splitting, 〈Azz〉, as illustrated in Fig. 5. Note that the rightmost branch in Fig. 5 corresponds to the more polar region of the lipid chains, where the reduced gradient is characteristic of hydrogen bonding, i.e., water penetration (see Kurad et al. (2003)). The partially averaged 〈gxx〉- and 〈gyy〉-tensor elements are sensitive to the lateral ordering via the compound “order parameter”  The pure lateral order parameter
  is extracted from this by using an explicit model for the transverse ordering. For simplicity we assume restricted random walk within a cone of fixed angle, βo. The orientational ordering of the lipids by cholesterol is then described completely by the moments, or averages, 〈P2(cos β)〉 and
  Only the latter is partially model dependent.
From the positional dependences in Figs. 4 and 6, the lateral and transverse orders appear to be somewhat correlated. Decreases in lateral ordering are accompanied by corresponding decreases in the ordering of the chain axis. Fig. 7 gives a correlation plot for the two order parameters  and 〈P2(cos β)〉. Data from all spin-label positions, n, from membranes with 40 mol % cholesterol and 5 mol % cholesterol, and at measurement temperatures of 10°C, 30°C, and 40°C, are gathered together in Fig. 7. Only the somewhat deviant behavior of DMPC + 5 mol % cholesterol at 30°C is omitted. It is seen from the correlation plot that the initial loss of lateral order scales quite well with the reduction in chain-axis order. As already noted, however, complete randomization of lateral order, i.e.,
  , is achieved at differing values of 〈P2(cos β)〉, depending on the cholesterol content. At this point, the transverse chain order also still remains rather high. The correlation with transverse order, when the lateral order remains appreciable, suggests that the lateral and off-axis chain ordering by cholesterol are strongly coupled. A possible reason is that, in this regime, both reflect the same torsional or chain flexing motions. Beyond this, lateral order decays more rapidly than does transverse order, presumably because of a stronger contribution of whole-body type motions to rotation about the membrane normal than to off-axis rotation. A correlation very similar to that given in Fig. 7 also is obtained, if a fixed cone angle is assumed (i.e., constant β) to derive the
  order parameter, rather than the restricted random walk within a cone that is used for Fig. 7 (data not shown). This indicates that the correlation between the two order parameters is relatively insensitive to the model assumed for the off-axial motion and therefore is not introduced artificially by the coupling between azimuthal and off-axial motions that appears in Eqs. 11 and 12.
FIGURE 7.

Correlation of the lateral and transverse order parameters,  and 〈P2(cos β)〉, respectively, for spin-labeled lipid chain segments (n-PCSL with n = 4−14) in membranes of DMPC + 40 mol % cholesterol and of DMPC + 5 mol % cholesterol, at 10°, 30°, and 40°C.
Dependence on cholesterol content
Of particular interest is the difference in chain profile of the lateral ordering for membranes with high and low contents of cholesterol (compare Figs. 4 and 6). In both cases, the EPR spectra from the spin-labeled lipids consist of a single spectral component, that is indicative of a single, homogeneous environment. This finding is consistent with the phase diagram proposed by Almeida et al. (1992), in which the high-cholesterol samples are in a liquid-ordered state and the low-cholesterol samples are in a liquid-disordered state. For DMPC + 40 mol % cholesterol (Fig. 4), corresponding to the liquid-ordered phase, the lateral order remains high up to the C10-C11 position of the sn-2 chain, even at 40°C. This correlates with the expected location of cholesterol in the highly ordered membrane (see Fig. 8). The steroid nucleus extends as far as the C-10 to C-11 position of the all-trans sn-2 chain of DMPC. Thus, the region of strong lateral and transverse ordering of the lipid chain segments corresponds to the expected location of the rigid steroid nucleus, in the liquid-ordered phase. At chain positions beyond this, the chain ordering is less pronounced, particularly at higher temperatures. This corresponds to the region of the membrane in which the flexible aliphatic chain of cholesterol is located. On the other hand, lateral ordering is already lost completely at the C-10 position in membranes that contain only 5 mol % of cholesterol (see Fig. 6). The rigid steroid nucleus is not capable of inducing such a uniform degree of lateral ordering in the lipid chains at this low cholesterol content. Propagation of lateral chain close-packing, and concomittant increase in membrane cohesion, is not of such long range as in the liquid-ordered phase.
FIGURE 8.

Relative vertical positions of cholesterol (left) and the sn-2 chain of dimyristoyl phosphatidylcholine (right) in a highly ordered, hydrated lipid-bilayer membrane. Various chain segment positions are indicated. The configuration of DMPC is based on that in the crystal structure (Pearson and Pascher, 1979). The 3 β-OH of cholesterol is located at a level that would allow hydrogen bonding with the sn-2 carbonyl (Sankaram and Thompson, 1991). Adapted from Dufourc et al. (1984).
The implications of lateral chain packing for the formation of spatially differentiated membrane domains that are enriched in cholesterol and saturated lipids are evident. The domain formation is envisaged as a lateral separation between liquid-ordered regions of high cholesterol content–typified here by the samples that contain 40 mol % cholesterol—and liquid-disordered regions of low cholesterol content that are typified here by the DMPC samples containing only 5 mol % cholesterol. A hindered rotation about the chain long axes in the liquid-ordered (or cholesterol-condensed) phase reflects a tighter lateral molecular packing, which results in enhanced van der Waals interactions that could stabilize in-plane lipid microdomains or condensed complexes. The decrease in membrane free area markedly affects translational diffusion (Almeida et al., 1992), and results in a greatly increased lateral cohesion as reflected by the area expansion modulus (Needham and Nunn, 1990). From a functional standpoint, microdomains that are designated sphingolipid rafts have been proposed as vehicles for intracellular membrane trafficking, and as mediators of cellular signaling (Simons and Ikonen, 1997; Simons and Toomre, 2000). Condensed cholesterol-lipid complexes are additionally suggested as regulators of chemical activity in cellular cholesterol homeostasis (McConnell and Vrljic, 2003; Radhakrishnan and McConnell, 2000).
Acknowledgments
We thank Frau B. Angerstein for synthesis of spin-labeled phospholipids. This work was supported by the Priority Programme “High-Field EPR” of the Deutsche Forschungsgemeinschaft.
References
- Almeida, P. F. F., W. L. C. Vaz, and T. E. Thompson. 1992. Lateral diffusion in the liquid phases of dimyristoylphosphatidylcholine cholesterol lipid bilayers - a free volume analysis. Biochemistry. 31:6739–6747. [DOI] [PubMed] [Google Scholar]
- Dufourc, E. J., E. J. Parish, S. Chitrakorn, and I. C. P. Smith. 1984. Structural and dynamical details of cholesterol-lipid interactions as revealed by deuterium NMR. Biochemistry. 23:6062–6071. [Google Scholar]
- Gaffney, B. J., and D. Marsh. 1998. High-frequency, spin-label EPR of nonaxial lipid ordering and motion in cholesterol-containing membranes. Proc. Natl. Acad. Sci. USA. 95:12940–12943. [DOI] [PMC free article] [PubMed] [Google Scholar]
- Hubbell, W. L., and H. M. McConnell. 1971. Molecular motion in spin-labelled phospholipids and membranes. J. Am. Chem. Soc. 93:314–326. [DOI] [PubMed] [Google Scholar]
- Israelachvili, J., J. Sjösten, L. E. G. Eriksson, M. Ehrström, A. Gräslund, and A. Ehrenberg. 1975. ESR spectral analysis of the molecular motion of spin labels in lipid bilayers and membranes based on a model in terms of two angular motional parameters and rotational correlation times. Biochim. Biophys. Acta. 382:125–141. [DOI] [PubMed] [Google Scholar]
- Knowles, P. F., and D. Marsh. 1991. Magnetic resonance of membranes. Biochem. J. 274:625–641. [DOI] [PMC free article] [PubMed] [Google Scholar]
- Kurad, D., G. Jeschke, and D. Marsh. 2003. Lipid membrane polarity profiles by high-field EPR. Biophys. J. 85:1025–1033. [DOI] [PMC free article] [PubMed] [Google Scholar]
- Ladbrooke, B. D., R. M. Williams, and D. Chapman. 1968. Studies on lecithin-cholesterol-water interactions by differential scanning calorimetry and X-ray diffraction. Biochim. Biophys. Acta. 150:333–340. [DOI] [PubMed] [Google Scholar]
- Livshits, V. A., and D. Marsh. 2000. Simulation studies of high-field EPR spectra of spin-labeled lipids in membranes. J. Magn. Reson. 147:59–67. [DOI] [PubMed] [Google Scholar]
- Lou, Y., M. Ge, and J. H. Freed. 2001. A multifrequency ESR study of the complex dynamics of membranes. J. Phys. Chem. B. 105:11053–11056. [Google Scholar]
- Marsh, D., and I. C. P. Smith. 1973. An interacting spin label study of the fluidizing and condensing effects of cholesterol on lecithin bilayers. Biochim. Biophys. Acta. 298:133–144. [DOI] [PubMed] [Google Scholar]
- Marsh, D., and A. Watts. 1982. Spin-labeling and lipid-protein interactions in membranes. In Lipid-Protein Interactions, Vol. 2. P. C. Jost and O. H. Griffith, editors. Wiley-Interscience, New York. 53–126.
- McConnell, H. M., and A. Radhakrishnan. 2003. Condensed complexes of cholesterol and phospholipids. Biochim. Biophys. Acta. 1610:159–173. [DOI] [PubMed] [Google Scholar]
- McConnell, H. M., and M. Vrljic. 2003. Liquid-liquid immiscibility in membranes. Annu. Rev. Biophys. Biomol. Struct. 32:469–492. [DOI] [PubMed] [Google Scholar]
- Needham, D., and R. S. Nunn. 1990. Elastic deformation and failure of lipid bilayer membranes containing cholesterol. Biophys. J. 58:997–1000. [DOI] [PMC free article] [PubMed] [Google Scholar]
- Pearson, R. H., and I. Pascher. 1979. The molecular structure of lecithin dihydrate. Nature (Lond.). 281:499–501. [DOI] [PubMed] [Google Scholar]
- Radhakrishnan, A., and H. M. McConnell. 2000. Chemical activity of cholesterol in membranes. Biochemistry. 39:8119–8124. [DOI] [PubMed] [Google Scholar]
- Sankaram, M. B., and T. E. Thompson. 1991. Cholesterol-induced fluid-phase immiscibility in membranes. Proc. Natl. Acad. Sci. USA. 88:8686–8690. [DOI] [PMC free article] [PubMed] [Google Scholar]
- Schreier-Muccillo, S., D. Marsh, H. Dugas, H. Schneider, and I. C. P. Smith. 1973. A spin probe study of the influence of cholesterol on motion and orientation of phospholipids in oriented multibilayers and vesicles. Chem. Phys. Lipids. 10:11–27. [DOI] [PubMed] [Google Scholar]
- Simons, K., and E. Ikonen. 1997. Functional rafts in cell membranes. Nature. 387:569–572. [DOI] [PubMed] [Google Scholar]
- Simons, K., and D. Toomre. 2000. Lipid rafts and signal transduction. Nat. Rev. Mol. Cell Biol. 1:31–41. [DOI] [PubMed] [Google Scholar]