

Abstract
Gangliosides are the main component of lipid rafts. These microdomains, floating in the outer leaflet of cellular membrane, play a key role in fundamental cellular functions. Little is still known about ganglioside and phospholipid interaction. We studied mixtures of dipalmitoylphosphatidylcholine and GD3 (molar fraction of 0.2, 0.4, 0.6, 0.8) using complementary techniques: 1), thermodynamic properties of the Langmuir-Blodgett films were assessed at the air-water interface (surface tension, surface potential); and 2), three-dimensional morphology of deposited films on mica substrates were imaged by atomic force microscopy. Mixture thermodynamics were consistent with data in the literature. In particular, excess free energy was negative at each molar fraction, thus ruling out GD3 segregation. Atomic force microscopy showed that the height of liquid-condensed domains in deposited films varied with GD3 molar fraction, as compatible with a lipid aggregation model proposed by Maggio. No distinct GD3-rich domain was observed inside the films, suggesting that GD3 molecules gradually mix with dipalmitoylphosphatidylcholine molecules, confirming ΔG data. Morphological analysis revealed that the shape of liquid-condensed domains is strongly influenced by the amount of GD3, and an interesting stripe-formation phenomenon was observed. These data were combined with the thermodynamic results and interpreted in the light of McConnell's model.
INTRODUCTION
Many authors have recently shown interest in a new interpretation of the role played by membrane lipids in many cellular physiological processes.
In the classic fluid mosaic model, lipids only form a homogeneous environment where proteins diffuse freely, aggregating in oligomers to better perform their important functions (Singer and Nicolson, 1972).
Since the 1970s, different authors reported that even simple lipid mixtures exhibit lateral segregation of immiscible domains where peculiar lipids are organized in a liquid-ordered phase and where proteins can be selectively included or excluded (Hong-wei and McConnell, 1975).
More recently, Simons and Ikonen (1997) proposed a functional role for these microdomains. They stated that “the function of these microdomains is to serve as rafts for the transport of selected membranes or as relay stations in intracellular signaling.”
These microdomains are dynamic assemblies of cholesterol and sphingolipids. They form spontaneously because of the intrinsic properties of sphingolipids, the most abundant lipids in the so-called “rafts,” and are surrounded by a sea of glycerolipids. As proposed by Simons and Toomre (2000), there appears to be a strong difference between the phase aggregation of lipids in and outside of the microdomain: in the raft, sphingolipids form liquid-ordered phases; outside, unsaturated glycerolipids are organized in a liquid-disordered matrix. The more ordered phase in the rafts seems to be due to the preponderance of saturated hydrocarbon chains of sphingolipids, which allow the cholesterol to be tightly intercalated. Moreover, the formation of lipid rafts is thought to be favored by hydrogen bonding among the oligosaccharides in sphingolipids (Kasahara and Sanai, 1999).
Rafts are thought to concentrate some membrane receptors and associated molecules in a submicrometric area (<1000 Å), segregating them from the other membrane components. In these small domains it is possible to form highly ordered protein-lipid complexes, impossible or unstable in the homogeneous classic fluid model.
Many proteins have been found in rafts, as GPI-anchored proteins, caveolin, Scr family kinase, GTP binding proteins, and certain cytoskeletal and transmembrane proteins, including such an important one as Pgp, responsible for multidrug resistance phenomenon. Consequently, many functions have been attributed to rafts including vesicle trafficking, signal transduction, virus budding, cell motility, etc. (Simons and Toomre, 2000).
Because of the small dimensions of rafts, thought to be less than 1000 Å, up until now it has been very challenging to directly visualize them in living cells, and doubts exist if the labeling procedure necessary for visualization introduces artifacts (Jacobson and Dietrich, 1999).
The combined use of supported model membranes and atomic force microscopy (AFM) has been invaluable in studying lipid properties (Dufrene and Lee, 2000; Jass et al., 2000; Reviakine and Brisson, 2000; Diociaiuti et al., 2002) and can be applied to investigate raft formation in model systems (Vié et al., 1998; Yuan and Johnston, 2000, 2001; Rinia et al., 2001; Yuan et al., 2002). Monolayers and bilayers, obtained through Langmuir-Blodgett technology, have been used starting from pure l-α-dipalmitoylphosphatidylcholine (DPPC) or lipid mixtures to mimic the actual cellular membrane, adding sphingolipids in the presence or absence of cholesterol.
Gangliosides are glycosphingolipids containing sialic acid found in the outer leaflet of plasma membranes in vertebrate tissue. They constitute ∼5%–10% of the total lipid mass in nerve cells (Derry and Wolfe, 1967).
GD3 (a simple sketch of its structure is depicted in Fig. 1) is a ganglioside of particular relevance because it is the precursor of the b and c series ganglioside and constitutes 3%–8% of all gangliosides in adult brain. GD3 is the predominant ganglioside of the early, immature nervous system of birds and mammals, and its amount decreases in contrast with the accumulation of higher sialylated gangliosides during maturation. In pathologic conditions, ganglioside composition and distribution in the brain changes. GD3 plays an important role in cell growth and proliferation (Seyfried and Yu, 1985) and is overexpressed in some tumors, such as melanoma, in which it can serve as a tumor antigen (Nakano et al., 1996). It has been recently proposed that GD3, interacting directly with matrix proteins (type I and IV collagens, fibronectin, and laminin), might play some functional role in the attachment of human melanoma cells to the extracellular matrix, enhancing their metastatic potency (Nakano et al., 1999).
FIGURE 1.

Simple sketch of the structural features of the GD3.
The segregation process of GD3 has been recently investigated by Vyas et al. (2001) in comparison with GM1 in three different systems, that is cell membranes, isolated membrane rafts, and defined supported lipid monolayers. They concluded that GD3 behaves in a very different way from GM1: GM1 spontaneously self-associates whereas GD3 does not. Based on these considerations, it seems of particular interest to investigate the interaction mechanisms between GD3 and unsaturated glycerolipids (DPPC).
In the literature, lipid monolayers have been used to investigate ganglioside-DPPC interaction, and thermodynamic analysis of compression and potential isotherms of monolayer have been performed at the air-water interface (Maggio et al., 1997; Bordi et al., 1999). All these studies stressed the importance of the polar head composition and, consequently, of the electrostatic interaction occurring between molecules in the aggregation process. In particular, Bordi et al. (1999) investigated mono- (GM1, GM2, and GM3) and di-sialogangliosides (GD1a and GD1b) inserted in a DPPC matrix. A similar analysis was carried out by Maggio et al. (1997) on GD3, and two GD3-lactones (LacI and LacII). They showed that the presence of lactone rings leads to interactions with the DPPC that are very different from those exhibited by the native GD3. In the case of GD3/DPPC, they proposed an interesting intermolecular arrangement where the two species create a closely packed complex constituting a single phase, whereas for LacII the results indicated a tendency to aggregate in two separated phases.
The behavior of GD3/DPPC monolayers seems very different from those of GM1/DPPC, which have been extensively studied. Thermodynamic data suggest that, at least for a GM1/DPPC molar ratio of less than 40 mol %, GM1 aggregates form two segregated phases (Bordi et al., 1999). This result was validated by direct observations performed by AFM (Vié, 1998; Yuan and Johnston, 2000), which showed how, in monolayers, GM1-rich domains emerge from the surrounding liquid condensed (LC) phase of DPPC.
The aggregation behavior observed in monolayers has been confirmed in successive AFM studies performed on bilayers and monolayers composed of more complex lipid mixtures dipalmitoylphosphatidyletanolomine (DPPE), egg phosphatidylcholine (PC), sphingomyelin dioleoylphosphatidylcholine (DOPC) (Vié, 1998), and cholesterol (Yuan and Johnston, 2001; Yuan et al., 2002).
Up until now, no combined AFM-thermodynamic analysis has been performed on the aggregation process of GD3 in DPPC. The aim of this article is to address this question, performing compression and potential isotherm experiments on GD3/DPPC model membranes, at increasing GD3 molar fractions. Monolayers of the mixtures and plain components were prepared at the air-water interface by the Langmuir technique. Successively, films were deposited on mica and studied at high resolution by AFM.
Our results indicate that GD3 interacts with DPPC in a very different way than GM1. Instead of forming GD3-rich phases distinct from the DPPC phases, it appears rather to lead to a more uniform phase probably based on a GD3/DPPC complex.
MATERIALS AND METHODS
Langmuir-Blodgett films: sample preparation and thermodynamic measurements
Mixed GD3/DPPC monolayers with increasing GD3 concentration were prepared at the air-water interface following the Langmuir technique (Roberts, 1990). GD3 and DPPC were purchased from Sigma (St. Louis, MO) with a purity of more than 99.9%.
Mixed GD3/DPPC solutions (1 mg·ml−1) were prepared in chloroform/methanol/water (1:2:0.15) with different molar fractions of ∼20, 40, 60, 80, and 100 mol %. Appropriate amounts of solution were spread with a microsyringe onto the aqueous subphase. To allow sufficient solvent evaporation, monolayers at the air-subphase interface rested ∼10 min before compression. All experiments were carried out on a subphase constituted of distilled and deionized water, thermostatted by a water circulating bath (C25, Haake, Kerlsruhe, Germany) at a temperature of 20.0 ± 0.2°C. In all of our measurements we used Milli-Q freshly deionized and bidistilled water (water produced by an Elix 3 (Millipore, Molsheim, France) is fed in a Simplicity 135, (Millipore)). Water was drawn only when the measured specific resistivity was 18.2 M ohm cm, indicating that the maximal grade of purity had been reached. We also measured the pH, which for all the water lots remained constant at a value of 5.9.
The surface pressure-area isotherms were obtained by means of a computer-controlled commercial device (Minitrough; KSV, Helsinki, Finland) enclosed in a Plexiglas box to reduce surface contamination. Symmetric compression was achieved with two moving barriers at a constant rate of 10 mm min−1. The surface tension (π) of the lipid monolayer was measured using the Wilhelmy method, using a roughened platinum plate, with an accuracy of 1 mN m−1. The same apparatus allowed us to simultaneously measure the monolayer surface potential. Surface pressure and surface potential isotherms were directly acquired during the measurement.
Monolayers were deposited onto freshly cleaved mica substrates by vertically extracting the mica sheet through the film at a constant rate of 0.1 mm min−1 and keeping film surface tension constant at 5 mN m−1. The mica had been previously half-dipped into the subphase before monolayer deposition. Supported (L-B) monolayers were stored in a dry atmosphere to keep them stable over a long period of time. All films were studied at a high resolution by AFM. Five series of samples were prepared, and the best three series were chosen for the experiments.
Atomic force microscopy
The atomic force microscope was a BioProbe (ThermoMicroscopes, Sunnyvale, CA) equipped with a 100-μm scanner. Preliminary tests were made to choose the appropriate test parameters. The imaging of supported monolayers was performed in contact mode under environmental conditions. V-shaped cantilevers were employed with a nominal force constant of 0.05 N/m. Tip radius was less than 100 Å. Repeated scannings on the same area did not significantly disrupt the sample, and the resolution attained was satisfactory. Different regions (at least 20 per sample) of the samples were first observed starting from a scan size of 20 μm, then zoomed at higher magnifications. Scan rate was lower than 1 line per second; the applied force did not exceed 2 nN.
Morphological features in the image, such as domain areas, dimensions, and height, were measured (Image-Pro Plus 4.1, Media Cybernetics, Silver Spring, MD). The height of the compact domains in a sample set were compared at different molar fractions by means of ANOVA with Bonferroni correction (p < 0.01).
RESULTS AND DISCUSSION
Mixed GD3/DPPC monolayers were formed at the air-water interface in a Langmuir trough. The obtained compression (A) and potential (B) isotherms are shown in Fig. 2. In Fig. 2 A the typical plateau, located at ∼5 mN/m, indicating the coexistence of liquid-expanded (LE) and liquid-condensed (LC) phases, characterizes the isotherm relative to the pure DPPC. The presence of an increasing amount of GD3 clearly modified the shape and location of the curves, shifting them toward higher area values. In particular, the curves relative to the mixed monolayers show no apparent plateau, suggesting that the LE-LC transition gradually occurred. This observation is in agreement with the gradual mixing in the film of individual molecules with a mean molecular area higher than that of DPPC. The GD3 isotherm was shifted at high area values and shows a weak plateau located at ∼180 Å2.
FIGURE 2.

Thermodynamic results of GD3/DPPC mixtures at increasing molar fraction. (A) Compression isotherm curves (T = 20°C). (Inset) “Molecular area analysis” performed at π of 5 mN/m and 30 mN/m. (B) Experimental surface potential isotherm curves (T = 20°C). (Inset) “Surface potential analysis” at π of 5 mN/m and 30 mN/m.
From Fig. 2 A it is apparent that the collapse pressure of the mixed film lies between the collapse pressure of the pure DPPC and GD3 films, depending on the molar fraction of the components, indicating that the two components are miscible (Luckham et al., 1993; Dynarowicz-Latka et al., 2001).
The inset of Fig. 2 A reports the “molecular area analysis” of compression isotherms. An evident negative deviation from an additive relation can be observed at both 5 and 30 mN/m. The way in which the mean molecular areas are dependent on the composition of the mixed monolayer gives information on possible interactions between the different molecular species (Chattoraj and Birdi, 1984). Linear dependence indicates either ideal mixing or complete immiscibility of the two components. Conversely, whereas repulsive interactions cause positive deviations from linearity, negative deviations indicate attractive interactions between different molecules (Ruiz and Vìlchez, 1991). Our results seem to suggest the occurrence of attractive interaction between GD3 and DPPC, although a more complete analysis, including all thermodynamic parameters and potential measurements, is necessary to understand the molecular interaction occurring in the films.
The “partial molecular area analysis” (at 30 N/m) for DPPC and GD3 can be performed from the “molecular area analysis” curve, reported in the inset of Fig. 2 A, by assessing the intercept of the tangent line to the curve with the axis X = 0 and X = 1, respectively. Results are shown in Fig. 3 C. As can be observed, the partial molecular area of DPPC was ∼50 Å2 at low GD3 molar fractions; at X = 0.4 it tends to be lower than 35 Å2, a value generally accepted as an incompressibility limit for DPPC molecules (Maggio et al., 1997).
FIGURE 3.

(A) Experimental dipole moment μn curves as obtained following the Helmholtz equation (Eq. 1). (B) Excess free energy: as shown ΔG is always negative at any molar fraction. (C) “Partial molecular area analysis” relative to the plain DPPC and GD3 molecules, assessed at a surface pressure of 30 mN/m, as GD3 molar fraction X increases. (D) “Partial surface potential/molecule analysis” relative to the plain DPPC and GD3 molecules, assessed at a surface pressure of 30 mN/m, as GD3 molar fraction X increases.
Fig. 2 B shows the surface potentials as a function of the molecular area, at each molar fraction. Curves appeared to disperse ranging from the lowest molar fraction (pure DPPC) to the highest (pure GD3). Our results clearly show that the presence of GD3 molecules reduced the dipole density at the interface. In fact, it is quite clear that, as the GD3 molar fraction grows, the curve grows smooth and flat. In particular, the GD3 curve shows an almost constant and negative V range compared to the other curves.
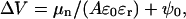
Surface potential arises from the dipole moments of the molecules forming the film, from the change in orientation of the water molecules at the subphase surface, and, in the case of ionized monolayers (GD3), also from the double-layer formed between headgroups and the electrolytic subphase (Taylor, 2000; Dynarowicz-Latka et al., 2001). The measured surface potential is the difference in potential between a monolayer-covered subphase and a monolayer-free subphase, taken as reference. This potential can be related to the dipole moment of the molecules forming the film through the Helmholtz equation (Taylor, 2000):
 |
(1) |
where ɛr and ɛ0 are, respectively, the “effective” dielectric constant within the layer and the permittivity of free space; μn is the normal component of the molecular dipole moment; A is the area occupied by each molecule; and ψ0 is the double-layer contribution. This equation can be simply derived considering the monolayer as a parallel plate condenser, comprising a sheet of uniformly distributed dipoles with ɛr an apparent relative permittivity that accounts for dipole-dipole interactions within the monolayer (Taylor, 2000).
The double-layer contribution ψ0 arises from the presence, in the subphase, of counterions opposite to the net charge carried by the molecular polar head and can be estimated according to the Gouy-Chapman theory (Israelachvili, 1992). In our case, only GD3 molecules are negatively charged, and it is possible to evaluate the charge density at the interface at the various X values. Counterion concentration can be evaluated from the pH value (5.9) of the pure water subphase. The values of ψ0 calculated at selected X using the partial molecular areas of the two components at 30 mM/m (Fig. 3 C) range from −330 to −405 mV. These values should in principle be subtracted (Eq. 1) from the experimental curves of Fig. 2 B to obtain the dipole moment. In the case of pure DPPC, this correction should be zero, since these molecules are not charged. This correction, that produced a rigid shift of each potential curve of Fig. 2 B toward higher values and did not modify the shape of the dipole moment as a function of X, appears somewhat arbitrary, being based on a theory (the Gouy-Chapman theory) whose assumptions are far to be fulfilled in the present case. More specifically, as clearly evidenced by Beitinger et al. (1989), in the case of large headgroups (as is the case for GD3), the charges cannot be considered homogeneously distributed at the water/hydrocarbon moiety interface. The theory does not take into account the specific adsorption of ionic species. Moreover, the effective charge density of the surface (needed to calculate the potential ψ0) is not exactly known due to the uncertainties in estimating the association constants of the different anionic or zwitterionic groups on the polar heads. These difficulties are even more pronounced when, due to the low ionic strength of the solution, the contribution to be subtracted is large (and the validity of the theory more questionable).
In our discussion, we consider only the variation of the measured potential (ΔV) with the area per molecule (A) or the differences in the measured potential, at a given area per molecule, for films of different composition (X). In this context subtracting the poorly determined contribution of the double layer ψ0 would have affected the data in an arbitrary manner. For this reason, we preferred to consider only the apparent potential drop across the film plane as significant.
The dipole moment μn arises from the contribution of different components: from water molecule reorientation at subphase surface, due to the presence of the monolayer; from headgroups; and from terminal methyl groups of the aliphatic chains. A simple surface potential measurement cannot discriminate between these different contributions. We decided to show in Fig. 3 A the quantity ΔV × A (Eq. 1), experimentally determined, that can be considered as an “overall effective dipole.” The shapes of these curves are not influenced by the theoretical ψ0 correction described before and are strongly influenced by the molecular rearrangement at the interface. The shape of the curves for the mixed films changes smoothly from pure DPPC to pure GD3, as would be expected if intermolecular interactions do not affect the orientation of the dipole moment and/or the effective permittivity of the layer, and the only effect is a “dilution” of one molecular species in the other. This observation is valid for all molecular fractions, except for X = 0.4. At this molar ratio, surface potential behavior is significantly different, indicating that a special arrangement of GD3 and DPPC molecules could take place at this concentration.
It is possible to perform the “partial surface potential/molecule analysis” from the “surface potential/molecule analysis” curves (inset of Fig. 2 B, where positive deviation from ideality, at both 5 and 30 mN/m, can be observed) following the same procedure used for the “partial molecular area analysis” described before. At a surface pressure of 30 mN/m, the partial surface potential/molecule as a function of GD3 molar fraction (Fig. 3 D) keeps roughly constant up to approximately X = 0.4. Beyond this value the partial surface potential/molecule of GD3 rather steeply decreases as that of DPPC increases, thus confirming that a molecular interaction occurs, as earlier suggested by the “partial molecular area analysis”.
The excess free energy (ΔG) of mixed monolayers is reported in Fig. 3 B and is negative for all the X values. A minimum located around X = 0.4 is clearly evident.
All of our thermodynamic results (Fig. 3) are in good agreement with the analysis performed by Maggio et al. (1997) on the same kind of film, supporting the proposed molecular arrangement model (see Fig. 4 A). In this model, at a monolayer compression higher than 25 mN/m (that is, in the LC phase of DPPC), single DPPC molecules tightly bind GD3 molecules through direct interaction of their acylic chains. Moreover, four such GD3/DPPC complexes are closely packed in a cubic symmetry, and one DPPC molecule can be allocated to the center of the cubic cell. As a result, five DPPC molecules can be closely bound to four GD3 ones. In this molecular arrangement at X > 0.44, DPPC molecules are segregated between GD3 molecules, in good agreement with our “partial molecular area analysis” observation of DPPC incompressibility (Fig. 3 C) and the occurrence of a strong molecular interaction suggested by the “partial surface potential/molecule analysis” results (Fig. 3 D). Moreover, a minimum in the ΔG located at X = 4/9 (0.44) should occur. In effect, this value is very close to the minimum shown in our ΔG experimental curve, located at approximately X = 0.4 (Fig. 3 B).
FIGURE 4.

(A) Simple sketch of the molecular arrangement proposed by Maggio et al. for the complex GD3/DPPC at molar fraction X = 0.44. (B–F) Proposed model for the vertical evolution of the molecular arrangement of the LC phase for the mixed films, when GD3 molar fraction X increases.
Conversely, thermodynamic results obtained from GM1 in DPPC experiments (Bordi et al., 1999) showed that ΔG is strongly positive up to X = 0.4, ruling out the existence of a complex GM1/DPPC at compression pressure typical of the LC DPPC phase. Consistently, AFM studies confirmed this suggestion, showing that GM1-rich phases of higher thickness are inserted in the surrounding LC phase of DPPC, characterized by a lowest thickness (Vié et al., 1998; Yuan and Johnston, 2000, 2001; Yuan et al., 2002).
Based on of this consideration, we do not expect to observe high distinct GD3-rich domains inside the DPPC LC-phase. In our idea, focused on the LC phase (Fig. 4, B–F), individual GD3 molecules should be gradually mixed with DPPC molecules. GD3 is reasonably distributed in the LE phase too, but we are interested in GD3-DPPC packing in the LC phase, which best represents molecular organization in native membranes. At low molar ratios (X = 0.2), single GD3 molecules should be bound to single DPPC molecules but, due to their limited number, without significantly modifying the structural organization and thickness of the LC DPPC phase (Fig. 4 C). A molar ratio around X = 0.44 (0.4, 0.6) should favor the phase proposed by Maggio, with a higher thickness than that of the DPPC LC-phase (Fig. 4 D). At higher molar fractions (X = 0.8), the observed phase should be always based on the proposed model, but with fewer DPPC molecules. In this case we expect a thickness similar to that observed for X = 0.4.
Our AFM images, showing the monolayer topology after the deposition onto mica at 5 mN/m, are reported in Fig. 5. AFM lateral resolution can be estimated to be on the order of 50 Å, whereas vertical resolution is typically higher, allowing us to measure variations on the order of 1 Å. It was thus possible to visualize the smallest LC domains and to accurately study differences in the lipid phase heights. The insets of Fig. 5 show high magnification of the same samples. Table 1 summarizes all morphological data obtained by AFM imaging.
FIGURE 5.

AFM topography (in air) of the GD3/DPPC films deposited on mica at a surface pressure of 5 mN/m. For each molar fraction a low magnification (16 × 16 μm) image is shown. (A) Plain DPPC, (B) X = 0.2, (C) X = 0.4, (D) X = 0.6, (E) X = 0.8, and (F) plain GD3. The insets show a higher magnification (2 × 2 μm) of the corresponding sample. Mean Z range = 50 Å.
TABLE 1.
AFM morphological data relative to the studied films. The liquid condensed (LC) phase height, LC mean diameter, and LC relative area occupied (Φ) are reported in the second, third, and fourth columns, respectively
| AFM morphological data
| |||
|---|---|---|---|
| LC domain height [Å] | Main LC domain diameter [μm] | LC area/total area (Φ) | |
| DPPC | 12 ± 3 | 5.45 ± 1.25 | 0.47 |
| X = 0.2 | 17 ± 5 | 3.7 ± 0.9 | 0.50 |
| X = 0.4 | 19 ± 6 | 3.28 ± 0.44 | 0.70 |
| X = 0.6 | 21 ± 7 | 1.98 ± 0.62 | 0.55 |
| X = 0.8 | 18 ± 6 | 1.81 ± 0.75 | 0.61 |
| GD3 | 0.14 ± 0.06 | 0.50 | |
Fig. 5 A, for plain DPPC, shows the typical LC phase domains with smooth borders, surrounded by the LE phase. The LE phase appeared dark and flat, in good agreement with the idea of a more disordered phase than LC, characterized by hydrocarbon tails differently tilted with respect to the surface. LC phase domains are higher than 12 ± 3 Å and characterized by a rounded shape of ∼5.45 μm in diameter. Sometimes three or more domains fuse, giving rise to flowerlike islands. At a higher magnification (inset), we can observe a porous structure in the LC phase.
Figs. 5, B and C, relative to X = 0.2 and X = 0.4, respectively, show a morphology very similar to plain DPPC (Fig. 5 A). At X = 0.2 the mean diameter is 3.7 μm, slightly less than the DPPC LC domains, whereas the height results are unchanged. Immersed in the LE phase, very small LC domains appear (diameter of ∼0.11 μm).
At X = 0.4 (Fig. 5 C) the mean domain diameter is comparable to that of X = 0.2 (3.28 μm), and the domain number per surface unit increases. Even the domain height is significantly higher than that of the plain DPPC (Table 1). In the LE phase, small compact domains are more abundant and of various sizes (typical diameters of ∼0.1 μm and 0.35 μm).
The small LC domains in LE phase observed so far are reasonably of the same kind as large domains. We can exclude the possibility that they are GD3 aggregates, as we did not observe different heights in small and large domains.
At X = 0.6 the morphology changes dramatically. LC domains appear composed of some compact zones (diameter of ∼2 μm) by which stripes protrude (Fig. 5 D). The mean stripe width was ∼0.14 μm. Even in this case, LC height is higher than that of plain DPPC. This trend is confirmed by the X = 0.8 image (Fig. 5 E) where small (diameter of ∼1.8 μm) compact homogeneous LC domains appear surrounded by a dense network covering the whole surface. All domains are always higher than that of plain DPPC (Table 1).
The GD3 low magnification image (Fig. 5 F) shows very flat zones, without important features. However, small higher islands of ∼0.14 μm can be observed at high magnification (see inset). In this case, it was very difficult to identify LC and LE phases and measure the step height; consequently, data are not reported in Table 1.
Our AFM results are in good agreement with the idea described above, based on the molecular arrangement proposed by Maggio et al. (1997) at X = 0.44. Up to this value the DPPC is primarily responsible for the arrangement, and GD3 molecules play only a secondary role. Consequently, domain shape and height is always similar to that of plain DPPC. At X = 0.4, GD3 molecules begin to modify domain size and height. After X = 0.4, molecular arrangement is dominated by the structure proposed by Maggio et al. (1997), higher than the plain DPPC LC-phase is.
Interestingly, at X = 0.6, domain morphology changes dramatically, giving rise to stripes. This behavior is not surprising because it is predicted by McConnell (1991) on the basis of a mathematical model and, only recently, experimentally observed by Keller and McConnell (1999). The latter concluded “the appearance of the stripe phase provides a useful diagnostic tool for finding critical points in the phase diagrams of complicated mixtures such as those found in biological membranes.” We hypothesize that between X = 0.4 and X = 0.6 we have passed through the critical point.
At X = 0.8 stripes disappeared, giving place to the formation of a filamentous network forming few compact domains with troubled borders. Even in this case step height is equal to those measured for X = 0.6, suggesting that the molecular arrangement is still based on GD3 molecules.
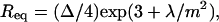
Different models have been proposed that allow prediction of the equilibrium sizes and shapes of liquid domains in lipid monolayers (Andelman et al., 1987; McConnell, 1991; Keller and McConnell, 1999). Based on the assumption that shape and size of the domains are determined by a competition between the line tension at the domain boundary, λ, and the electrostatic dipolar repulsion between the molecular heads, the theory predicts a dependence of the liquid domain size on the ratio λ/m2, where m = m1 − m2 is the difference in the dipole density of the two phases (defined as m = μn/A). At great distance from the critical point, equilibrium radii of the circular domains are given by (McConnell, 1991):
 |
(2) |
where Δ is a cutoff distance for dipolar interactions that can be assumed of the order of 10 Å (McConnell, 1991; Keller and McConnell, 1999). Near the critical point, domains appear increasingly elongated, and the width of such stripes is given by:
 |
(3) |
with Φ the area fraction occupied by the stripes (∼0.5 near a critical point).
From Eqs. 2 and 3, using values from Table 1 for the Req and w and Φ, it is possible to calculate the quantity λ/m2 at all GD3 molar fractions.
On the other hand, the dipole density m = μn/A and, following Eq. 1, is proportional to potential values (ΔV). So, the dipole density difference m = m1 − m2 can be roughly estimated from the potential curves reported in Fig. 2 B, even if some difficulties arose assessing the value of ΔV in the two different “pure” phases (LC and LE) and where the film can be considered completely in one or in the other phase. Only from a qualitative point of view we obtained a growing trend of m versus X, independently of the absolute values.
It was possible to qualitatively evaluate the line tension (λ) trend versus X, using the λ/m2 and m values. The λ-values so obtained for the mixed film are very close to the DPPC value, up to X = 0.4, whereas above X = 0.4 the λ-values for the mixed film remain constant and very close to the value relative to the plain GD3.
This observation, even if only qualitative, is consistent with the model of Fig. 4, where the molecular arrangement of films is mainly due to DPPC aggregation up to X = 0.4 and is dominated by the GD3 molecules beyond this threshold.
CONCLUSION
All our experimental data suggest that the aggregation process of GD3 in DPPC is very different from GM1 and other gangliosides such as GT1b (Luckham et al., 1993). In particular, thermodynamic analysis clearly indicates that individual GD3 molecules are mixed with DPPC molecules, starting at very low GD3 molar fractions. This evidence is supported by the gradual variation of the collapse pressure in the isotherms of the mixed films between the values of the pure films; by the results of both “partial molecular area analysis” and “partial potential analysis”; and by the excess free energy ΔG values, always negative with a strong minimum located at X = 0.4.
The sign of ΔG suggests that a strong molecular interaction in the mixture is energetically favored around X = 0.4, compared to a mixture in which no interactions are assumed to take place. This interaction can be interpreted following the structural model proposed by Maggio et al. (1997) which gives rise to LC mixed GD3/DPPC phases characterized by height greater than the plain LC DPPC phases. This hypothesis has been experimentally verified in this article by accurate height AFM measurements.
Finally, the morphology of such GD3/DPPC LC-phases was investigated in this article. Interestingly, our morphological data fit well with the mathematical model proposed by McConnell (1991), based on the assumption that shape and size of the domains are determined by competition between the line tension at the domain boundary and the electrostatic dipolar repulsion between the molecular polar heads.
References
- Andelman, D., F. Brochard, and J. F. Joanny. 1987. Phase transitions in Langmuir monolayers of polar molecules. J. Chem. Phys. 86:3673–3681. [Google Scholar]
- Beitinger, H., V. Vogel, D. Mobius, and H. Rahmann. 1989. Surface potentials and electric dipole moments of ganglioside and phospholipid bilayers: contribution of the polar headgroup at the water/lipid interface. Biochim. Biophys. Acta. 984:293–300. [DOI] [PubMed] [Google Scholar]
- Bordi, F., F. De Luca, C. Cametti, A. Naglieri, R. Misasi, and M. Sorice. 1999. Interaction of mono- and di-sialogangliosides with phospholipids in mixed monolayers at air-water interface. Colloid Surface B. 13:135–142. [Google Scholar]
- Chattoraj, D. K., and K. S. Birdi. 1984. Adsorption and the Gibbs Surface Excess. Plenum Press, New York.
- Derry, D. M., and L. S. Wolfe. 1967. Gangliosides in isolated neurons and glial cells. Science. 158:1450–1452. [DOI] [PubMed] [Google Scholar]
- Diociaiuti, M., F. Bordi, A. Motta, A. Carosi, A. Molinari, A. Arancia, and C. Coluzza. 2002. Aggregation of gramicidin A in phospholipid Langmuir-Blodgett monolayers. Biophys. J. 82:3198–3206. [DOI] [PMC free article] [PubMed] [Google Scholar]
- Dufrene, Y. F., and G. L. Lee. 2000. Advances in the characterization of supported lipid films with the atomic force microscope. Biochim. Biophys. Acta. 1509:14–41. [DOI] [PubMed] [Google Scholar]
- Dynarowicz-Latka, P., A. Dhanabalan, and O. N. Oliveira, Jr. 2001. Modern physicochemical research on Langmuir monolayers. Adv. Colloid Interface Sci. 91:221–293. [DOI] [PubMed] [Google Scholar]
- Hong-wei, S., and H. McConnell. 1975. Phase separation in phospholipid membranes. Biochemistry. 14:847–854. [DOI] [PubMed] [Google Scholar]
- Israelachvili, J. 1992. Intermolecular and Surface Forces, 2nd ed. Academic Press, London.
- Jass, J., T. Tjarnhage, and G. Puu. 2000. From liposomes to supported, planar bilayer structures on hydrophilic and hydrophobic surfaces: an atomic force microscopy study. Biophys. J. 79:3153–3163. [DOI] [PMC free article] [PubMed] [Google Scholar]
- Jacobson, K., and C. Dietrich. 1999. Looking at lipid rafts? Trends Cell Biol. 9:87–91. [DOI] [PubMed] [Google Scholar]
- Kasahara, K., and Y. Sanai. 1999. Possible roles of glycosphingolipids in lipid rafts. Biophys. Chem. 82:121–127. [DOI] [PubMed] [Google Scholar]
- Keller, S. L., and H. M. McConnell. 1999. Stripe phases in lipid monolayers near a miscibility critical point. Phys. Rev. Lett. 82:1602–1605. [Google Scholar]
- Luckham, P., J. Wood, S. Froggatt, and R. Swart. 1993. The surface properties of gangliosides. I. Monolayer properties. J. Colloid Interface Sci. 156:164–172. [Google Scholar]
- Maggio, B., T. Ariga, R. O. Calderon, and R. K. Yu. 1997. Ganglioside GD3 and GD3-lactone mediated regulation of the intermolecular organization in mixed monolayers with dipalmitoylphosphatidylcholine. Chem. Phys. Lipids. 90:1–10. [DOI] [PubMed] [Google Scholar]
- McConnell, H. M. 1991. Structures and transitions in lipid monolayers at the air-water interface. Annu. Rev. Phys. Chem. 42:171–195. [Google Scholar]
- Nakano, J., B. K. Raj, C. Asagami, and K. O. Lloyd. 1996. Human melanoma cell lines deficient in GD3 ganglioside expression exhibit altered growth and tumorigenic characteristics. J. Invest. Dermatol. 107:543–548. [DOI] [PubMed] [Google Scholar]
- Nakano, J., H. Yasui, K. O. Lloyd, and M. Muto. 1999. Biological roles of gangliosides G(M3) and G(D3) in the attachment of human melanoma cell to extracellular matrix proteins. J. Investig. Dermatol. Symp. Proc. 4:173–176. [DOI] [PubMed] [Google Scholar]
- Reviakine, I., and A. Brisson. 2000. Formation of supported phospholipid bilayers from unilamellar vesicles investigated by atomic force microscopy. Langmuir. 16:1806–1815. [Google Scholar]
- Rinia, H. A., M. M. Snel, J. P. van der Eerden, and B. de Kruijff. 2001. Visualizing detergent resistant domains in model membranes with atomic force microscopy. FEBS Lett. 501:92–96. [DOI] [PubMed] [Google Scholar]
- Roberts, G. 1990. Langmuir-Blodgett Films. Plenum Press, New York.
- Ruiz, M. J., and M. A. Vìlchez. 1991. A study of the miscibility of bile components in mixed monolayers at the air-liquid interface. I. Cholesterol, lecithin, and lithocholic acid. Colloid Polym. Sci. 269:77–84. [Google Scholar]
- Seyfried, T. N., and R. K. Yu. 1985. Ganglioside GD3: structure, cellular distribution, and possible function. Mol. Cell. Biochem. 68:3–10. [DOI] [PubMed] [Google Scholar]
- Simons, K., and E. Ikonen. 1997. Functional rafts in cell membranes. Nature. 387:569–572. [DOI] [PubMed] [Google Scholar]
- Simons, K., and D. Toomre. 2000. Functional rafts and signal transduction. Nat. Rev. Mol. Cell Biol. 1:31–39. [DOI] [PubMed] [Google Scholar]
- Singer, S. J., and G. L. Nicolson. 1972. The fluid mosaic model of the structure of cell membranes. Science. 175:720–731. [DOI] [PubMed] [Google Scholar]
- Taylor, D. M. 2000. Developments in the theoretical modelling and experimental measurement of the surface potential of condensed monolayers. Adv. Colloid Interface Sci. 87:183–203. [DOI] [PubMed] [Google Scholar]
- Vié, V., N. Van Mau, E. Lesniewska, J. P. Goudonnet, F. Heitz, and C. Le Grimellec. 1998. Distribution of ganglioside GM1 between two-component, two-phase phosphatidylcholine monolayers. Langmuir. 14:4574–4583. [Google Scholar]
- Vyas, K. A., H. V. Patel, A. A. Vyas, and R. L. Schnaar. 2001. Segregation of gangliosides GM1 and GD3 on cell membranes, isolated membrane rafts, and defined supported lipid monolayers. Biol. Chem. 328:241–250. [DOI] [PubMed] [Google Scholar]
- Yuan, C., J. Furlog, P. Burgos, and L. J. Johnston. 2002. The size of rafts: an atomic force microscopy study of ganglioside GM1 domains in sphingomyelin/DOPC/cholesterol membranes. Biophys. J. 82:2526–2535. [DOI] [PMC free article] [PubMed] [Google Scholar]
- Yuan, C., and L. J. Johnston. 2000. Distribution of ganglioside GM1 in L-alpha-dipalmitoylphosphatidylcholine/cholesterol monolayers: a model for lipid rafts. Biophys. J. 79:2768–2781. [DOI] [PMC free article] [PubMed] [Google Scholar]
- Yuan, C., and L. J. Johnston. 2001. Atomic force microscopy studies of ganglioside GM1 domains in phosphatidylcholine and phosphatidylcholine/cholesterol bilayers. Biophys. J. 81:1059–1069. [DOI] [PMC free article] [PubMed] [Google Scholar]