Abstract
High-resolution structure determination of soluble globular proteins relies heavily on x-ray crystallography techniques. Such an approach is often ineffective for investigations into the structure of fibrous proteins as these proteins generally do not crystallize. Thus investigations into fibrous protein structure have relied on less direct methods such as x-ray fiber diffraction and circular dichroism. Ultraviolet linear dichroism has the potential to provide additional information on the structure of such biomolecular systems. However, existing systems are not optimized for the requirements of fibrous proteins. We have designed and built a low-volume (200 μL), low-wavelength (down to 180 nm), low-pathlength (100 μm), high-alignment flow-alignment system (couette) to perform ultraviolet linear dichroism studies on the fibers formed by a range of biomolecules. The apparatus has been tested using a number of proteins for which longer wavelength linear dichroism spectra had already been measured. The new couette cell has also been used to obtain data on two medically important protein fibers, the all-β-sheet amyloid fibers of the Alzheimer's derived protein Aβ and the long-chain assemblies of α1-antitrypsin polymers.
INTRODUCTION
Proteins are classified by their structural characteristics to be either globular, membrane bound, or fibrous. Globular proteins are usually highly aqueous soluble whereas membrane proteins are lipid soluble. They provide the majority of the enzymatic, regulatory, and signaling machinery required to maintain a cell. Fibrous proteins in general behave as structural elements both within cells forming the cytoskeleton or in the extracellular environment such as the basement membrane. Fibrous proteins have a range of mechanical properties tailored to their function. Collagen, for example, has, weight for weight, a tensile strength that exceeds that of steel. It is found in connective tissue where such strength is required to maintain tissue integrity under extreme loads (Fratzl et al., 1998; Prockop and Fertala, 1998). The high tensile strength of silk is used by insects for tasks as diverse as catching prey to protection of larval forms. Actin (Otterbein et al., 2001) and myosin, by way of contrast, combine in muscle fibers and perform complex ratchet-like conformational changes that underlie muscle contractions. (Geeves and Holmes, 1999). All these proteins have amino acid sequences that have evolved to form fibers of the correct characteristics. However, in some cases, normally soluble, globular proteins undergo considerable conformational change and polymerize to form β-sheet dominated fibrils. These fibrils are deposited in the tissues leading to diseases collectively known as amyloidoses. Each disease is characterized by protein being deposited as amyloid fibrils. At least 20 different proteins are associated with deposition of such β-sheet fibrils. These include Aβ in Alzheimer's disease, islet amyloid polypeptide in some Type 2 diabetes patients, and prion in the transmissible spongiform encephalopathies. Parkinson's disease and Huntington's disease also involve the deposition of β-sheet fibrils intracellularly. The proteins that form amyloid fibrils do not share any similarities in their native nonfibrillar structure, sequence, or function. Proteins as diverse as lysozyme, immunoglobulin light chain, and apolipoprotein A1 form fibrils in diseased states. The amyloid fibrils formed, however, share morphology and a common core structure (Sunde et al., 1997).
Fibrous proteins constitute the major portion of biomass in the natural world. However, our understanding of the conformations of the polypeptide chains that make up these fibers is limited. This is particularly apparent when compared to our knowledge of globular proteins. It is usually not possible to study the structure of fibrous proteins with conventional techniques used for globular proteins such as single crystal x-ray crystallography or NMR, since fibers are often both insoluble and heterogeneous in length. Instead, electron microscopy (EM) and x-ray fiber diffraction have been utilized to examine the morphology and appearance of the fibers, as well as any repeating structure.
In some cases it has been possible to combine the crystallographic information from a soluble form of a fiber-forming protein with fiber diffraction from a fibrous form (e.g., (Holmes et al., 1990; Rayment et al., 1993) to deduce structural information. The secondary structural elements making up fibers have also been probed using circular dichroism (CD), Fourier transform infrared spectroscopy and solid state NMR. To build up a model of the fibrous protein being studied, several of these techniques are often combined to give information on the spacing of individual elements within the fiber, and in some cases they can be combined to gain medium resolution structural information. As the structural study of protein fibers cannot rely on one technique to provide a complete description of the structure, it is all the more important to continue developing new techniques that give unique information on the fibers' construction.
One technique that has the potential to provide information on the structural arrangement of secondary structural elements within the fiber that is not obtainable by the methods so far mentioned is ultraviolet (UV) flow-oriented linear dichroism (LD). The LD signal is produced by measuring the difference in absorbance of linearly polarized light parallel and perpendicular to an orientation direction. LD signals can be positive and negative, positive signals being for transitions whose polarization is along the direction of orientation and negative for those perpendicular to it. These measurements are usually made using a CD spectropolarimeter adapted to produce linear polarized light for LD as opposed to circularly polarized light for CD.
LD has been used extensively to examine the structure of DNA, and in this case, the signal from the π-π* transitions of the DNA bases is negative as the bases lie more perpendicular than parallel to the DNA helix axis. The use of LD to study protein structure (rather than, e.g., protein DNA complexes) has been limited to early work of Miki and Mihashi (1976), who investigated the signal of nucleotide bound to F-actin, work of Nordh and Nordén (1986) on tubulin, our work on the LD of peptide fibers (Pandya et al., 2000) and our recent work on the LD of proteins bound to liposomes. (Rodger et al., 2002a,b) The early measurements of actin and tubulin LD were restricted to the aromatic regions of the spectrum due to cell and instrument constraints. The LD of the far-UV region where one probes the amide n-π* (∼220 nm) and π-π* transitions (208 nm only for the α-helix and ∼195 nm for all motifs) has the possibility, like CD, to provide information on the backbone structure of proteins. In particular, LD has the potential to provide detailed information on the orientation of secondary structural elements with respect to the fiber axis. This information has the potential to fill an important gap in the puzzle that surrounds the structures of many fibrous proteins. This was illustrated by our previous work on the n-π* and the tail of the π-π* transitions in the peptide fibers, which confirmed that the α-helices ran parallel to the fiber axis. (Pandya et al., 2000) The potential importance of the use of linear dichroism in the study of the conformation of protein fibers has not been realized due to a number of factors including: the limited availability of couette flow cells or other effective orientation equipment; the limited wavelength range of published spectra, which imply that the backbone LD is not really accessible; and the substantial sample requirements of the previously available flow cells. However, our work on α-helical peptide fibers does show the attraction of LD as a technique to study fibers: it gives information that is not readily available by other techniques, making development of an LD cell with characteristics required by biochemistry important.
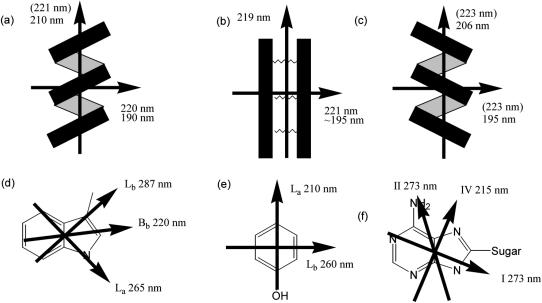
In practice the most challenging aspect of LD experiments is the fact that the molecules in the sample must be aligned. This has been achieved in the past for proteins using a range of alignment methods, including magnetic fields, stretched films, squeezed gels, and shear flow (Rodger, 1993). We chose to use couette flow as we wished to collect data to as low wavelengths as possible. We present here data on a range of protein fibers that we have obtained with our recently constructed 50 μm annular gap calcium fluoride optics couette flow cell that is illustrated in Fig. 1. To interpret the LD spectra, it is essential to have at least approximate assignments of transition polarizations. Fig. 2 summarized the approximate transition polarizations of the chromophores relevant to the systems studied in this article.
FIGURE 1.
Schematic of couette flow LD and picture of the 50 μM annual gap CaF2 couette flow cell.
FIGURE 2.
The orientations of the various polarization moments in (a) α-helix, (b) β-sheet, (c) poly proline type II, (d) tryptophan, (e) tyrosine, and (f) adenosine chromophores. Arrows indicate transition moment polarizations, and the approximate wavelength maxima of the transitions is indicated near the arrows. In some cases, the common notation for the transition is also given. Wavelengths in parentheses indicate the intensity of this transition is weak.
MATERIALS AND METHODS
Sample preparation
Actin was a gift from Dr. Mike Geeves, University of Kent, Canterbury, UK. It was prepared essentially as described by Pardee and Spudich (1982).
Human plasma α1-antitrypsin was incubated at 60°C for 3 h in 50 mM TrisHCl 100 mM KCl pH 7.6 to produce polymers (Dafforn et al., 1999; Sivasothy et al., 2000; Lomas et al., 1992). Residual monomeric α1-antitrypsin was then removed by incubation at 95°C for 1 h.
Synthetic Aβ1-42 peptides were obtained from Bachem, St. Helens, UK, and incubated for several months in water at 10 mg/mL at 4°C to produce Aβ1-42 fibrils.
Acid soluble type I collagen was dissolved initially in 100 mM acetic acid. Any insoluble residue was removed by centrifugation at 16,000 × g for 15 min. The soluble fraction was then dialyzed against 100 mM phosphate buffer at pH 7.4 for 24 h at 4°C.
Spectroscopic experiments
CD measurements were performed using either a Jasco (Tokyo, Japan) J-810 or J-715 spectropolarimeter in 50 mM phosphate buffer pH 7.4 at 20°C using a 0.05 cm pathlength quartz cuvette and averaged over five scans of response time = 1 s.
LD measurements were performed using a Jasco J-715 spectropolarimeter adapted for LD spectroscopy. Samples were placed in 50 mM phosphate buffer pH 7.4 at 20°C and aligned in the light beam using custom-made couette cells (Rodger et al., 2002a,b). The cell (Fig. 1) consists of a cylindrical cross section sleeve with a cylinder mounted centrally with respect to its circular face on a rotating spindle within the sleeve. The spindle center and the center of the circular cross section of the sleeve are aligned so the cylinder is able to rotate freely within the sleeve. The gap formed between the cylinder and the sleeve is filled with the sample, and upon rotation of the inner cylinder a shear force is induced across the sample. This configuration allows the use of smaller sample volumes (200 μl) than has previously been possible (the previous cell required 2 ml of sample). The light beam is incident radially on the cell and the ones used in this work have two windows on the outer cylinder for the light to pass through. The protein data presented in this paper were all collected with the couette flow cell described in Rodger et al. (2002b). This cell, which is illustrated in Fig. 1, was constructed by Crystal Precision Optics (Rugby, UK). The central rotating cylinder and the entry and exit windows are made of calcium fluoride. This should extend the cell wavelength further into the UV than is obtainable with quartz. Further, the annular gap between the rotating cylinder and windows (see schematic on Fig. 1) is ∼50 μm (one-tenth that of existing cells (Rodger, 1993)), which reduces the concentration of nonanalyte molecules (e.g., buffers, Cl−) in the light beam. Comparison of this cell with previous, long-pathlength cells shows that the increase in the shear force across the 50 μm annular gap compared with the 500 μm annular gap counteracts the expected Beer-Lambert loss of signal due to smaller pathlength and less sample being in the light beam (data not shown). A combination of smaller “wasted” sample volume below the windows and the smaller annular gap reduce the required sample volume by approximately an order of magnitude in the CaF2 cell, which is attractive for studies of biomacromolecules. The voltage applied to the motor that rotates the spindle and hence the CaF2 cylinder is controlled electronically to allow the sample solution to be maintained with the highest possible degree of alignment without inducing turbulent flow and Taylor vortices.
The shear rate was determined by applying the equations from Nordén et al. (1991) which are based on the work of Taylor (1963). If the inner cylinder rotates:
 |
(1) |
where ω is the angular velocity (dθ/dt) and Ri and Ro are the radii of the inner and outer cylinders respectively. This approximates to
 |
(2) |
If ω = 1000 rpm or alternatively 1000 × 2π/60 = 105 s−1; Ro = 1.5 cm, 500 μm = 0.05 cm annular gap makes G ∼ 3000 s−1.
All spectra were calculated as an average of five measurements.
RESULTS AND DISCUSSION
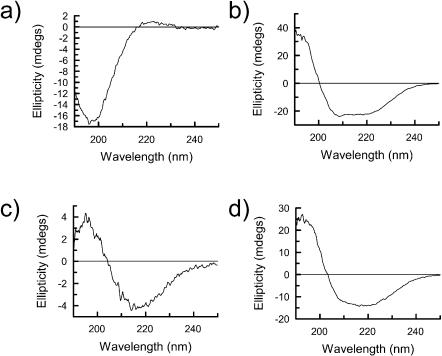
The 50 μm CaF2 couette cell was used to measure the LD spectra of four fibrous proteins: collagen type 1; actin, for which LD data exists in the literature thus allowing direct validation of the new cell against older systems; the Alzheimer's related protein Aβ1-42; and α1-antitrypsin. Before the LD spectrum of each sample was recorded, each was subjected to analysis by CD (Fig. 3). The samples were also examined using negative stain electron microscopy (data not shown). These techniques when combined are able to determine whether the sample is fibrillar and hence amenable to alignment, and also to confirm that the secondary structural content of each fiber is as expected from the literature (see Table 1).
FIGURE 3.
CD spectra of (a) collagen type I (0.75 mg/ml), (b) F-actin (0.75 mg/ml), (c) Aβ1-42 (0.32 mg/ml), and (d) α1-antitrypsin (0.72 mg/ml) in a 0.5 mm pathlength cuvette.
TABLE 1.
The secondary structure and aromatic amino acid content of a number of protein fibers
| % Secondary structure content
|
% Aromatic amino acids
|
||||||
|---|---|---|---|---|---|---|---|
| Protein | Number of residues | α-helix | β-sheet | Other | Trp | Tyr | Phe |
| Collagen type I | ∼3000 | – | – | 100* | – | 0.5 | 1.3 |
| F-actin | 337 | 17† | 18† | 65† | 1.1 | 4.2 | 3.2 |
| Aβ1-42 | 42 | – | 90* | 10* | – | 2.3 | 7.1 |
| α1-antitrypsin | 418 | 20‡ | 30‡ | 50‡ | 0.7 | 1.4 | 6.5 |
Estimated from deconvolution of CD spectra.
Calculated from analysis of x-ray crystallographic structure of monomeric actin (Protein Data Bank code: 1ATN) using DSSP (Kabsch and Sander, 1983).
Calculated from analysis of x-ray crystallographic structure of monomeric α1-antitrypsin (Protein Data Bank code: 1QLP) using DSSP (Kabsch and Sander, 1983).
Collagen
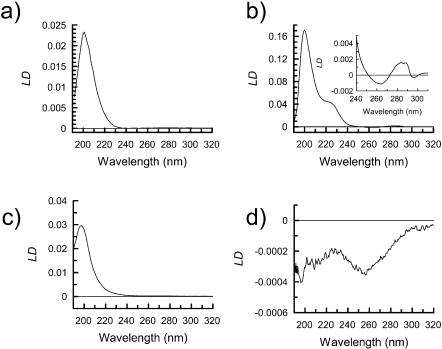
Collagen contains peptide bonds in a polyproline type II left-handed extended helix, stabilized by hydrogen bonding interactions with solvent (summarized under “Other” in Table 1) with its CD spectrum having a low intensity positive maximum at 220 nm and a much more intense negative maximum at 195 nm (Fig. 3). Collagen fibers are triple PPII helices formed by three individual collagen peptide chains; EM shows this sample to contain fibers with average diameters of ∼300 Å. The LD spectrum of these fibers (Fig. 4) shows a single positive maximum at 203 nm with a sharp decrease in signal to the low wavelength end of the spectrum, presumably due to a significant negative signal just below 190 nm. There is little LD intensity in the n-π* region at ∼220 nm, as is also the case for the polyproline II CD spectrum. The type I collagen used in this study contains a very low percentage of aromatic residues, and hence no LD signal was detectable in the aromatic region. The observed LD requires a transition polarized along the fiber axis at ∼206 nm, which is consistent with a transition along the long axis of the poly proline type II helix being aligned with the fiber axis as expected. The transition at lower wavelength is therefore perpendicular to both long axes.
FIGURE 4.
LD spectra of the backbone region of (a) collagen type I (1.2 mg/ml), (b) F-actin (0.05mg/ml) with insert of the aromatic region collected at 0.31mg/ml the concentration, (c) Aβ1-42 (0.32mg/ml), and (d) α1-antitrypsin (1.2 mg/ml) in the 50 μm CaF2 couette cell.
Actin
The LD signal from proteins, as with CD spectra, can be split into two regions with respect to wavelength and the chromophores present. The near UV region (250 nm–350 nm) contains signals from the aromatic side-chain chromophores, phenylalanine, tyrosine, and tryptophan, as well as certain bound coenzymes such as ATP. The far UV region (250 nm–160 nm) is dominated by backbone chromophores. Actin is a good test sample as it contains a mixture of secondary structural elements as well as a bound cofactor, ATP. The CD spectrum (Fig. 3) of actin was consistent with the presence of both of α- and β-structures. As a result of this, we would expect its LD spectrum to be a sum of the component parts. The measured spectrum for F-actin (Fig. 4) has a significant 220 nm positive LD signal, a negative signal at 210 nm (overlaid by a positive background scattering signal), and a positive maximum at ∼200 nm. This requires the average α-helix to be perpendicular to the fiber axis. The 200 nm signal is a combination of the α-helices and β-sheets. With computational theoretical work analogous to the CD calculations of Besley and Hirst (1999) using the matrix method approach (Bayley et al., 1969), it would be possible to determine both the average α-helix and β-sheet orientations.
The significant number of aromatic residues in F-actin (F actin: 1.1% Trp, 3.2% Phe, 4.2% Tyr) as well as the bound ADP (1 molecule per actin subunit), all have the potential to produce an LD signal in the “aromatic region”. The LD spectrum for F-actin, shown as an inset in Fig. 4 b, has significant features in the aromatic region between 250 and 300 nm in accord with the literature (Miki and Mihashi, 1976). The two positive maximum at 285 and 290 nm are due to the ADP (all polymerized actin should have ADP bound; nonpolymerized is probably ATP), which must be oriented with its plane more parallel than perpendicular to the fiber axis, whereas the 295 nm and 265 nm negative maxima correspond to the tryptophans on average being more perpendicular to the fiber axis.
Actin polymerization monitored by LD
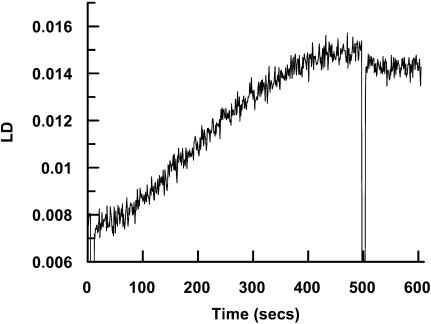
The observation of a significant LD signal for F-actin at 205 nm in the 50 μm CaF2 LD cell allowed us to follow the polymerization of actin. G-actin polymerization was triggered by the addition of KCl (100 mM) and MgCl2 (2 mM). The kinetics plot obtained (Fig. 5) shows an increase in LD signal over a period of 500 s that conformed to initial lag followed by an increase to saturation. This sort of trace is consistent with those observed by other methods (Millonig et al., 1988; Nishida and Sakai, 1983), and shows the potential of LD for probing fiber formation kinetics—the real advantage of LD being that it only gives a signal for the fibers.
FIGURE 5.
Polymerization of actin (0.3 mg/ml) followed by monitoring the LD signal at 205 nm for 500 s. Polymerization was induced by addition of KCl and MgCl2 to a concentration of 100 mM and 2 mM, respectively, at t = 0 s. At t = 500 s, an excess of KCl and MgCl2 was added (with resulting dilution of the actin and hence immediate decrease of the LD signal) to ensure that the reaction had gone to completion.
Aβ1-24 and α1-antitrypsin
Collagen and actin represent protein fibers that are present in high abundance in biological systems. For example, collagen is thought to be the most abundant animal protein in the biosphere. The new cell design opens the application of LD to much less abundant proteins. Two such proteins are the Alzheimer's-related protein Aβ1-42 and the α1-antitrypsin fiber. Both these proteins have significant importance in the mechanism of disease progression. Aβ1-42 is the major component of the Alzheimer's plaques that form in the brain and is thought to be a causative agent of this form of dementia. The α1-antitrypsin polymer is the archetypical example of a serpin polymer, and its formation in the liver is a major cause of cirrhosis as well as emphysema. Serpin fibers have also been implicated in a range of other conditions including thrombosis, angioedema (Aulak et al., 1993) and dementia (Davis et al., 1999). Both these proteins are difficult to produce, and the quantities required for LD have in the past precluded their study.
A CD spectrum of Aβ1-42 shows a classical β-sheet CD spectrum (Fig. 3) with a negative maximum at 216 nm and a positive maximum at 197 nm. This is in agreement with previous structural studies (Serpell, 2000) that show that these fibers contain predominantly β-structure. Visualization of the samples by EM shows the presence of ordered fibers with an average width of 80 Å. Amyloid fibers typically have a cross β-x-ray fiber diffraction pattern that indicates the β strands run perpendicular to the fiber axis.
The LD spectrum of Aβ1-42 (Fig. 4) is dominated by a single strong positive maximum at ∼205 nm with very low signal intensity in the n-π* region of the spectrum (220 nm) that may be due exclusively to background scattering. No evidence for an LD signal within the aromatic region (250–300 nm) was observed despite almost 10% of residues within the Aβ1-42 being either tyrosines or phenylalanines. This indicates that the conformations of the aromatic residues are either not ordered with respect to the β-sheet structure or average to close to the magic angle of 54.7° (Rodger and Nordén, 1997), information that had not previously been available.
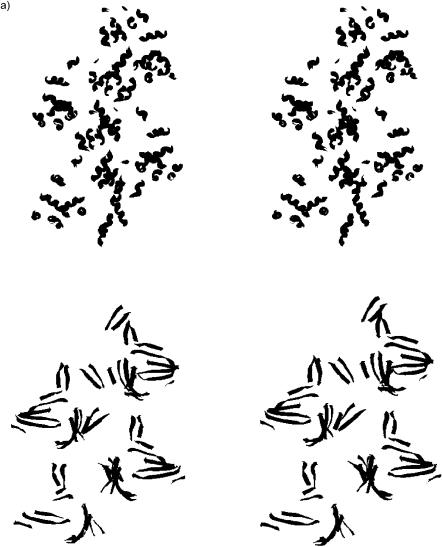
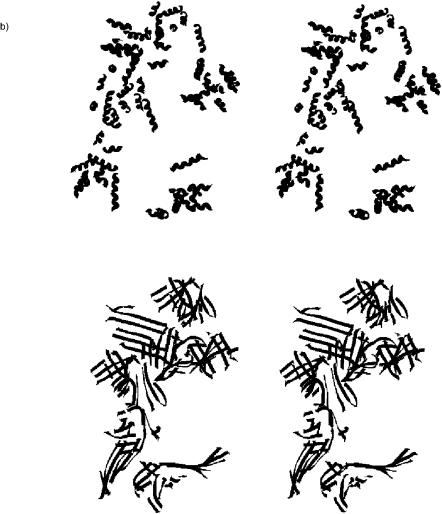
X-ray crystal structures of the monomeric form of α1-antitrypsin show it to have a mixed α/β-structure; this is confirmed to be the case in the polymeric form by observation of an α/β-CD spectrum (Fig. 3). The corresponding LD spectrum (Fig. 4) shows a negative signal at 220 nm and below. The spectrum is qualitatively similar in the backbone region but opposite in sign from that of F-actin, which is also a mixed α/β-protein. The signal-to-noise is much worse, suggesting shorter or less rigid fibers have been formed; this is confirmed by EM studies of the polymers that show them to take the form of “beads on a string” rather than the rigid rods of actin. The schematics of Fig. 6 indicating the orientations of the α-helices and β-strands in these two proteins are consistent with these opposite spectra. In both cases, the β-strands are a mix of orientations. The near UV part of the LD spectrum of α1-antitrypsin shows a single negative minima at 258 nm, which is likely to correspond to the relatively high proportion of phenylalanines (α1-antitrypsin: 0.7% Trp, 6.5% Phe, 1.4% Tyr) in the protein being well-aligned with respect to one another so that the short axis of the phenol group is perpendicular to the fiber axis.
FIGURE 6.
Stereo diagrams of positions of secondary structure motifs in (a) F-actin and (b) α-antitrypsin fibers. In each case, the coils of the top schematic show α-helices and the ribbons of the bottom schematic show β-sheets.
CONCLUSION
The aim of this study was to show that LD could be used to study expensive biological samples of protein fibers and to show it could be used to aid structural characterization of fibers. The important aspects of lower wavelength range, reduced sample volume, higher optical efficiency, and improved alignment have been achieved in the 50 μm CaF2 couette flow cell. The reduced pathlength of this cell proved to be advantageous to the LD signal due to increased alignment and also reduced absorbance of nonaligned sample components. This has the further advantage that higher protein concentrations can be used in the cell, a factor that can be important in initiation of certain protein oligomerization reactions. Measurement of the LD spectrum of actin showed that our data were consistent with that in the literature and that the cell behaved in a similar manner to those built previously. However, the shortened pathlength enabled collection of data to significantly lower wavelengths. This has implications for the utility of LD for conformational analysis, as significantly more information on secondary structural content is available in the low wavelength regions. The use of the new cell to collect data for two other proteins that are expensive to produce justifies the design of the new cell. In particular, the poor signal-to-noise observed for the α1-antitrypsin sample would have prevented any information on the structure of the fiber from being obtained in the old long pathlength cell even if enough material could be obtained for such a study.
Some general structure/LD rules can be summarized from our data:
Circular dichroism gives a useful handle on the percentages of secondary structure motifs in the fiber.
The aromatic region is useful if there is a detectable signal, and where different chromophores have different absorbance wavelengths it should be possible to analyze the data quantitatively to determine their relative orientations. A matrix method-type approach would be most useful (Bayley et al., 1969; Besley and Hirst, 1999).
The 220 nm LD is only significant for α-helices, and a negative signal means the average α-helix orientation is more parallel than perpendicular to the fiber axis.
For the α-helix, a dip in the spectrum is usually observed at ∼210 nm with a sign opposite from the 220 nm n-π* signal. This is the long wavelength π-π* component that is unique to the α-helix. Below 200 nm, a signal of the same sign as the n-π* transition is expected (cf. Fig. 2).
The 195−200 nm region is dominated by π-π* transitions. For poly proline type II motifs, one expects a signal polarized parallel to the helix axis (which in the case of collagen is parallel to the fiber axis, so positive in sign) above 200 nm and one of the opposite sign below 200 nm.
β-sheets have one significant band at ∼200 nm. If it is positive in sign, then the peptide backbone of the β-strands are more perpendicular than parallel to the fiber axis (cf. Fig. 2).
Mixed α/β structures are dominated by the α-helix LD down to ∼210 nm. The β-sheet is probably dominant below this, leading to signals at a slightly longer wavelength than the α-helix's lower π-π* component.
Acknowledgments
T.D. is a Medical Research Council Career Development Fellow. L.S. is a Wellcome Trust Research Career Development Fellow and thanks the Laboratory of Molecular Biology (Cambridge) for the use of the electron microscope.
A.R. is funded by the Engineering and Physical Sciences Research Council (GR/M91105 and GR/R40869/01).
References
- Aulak, K. S., E. Eldering, C. E. Hack, Y. P. T. Lubbers, R. A. Harrison, A. Mast, M. Cicardi, and A. E. Davis. 1993. A hinge region mutation in C1-inhibitor (Ala(436)-]Thr) results in nonsubstrate-like behavior and in polymerization of the molecule. J. Biol. Chem. 268:18088–18094. [PubMed] [Google Scholar]
- Bayley, P. M., E. B. Nielsen, and A. Schellman. 1969. Rotatory properties of molecules containing two peptide groups: theory. J. Phys. Chem. 73:228–243. [DOI] [PubMed] [Google Scholar]
- Besley, N. A., and J. D. Hirst. 1999. Ab initio study of the of the electronic spectrum of formamide with explicit solvent. J. Am. Chem. Soc. 121:9636–9644. [Google Scholar]
- Dafforn, T. R., R. Mahadeva, P. R. Elliott, P. Sivasothy, and D. A. Lomas. 1999. A kinetic mechanism for the polymerization of alpha(1)-antitrypsin. J. Biol. Chem. 274:9548–9555. [DOI] [PubMed] [Google Scholar]
- Davis, R. L., A. E. Shrimpton, P. D. Holohan, C. Bradshaw, D. Feiglin, G. H. Collins, P. Sonderegger, J. Kinter, L. M. Becker, F. Lacbawan, D. Krasnewich, M. Muenke, D. A. Lawrence, M. S. Yerby, C. M. Shaw, D. Gooptu, P. R. Elliott, J. T. Finch, R. W. Carrell, and D. A. Lomas. 1999. Familial dementia caused by polymerization of mutant neuroserpin. Nature. 401:376–379. [DOI] [PubMed] [Google Scholar]
- Fratzl, P., K. Misof, I. Zizak, G. Rapp, H. Amenitsch, and S. Bernstorff. 1998. Fibrillar structure and mechanical properties of collagen. J. Struct. Biol. 122:119–122. [DOI] [PubMed] [Google Scholar]
- Geeves, M. A., and K. C. Holmes. 1999. Structural mechanism of muscle contraction. Annu. Rev. Biochem. 68:687–728. [DOI] [PubMed] [Google Scholar]
- Holmes, K. C., D. Popp, W. Gebhard, and W. Kabsch. 1990. Atomic model of the actin filament. Nature. 347:44–49. [DOI] [PubMed] [Google Scholar]
- Kabsch, W., and C. Sander. 1983. Dictionary of protein secondary structure: pattern recognition of hydrogen-bonded and geometrical features. Biopolymers. 22:2577–2637. [DOI] [PubMed] [Google Scholar]
- Lomas, D. A., D. L. Evans, J. T. Finch, and R. W. Carrell. 1992. The mechanism of Z alpha 1-antitrypsin accumulation in the liver. Nature. 357:605–607. [DOI] [PubMed] [Google Scholar]
- Miki, M., and K. Mihashi. 1976. Fluorescence and flow dichroism of F-actin-epsilon-ADP; the orientation of the admine plane relative to the long axis of F-actin. Biophys. Chem. 6:101–106. [DOI] [PubMed] [Google Scholar]
- Millonig, R., H. Salvo, and U. Aebi. 1988. Probing actin polymerization by intermolecular cross-linking. J. Cell Biol. 106:785–796. [DOI] [PMC free article] [PubMed] [Google Scholar]
- Nishida, E., and H. Sakai. 1983. Kinetic analysis of actin polymerization. J. Biochem. 93:1011–1020. [DOI] [PubMed] [Google Scholar]
- Norden, B., C. Elvingson, M. Jonsson, and B. Akerman. 1991. Microscopic behaviour of DNA during electrophoresis: electrophoretic orientation. Q. Rev. Biophys. 24:103–164. [DOI] [PubMed] [Google Scholar]
- Nordh, J. D. J., and B. Nordén. 1986. Flow orientation of brain microtubules studied by linear dichroism. Eur. Biophys J. 14:113–122. [DOI] [PubMed] [Google Scholar]
- Otterbein, L. R., P. Graceffa, and R. Dominguez. 2001. The crystal structure of uncomplexed actin in the ADP state. Science. 293:708–711. [DOI] [PubMed] [Google Scholar]
- Pandya, G. S., M. Sunde, J. R. Thorne, A. Rodger, and D. N. Woolfson. 2000. Sticky-end assembly of a designed peptide fiber provides insight into protein fibrillogenesis. Biochemistry. 39:8728–8734. [DOI] [PubMed] [Google Scholar]
- Pardee, J. D., and J. A. Spudich. 1982. Purification of muscle actin. Methods Cell Biol. 24:271–289. [DOI] [PubMed] [Google Scholar]
- Prockop, D. J., and A. Fertala. 1998. The collagen fibril: the almost crystalline structure. J. Struct. Biol. 122:111–118. [DOI] [PubMed] [Google Scholar]
- Rayment, I., H. M. Holden, M. Whittaker, C. B. Yohn, M. Lorenz, K. C. Holmes, and R. A. Milligan. 1993. Structure of the actin-myosin complex and its implications for muscle contraction. Science. 261:58–65. [DOI] [PubMed] [Google Scholar]
- Rodger, A. 1993. Linear dichroism. Methods Enzymol. 226:232–258. [DOI] [PubMed] [Google Scholar]
- Rodger, A., and B. Nordén. 1997. Circular Dichroism and Linear Dichroism. Oxford University Press, Oxford.
- Rodger, A., J. Rajendra, R. Marrington, M. Ardhammar, B. Nordén, J. D. Hirst, A. T. B Gilbert, T. R. Dafforn, D. J. Halsall, C. A. Woolhead, C. Robinson, T. J. Pinheiro, J. Kazlauskaite, M. Seymour, N. Perez, and M. J. Hannon. 2002a. Flow oriented linear dichroism to probe protein orientation in membrane environments. Phys. Chem. Chem. Phys. 4:4051–4057. [Google Scholar]
- Rodger, A., J. Rajendra, R. Marrington, R. Mortimer, T. Andrews, J. B. Hirst, A. T. B. Gilbert, R. Marrington, D. Halsall, T. R. Dafforn, M. Ardhammar, B. Nordén, C. A. Woolhead, C. Robinson, T. Pinheiro, J. Kazlauskaite, M. Seymour, N. Perez, and M. J. Hannon. 2002b. Flow oriented linear dichroism to probe protein orientation in membrane environments. In Biophysical Chemistry: Membranes and Proteins. R. H. Templer, R. Leat, R. J. Leatherbarrow, editors. Royal Society of Chemistry, Cambridge. 3–19.
- Serpell, L. C. 2000. Alzheimer's amyloid fibrils: structure and assembly. Biochim. Biophys. Acta. 1502:16–30. [DOI] [PubMed] [Google Scholar]
- Sivasothy, P., T. R. Dafforn, P. G. W. Gettins, and D. A. Lomas. 2000. Pathogenic alpha(1)-antitrypsin polymers are formed by reactive loop-beta-sheet A linkage. J. Biol. Chem. 275:33663–33668. [DOI] [PubMed] [Google Scholar]
- Sunde, M., L. C. Serpell, M. Bartlam, P. E. Fraser, M. B. Pepys, and C. C. Blake. 1997. Common core structure of amyloid fibrils by synchrotron X-ray diffraction. J. Mol. Biol. 273:729–739. [DOI] [PubMed] [Google Scholar]
- Taylor, E., and W. Cramer. 1963. Birefringence of protein solutions and biological systems. Biophys. J. 3:127–141. [DOI] [PMC free article] [PubMed] [Google Scholar]


