Abstract
A new method for visualizing vibrating structures is described. The system provides a means to capture very fast repeating events by relatively minor modifications to a standard confocal microscope. An acousto-optic modulator was inserted in the beam path, generating brief pulses of laser light. Images were formed by summing consecutive frames until every pixel of the resulting image had been exposed to a laser pulse. Images were analyzed using a new method for optical flow computation; it was validated through introducing artificial displacements in confocal images. Displacements in the range of 0.8 to 4 pixels were measured with 5% error or better. The lower limit for reliable motion detection was 20% of the pixel size. These methods were used for investigating the motion pattern of the vibrating hearing organ. In contrast to standard theory, we show that the organ of Corti possesses several degrees of freedom during sound-evoked vibration. Outer hair cells showed motion indicative of deformation. After acoustic overstimulation, supporting cells contracted. This slowly developing structural change was visualized during simultaneous intense sound stimulation and its speed measured with the optical flow technique.
INTRODUCTION
Rapid cellular motion in the inner ear has fundamental importance for detecting sound. Such motion causes deflection of stereocilia, gating of mechanically sensitive ion channels, and consequently, alterations in the firing rate of the auditory nerve. Standard theory states that cellular structures in the organ of Corti move in unison as a rigid body, around a hinge point located at the attachment of the basilar membrane to the bony core of the cochlea (ter Kuile, 1900; Rhode and Geisler, 1967; Hemmert et al., 2000). This theory has been challenged by the discovery that outer hair cells are capable of very fast motility (Brownell et al., 1985; Frank et al., 1999). Available evidence favors the hypothesis that such cellular motility amplifies vibration within the hearing organ (for reviews, see Ulfendahl, 1997; Robles and Ruggero, 2001). This creates the paradox that outer hair cells undergo rapid length changes despite being embedded in a relatively stiff structure that may not permit such motion. Resolving this apparent contradiction requires studies of the two-dimensional motion pattern of inner ear structures—an endeavor fraught by significant methodological problems. This article describes a new method for two-dimensional vibration measurements, based on confocal microscopy. By using pulsed illumination locked to a specific phase of the sound stimulus, image distortion was eliminated. To extract relevant information from image sequences showing subtle, often subpixel displacements, a new method for computation of optical flow patterns was designed. Abbreviated descriptions of these methods have recently been published (Fridberger and Boutet de Monvel, 2003; Fridberger et al., 2002).
METHODS
Basic premises
A Bio-Rad MRC 1024 confocal microscope (Bio-Rad, Hemel Hempstead, UK) served as the starting point for the development of the imaging system. When using pulsed illumination instead of the normal continuous wave laser included with the microscope, a relatively small number of pixels in each frame were exposed to laser light and consequently, images were formed by adding several sequential frames. This placed high demands on the signal/noise ratio of the acquisition system. A practical way of dealing with this problem, for the low photon fluxes found in our experiments, was to use photon counting. This resulted in a large improvement of the signal/noise ratio (Art, 1995).
Implementation
In principle, pulsed illumination may be accomplished either through the use of external modulation of a continuous wave laser or through the use of a laser with pulsed output. The laser wavelength should match the absorption spectra of commonly used fluorophores. This precluded the use of diode lasers since these lasers emit light at wavelengths where many physiologically interesting dyes are not effectively excited. Second, it was desirable to be able to vary both the pulse width and repetition rate. This excluded pulsed Nd:YAG and dye lasers since they typically have fixed pulse widths and repetition rates.
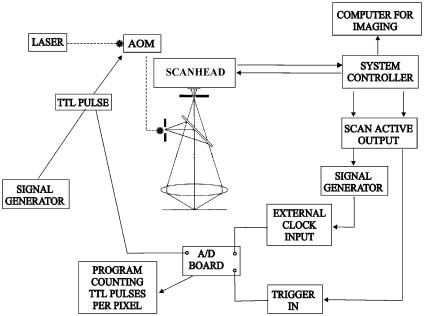
The technique that seemed capable of fulfilling all of the above demands was to use external modulation of the 15 mW Kr/Ar laser originally delivered with the confocal microscope. This was accomplished by an acousto-optic modulator (model M080-1B-GH2, Gooch and Housego Ltd., Ilminster, UK, 80-MHz driving frequency), that functioned as a very fast shutter that received the light from the Kr/Ar laser and, depending on the status of a transistor-transistor-logic (TTL) control signal, the beam was either stopped or sent to a single mode polarization-preserving optical fiber. The collimated output of the optical fiber was coupled into the scan head of the confocal microscope, allowing its illumination to be managed by the TTL signal that controlled the acousto-optic modulator (AOM).
Since this imaging mode meant that each pixel would receive an unknown number of pulses, a system for counting the number of pulses in each pixel of the final image was developed. Using a Keithley Metrabyte DAS 1802ST analog-to-digital (A/D) board in a standard Pentium II computer, the TTL pulses controlling the AOM were sampled into a two-dimensional array with dimensions equal to that of the confocal image. Sampling was controlled by custom software running under the freeware 32-bit data acquisition program Viewdac (version 2.2, Keithley Metrabyte Inc., Cleveland, OH; these programs could be implemented on any data acquisition system capable of 330 kHz sampling and calculations involving large multidimensional arrays).
TTL pulses from the system controller of the confocal microscope triggered the A/D board, to ensure synchronization with the pixels of the image. No logic output corresponding to each pixel in the image was available. Instead, we used the “scan active” signal from the system controller. This TTL signal went to logic zero 12 μs before acquisition of the first pixel in each line of the image; it was used to trigger a Hewlett-Packard 33120A function generator outputting a burst of TTL pulses. TTL pulses within the burst were synchronized with the pixels in each line of the confocal image, and used as an external clock for the A/D board. Since the A/D board had a maximum sample frequency of 333 kHz, the number of pixels per line was limited to 400. Synchronization between the A/D board and the confocal image was confirmed by imaging test samples as described below. The array containing the pulse counts was saved to disk and subsequently used in further processing by dividing each image with the corresponding array. This enabled comparison of fluorescence levels between different images and different regions of the same image. A schematic diagram of the system is given in Fig. 1.
FIGURE 1.
Schematic overview of the system. The acousto-optic modulator (AOM) acts as a rapid shutter that creates laser pulses with arbitrary length. An analog-to-digital (A/D) board controlled by timing signals from the confocal microscope's system controller sampled AOM control pulses. The signal generator that controlled the AOM was triggered by the stimulus generation equipment used during the experiments.
Test samples
Initial tests of system performance were carried out using a test target consisting of fluorescent cellulose fibers attached to a glass substrate. After completion of this initial test phase, biological specimens were used. A preparation of the Guinea pig inner ear, maintained for up to 4 h in vitro through the perfusion of oxygenated tissue culture medium, was used. A detailed description of this preparation can be found elsewhere (Ulfendahl et al., 1996; Fridberger et al., 1998). In brief, the temporal bone of young Guinea pigs was removed after decapitation of the animal. The temporal bone was attached to a custom holder, the bulla opened, and a small opening made in the apical turn to permit viewing of the cochlear structures (using a Zeiss 40×, NA 0.75 water immersion lens). The cochlear structures were imaged through Reissner's membrane, which was intact. This ensured that the ionic environment of the scala media was not disturbed by influx of tissue culture medium. A second hole was gently opened in the basal turn and a piece of plastic tubing inserted. Oxygenated tissue culture medium (Minimum Essential Medium, Life Technologies, Paisley, Scotland) flowed continuously through this tubing and exited through the apical opening. Since large scala tympani DC pressures can suppress the vibration of the cochlear partition (Fridberger et al., 1997), we used the minimum perfusion pressure that still ensured a stable flow rate. At such low perfusion rates, the vibration of the cochlear partition is not affected. To visualize the cochlear structures, the fluorescent dyes RH414 and calcein/AM (Molecular Probes, Leiden, the Netherlands) were loaded into the cells of the organ via the perfusion system. The purpose of using RH414 was to label membranes rather than to measure the membrane potential. The 488-nm line of the Kr/Ar laser excited both of the above dyes. Since the fluorescence levels were relatively low, the combined emission from the two dyes was directed to a single photomultiplier after passing a longpass filter with a cutoff of 515 nm. The middle ear ossicles and tympanic membrane remained intact, so sound stimulation could be applied to the preparation through a loudspeaker connected to the external ear canal. The preparation was immersed in tissue culture medium. This facilitated imaging and permitted oxygen delivery through gentle bubbling of the surrounding fluid. However, the immersion caused attenuation of the sound stimulus due to fluid loading on one side of the tympanic membrane. The opening of the apical turn may cause additional attenuation. The combined attenuation has been estimated to be on the order of 20 to 30 dB (Franke et al., 1992), although precise measurements are difficult. To “freeze” the motion of the cochlear structures, laser pulses were phaselocked to the sound stimulus.
Computational methods
Image sequences from the inner ear generated by the system described above showed subtle structural alterations that were difficult to quantify using simple methods. To assess these motion patterns in a quantitative and reliable way, we used an optical flow computation technique as described below. Another issue was to reduce the level of random noise present in the images. This level was usually significant, the amount of light received by each pixel being limited both in space (through the confocal aperture of the microscope) and time (due to the pulsed-illumination). We dealt with this problem by applying the wavelet denoising technique to the image sequences (Boutet de Monvel et al., 2001). The optical flow computation and all further processing were then performed on the denoised images.
Optical flow computation
The basis of all differential techniques for optical flow computation is the use of a brightness constancy constraint equation (Horn and Schunck, 1981), relating the image motion v (x, t) = (v1(x, t), v2(x, t)) at each position x = (x1, x2) and time t, to the spatial and temporal gradients of the image sequence It(x),
 |
(1) |
where ∂t = ∂/∂t, ∂i =∂/∂xi, i = 1,2. This equation expresses the assumption that the intensity of a given structure remains constant along its trajectory. In practice, noise will always influence the measured pixel values. Consequently, this assumption can only be approximately true for any physically realizable system. Nonetheless, the approximation was found to be good enough to allow reliable motion estimation even under conditions with noise more severe than that typically found in our image sequences (see results). The assumption holds for all positions and times of the sequence, but it determines only the component of v(x,t) along the spatial gradient ∇It. No information on the component perpendicular to ∇It can be deduced from Eq. 1 alone. This is the so-called aperture problem. To overcome this problem, we follow the approach of Bernard (2001), filtering the image sequence with a discrete wavelet transform (DWT) before the optical flow estimation.
Different filtered versions of the image sequence will have nearly the same motion, but different gradients, allowing one to a large extent to avoid the aperture problem (see below). The transform we use here is a nondecimated real DWT. We provide only a short account of this DWT, referring to Boutet de Monvel et al. (2001) for more details.
For each scale j of the transform, the frame It at time t is convolved with four filters (for a two-dimensional sequence), i.e., a low-pass scaling filter φj, and three high-pass wavelet filters ψj,1, ψj,2, ψj,3, as
 |
(2) |
The filters φj and ψj,a have a pixel size proportional to 2j, and they are constructed so that Eq. 2 can be inverted (cf. Eq. 9 in Boutet de Monvel et al., 2001). This is an important property, as it ensures that no information is lost when passing from the original sequence It to the filtered sequence {Ij,t, wj,a,t}.
In a second step, we apply a discretized version of Eq. 1 to each of the components Ij,t and wj,a,t. To this end we approximate the temporal and spatial derivatives of the image sequence by simple and central differences, respectively: ∂t It ≈ δt It and ∇It ≈ (δ1 It, δ2 It) where δt It = It+1 − It, δ1 It (x1, x2) = (It(x1 + 1,x2) − It(x1 − 1, x2))/2, and δ2 It (x1, x2) = (It(x1, x2 + 1) − It(x1, x2 − 1))/2. We therefore obtain a system of linear equations of the form
 |
(3) |
Formally, this is an overdetermined system for the two components of v. In effect, the different wavelet filters applied to the image sequence are sensitive to independent local features of the motion pattern. This ensures that applying the constraint Eq. 1 to the filtered sequences does not lead to several times the same equation, or in other words, that the above linear system is not singular. This is the way the present approach deals with the aperture problem. To solve Eq. 3, we use standard least-squares inversion. More explicitly, we form the following 2 × 2-matrix M and 2-vector X,
 |
(4) |
where the indices α,β take the values 1 and 2. The estimated optical flow for the given sequence is then obtained by inversion of the matrix equation Mv = X. In practice, the condition number of the matrix M varies significantly even in regions where one would not expect the aperture problem to occur, causing local irregularities in the estimated image motion. To reduce such irregularities, we applied a Gaussian smoothing to the vector field v(x,t) as a final filtering step. We used Gaussians with spatial standard deviations between 8 and 16 pixels. As a method of assessing the performance of the method, artificial displacements were introduced in real confocal images, as described below.
By computing the smallest eigenvalue of the 2 × 2 matrix M, a useful measure of the reliability of the motion estimate for each pixel was obtained. By disregarding pixels with small eigenvalues, flow fields that closely matched high-contrast structures, such as cell membranes, were generated. Regions of the images that lacked defined structures, such as the fluid spaces of the scala media, were not assigned vectors. An example of this effect is seen in Fig. 6 b (see Results).
FIGURE 6.
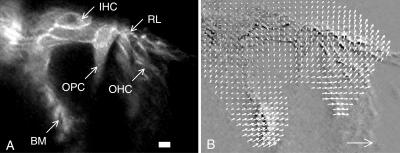
(A) Confocal image obtained during sound stimulation at 160 Hz and 126 dB sound pressure level. Scale bar, 10 μm. (IHC, inner hair cell; RL, reticular lamina; OPC, outer pillar cell; OHC, outer hair cells; and BM, basilar membrane.) (B) Subtraction of two images acquired at opposite phases of the sound stimulus produced the image underlying the optical flow map. Each vector scaled 2.5× relative to the pixel size. Large arrow in lower-right corner indicates 10-μm displacement.
Error measures
To evaluate the performance of our method for calculating the optical flow, three standard error metrics were used for comparing optical flow vectors, namely the magnitude error, the angular error, and the error normal to gradient. The magnitude error is defined as the root mean-square (or Euclidean) distance between the correct and estimated flow vectors, relative to the magnitude of the correct displacement, i.e.,
 |
where c is the correct and e the estimated motion vector, and  denotes the Euclidean norm of a two-dimensional vector v.
The angular error (Barron et al., 1994) is defined to be the angle made by the three-dimensional unit vectors ĉ = (c,1)/(1+ and ê = (e,1)/(
 It is given by the formula
 |
where the dot denotes the usual scalar product of three-dimensional vectors.
Finally, the error normal to gradient is defined as the absolute value of the component of c−e normal to the image gradient, relative to the full displacement magnitude, or in equation
 |
where g is the image gradient and ĝ is the unit vector (defined up to sign) perpendicular to g. We used the full displacement magnitude  to normalize this error, rather than the normal component
  , since the latter component is close to 0 in places where c and g are nearly perpendicular, leading to a singular normalization.
For comparison, we also implemented another optical flow algorithm (Lucas and Kanade, 1981). This differential algorithm was previously determined to be one of the best performing methods for calculating optical flow (Barron et al., 1994). In line with Barron et al., our implementation of the Lucas-Kanade algorithm used a Gaussian kernel with 1.5 pixels standard deviation for smoothing the input image sequence. Derivatives of the filtered sequences were estimated with simple differences for temporal derivatives, and with four-point central differences for spatial derivatives (using kernel coefficients (−1, 8, 0, −8, 1)/12 as in Barron et al., 1994). The window function defining the neighborhood used in the estimation was also a Gaussian kernel with standard deviation of 1.5 pixels. Iteration could have improved the results of both the Lucas-Kanade algorithm and our own wavelet-based method, but it would have been computationally more costly, and was therefore avoided.
RESULTS
Validation of system performance
To test the system, images of a sample of fluorescent cellulose fibers were used. Initially, laser pulses were synchronized to the start of each scan line, so all pulses occurred at a defined position within the image. This arrangement was used to test the pulse-counting part of the system. These tests showed that there was perfect overlap between the confocal image and the array of pulse counts, confirming that the two were synchronized on a pixel-to-pixel basis. Cellulose fibers were used regularly to confirm that the system was working properly. Synchronization was found to be stable during an extended period of experiments.
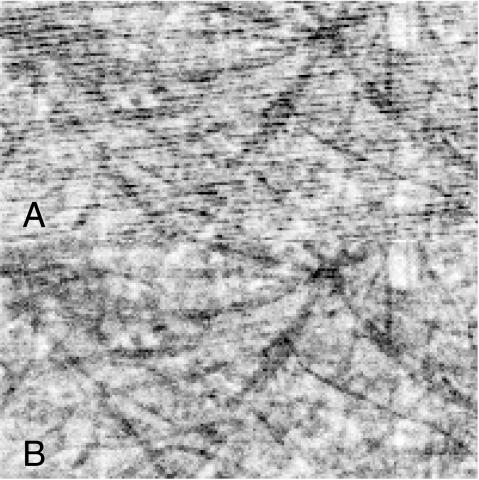
Fig. 2 A shows the sample of cellulose fibers imaged with a free-running TTL pulse at 140 Hz controlling the AOM. The pulse length was set to 143 μs. In this case, it was apparent that pulsed illumination resulted in image distortion due to the fact that different pixels of the confocal image were exposed to a variable number of pulses. To compensate for this, the image was divided with the array generated by the pulse counting program. The result (Fig. 2 B) was an elimination of distortion.
FIGURE 2.
Images of a test sample. (A) Raw image acquired with pulsed illumination. Note the oblique stripes running across the image. (B) Division with the array of pulse counts eliminated distortion.
Acquisition time was dependent on both the pulse frequency and the number of lines in the image. At pulse frequencies that were integer multiples of the microscope's line frequency, it was impossible to generate complete images. The number of lines in the image also affected the acquisition time. A frame size that allowed all the relevant parts of the hearing organ to be imaged simultaneously had to be selected. This required a minimum of 320 lines, resulting in typical acquisition times between 60 and 90 s.
Application of the system to rapidly moving biological specimens
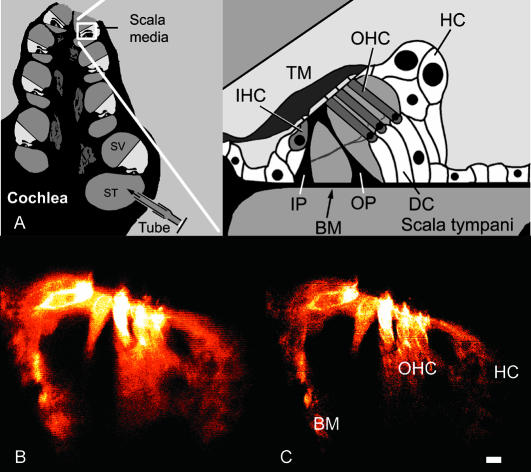
Fig. 3, B and C, shows two confocal images from the apical, low frequency region of the cochlea. Anatomical structures are depicted schematically in Fig. 3 A. The image in Fig. 3 B was acquired with regular, continuous illumination during sound stimulation. The motion of the organ caused image distortion, evident as blurring and horizontal streaks that made it impossible to discern structural details. When using pulsed illumination (Fig. 3 C), resolution was drastically improved, and it was now possible to see clearly several previously unresolved structures. Note the clarity of the cell membranes of outer hair cells and the lipid droplets inside Hensen cells. In many images, tiny details such as hair cell stereocilia were imaged at high resolution. In this image, 114-μs light pulses were used at a repetition frequency of 160 Hz. Pulses were phase-locked to the sinusoidal voltage command driving the loudspeaker that delivered the sound stimulation. Thus, this method of confocal imaging enabled us to study the two-dimensional vibration of structures inside the organ of Corti (see below).
FIGURE 3.
(A) Schematic drawings showing the region of the cochlea where images were acquired. (SV, scala vestibuli; ST, scala tympani; IHC, inner hair cell; OHC, outer hair cell; TM, tectorial membrane; HC, Hensen cells; DC, Deiters cells; BM, basilar membrane; IP, inner pillar cells; and OP, outer pillar cells.) (B) Standard confocal image of the organ of Corti acquired during intense sound stimulation at 160 Hz. Note the distortion caused by the rapid motion of the structures. (C) Same region of the organ at the same stimulus intensity and frequency, using pulsed excitation. Note the absence of distortion. Abbreviations are as in A, with scale bar, 10 μm, for both images.
Performance of the optical flow method
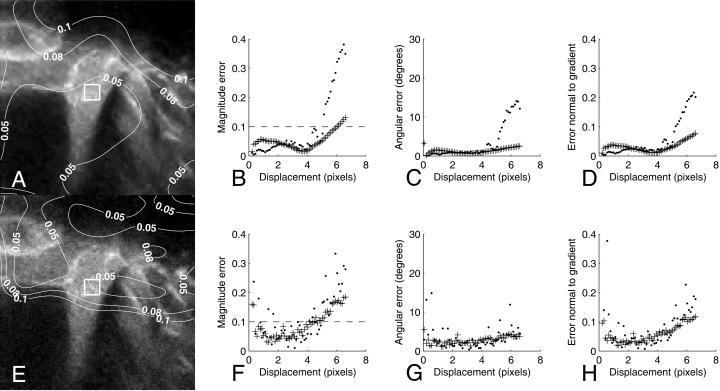
The method for optical flow computation was tested on images acquired with the modified confocal microscope. Using bicubic interpolation, the image shown in Fig. 4 A was artificially translated along a straight line directed at the lower-right corner of the image (in 59 steps ranging from 0.05 pixels to 6.7 pixels), allowing accurate computation of errors. Different regions within each image had different features (contrast, structural details, etc.) and therefore, errors varied within images. As shown by the superimposed contour lines, errors were <0.1 for large regions in the center of the image, where distinct features, such as the borders of the pillar cells, were seen. Similar results were obtained for circular, sinusoidal, and complex-deforming artificial motion.
FIGURE 4.
(A) Excerpt from image of the organ of Corti (pulsed excitation). Superimposed contour lines indicate the magnitude error levels for the wavelet-based optical flow computation. (B–D) Average magnitude error, angular error, and error normal to gradient, respectively, for the wavelet-based algorithm (+) and the Lucas-Kanade algorithm (·) within the white square at the center of A. Dashed line in B marks an average error of 0.1. (E) Same image as in A, but Poisson-distributed noise added, producing an 8-dB decline of the signal/noise ratio. Contours denote error levels. (F–H) Average magnitude error, angular error, and error normal to gradient for the noisy data. Symbols identical to B–D.
Error levels also depended on the magnitude of the artificial displacement. Crosses in Fig. 4 B show the average magnitude error within the region marked by the white square in Fig. 4 A. For displacements <0.2 pixels, the error increased dramatically (not shown on the graph), but for displacements larger than this, estimation errors remained <0.1 for the entire range between 0.2 and 6 pixels. For comparison, the dots show the average magnitude error of the Lucas-Kanade algorithm for the same region of the image. This algorithm performed slightly better for small displacements, but clearly worse at large displacements. Similar results were obtained for the angular error (Fig. 4 C) and the error normal to gradient (Fig. 4 D).
In a sense, these motion patterns are ideal and unrealistic. Although real images were used, the motion imposed on the images lack noise. In real experimental data, shot noise, as well as noise internal to detectors and electronics, will alter pixel values even if the structures under study show perfect conservation of intensity. Using the Monte Carlo rejection method (Press et al., 1994), Poisson-distributed noise was added to each frame of the image sequence before performing the motion estimation, to achieve a more rigorous and realistic test. The magnitude of the added noise was related to the intensity in each pixel; it resulted in obvious image degradation, as shown in Fig. 4 E. To maximize the effect, noise was added after wavelet denoising of the image, making this an even more stringent test.
Again, contours corresponding to different error levels were superimposed. Note that error levels for the degraded image still remain <0.1 in several areas of the image; parts of the image showing distinct structural features consistently showed the lowest error. Fig. 4 F shows the average magnitude error for the boxed area in the image. Note that magnitude errors <0.1 were achieved for all displacements in the range between 1 and 4 pixels. The Lucas-Kanade method appeared to be more sensitive to noise. For all of the three error measures given in Fig. 4, F–H, error levels typically showed more variation and errors were frequently more severe than the wavelet-based motion estimation.
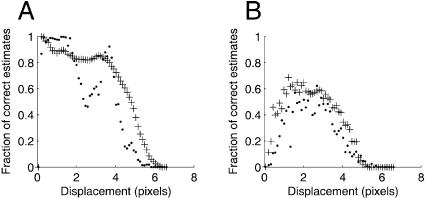
Another important characteristic is the density of correct motion estimates. To obtain a measure of this, we computed the fraction of pixels with a magnitude error <0.1. Under noise-free conditions, both algorithms performed very well for small displacements, but the wavelet-based algorithm appeared more stable, showing less variation in the fraction of correct estimates (Fig. 5 A). When using noisy data (Fig. 5 B), the wavelet-based algorithm outperformed Lucas-Kanade for 86% of the displacement magnitudes.
FIGURE 5.
(A) The noise-free motion sequence was used to calculate the fraction of pixels with a magnitude error <0.1 for the wavelet-based algorithm (+) and the Lucas-Kanade algorithm (·). (B) Corresponding calculation using the degraded image sequence.
Inner ear motion patterns
By acquiring images with different temporal relation between the sound stimulus and the laser pulses, the motion of inner ear structures during sound stimulation were studied. Fig. 6 A shows an image where laser pulses were locked approximately to peak rarefaction at the eardrum. Many important structures can be seen. Notable are the inner hair cells with their associated nerve endings, cell membranes of outer hair cells, and pillar cells, as well as the reticular lamina and basilar membrane. Another image was acquired after moving laser pulses 180° with respect to the stimulus. Fig. 6 B shows these two images subtracted from each other, so moving regions are either black or white whereas stationary regions appear in a neutral gray color. The optical flow pattern has been superimposed, the length of each arrow corresponding to displacement. The frames were also assembled into a movie, available for downloading (0920a14a15.avi) at http://ki.se/cfh/research/movie_en.html. For pixels showing large enough motion, basic features of the optical flow map in Fig. 6 B can be verified simply by comparing it to the motion seen in the video file.
A consistent feature in our experiments was that displacements were small in the region of the inner hair cells, but gradually increased along the reticular lamina. Motion vectors for the reticular lamina were oriented nearly perpendicular to its long axis, meaning that radial motion components were close to absent. A similar pattern was seen for the segment of the basilar membrane that we could visualize. Displacements of both the basilar membrane and the reticular lamina increased linearly along their length (data not shown). However, vector directions for these structures were not compatible with rigid rotation around a single point.
Close to the reticular lamina, outer hair cell vectors had the same orientation as vectors of the reticular lamina, but vectors from parts of the outer hair cells closer to the basilar membrane had a different orientation. This implies that outer hair cells deformed. Outer pillar cells behaved differently. Vectors for these cells were oriented along the long axis of the cell, with similar direction regardless of position along the cell, suggesting that their motion was rigid. This is in agreement with studies showing that outer pillar cells are quite stiff (Tolomeo and Holley, 1997). These data imply that structural relations within the organ of Corti were dynamically changing during sound stimulation, a fact that directly contradicts classical models of organ of Corti vibration.
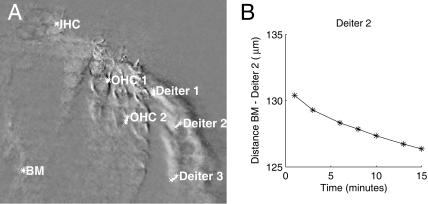
We also exposed the isolated temporal bone preparation to acoustic overstimulation at 138–146 dB SPL and 160 Hz. These levels are high, but the effective level is reduced by immersion of the preparation and opening of the apical turn (see Methods). As previously described (Fridberger et al., 1998), such stimulation causes a slow contraction of supporting cells. This slow contraction is intimately linked to the temporary loss of sensitivity that occurs immediately after loud sound exposure, and when the contraction subsides, cochlear sensitivity is frequently restored (Flock et al., 1999; Wang et al., 2002). Permanent hearing loss induced by loud sound may involve other mechanisms. Previous studies could only assess this structural change through images acquired before and after overstimulation. Methods described here permitted us to follow the development of this structural change by acquiring constant-phase images at regular intervals during continuous overstimulation lasting for 15 to 20 min. Small structural changes could be accurately quantified using the optical flow algorithm. Fig. 7 A is the result of subtracting the first and last image in a series of eight, acquired during the course of an overstimulation run that lasted 17 min. Again, overlapping structures are displayed in a neutral gray color and moving structures are either white or black. Computed trajectories for three different points on the supporting cells (Deiter 1–3) and the outer hair cells (OHC 1–2) are shown, together with trajectories from the basilar membrane (BM) and the inner hair cell apex (IHC). For the two latter locations, no significant motion was seen, whereas supporting cells showed motion directed at the outer hair cells. In Fig. 7 B, the Euclidean distance between the point labeled “Deiter 2” and the BM point is given as a function of duration of the overstimulation. Evidently, the contraction developed gradually during the course of the traumatic stimulus, at an approximate rate of 0.29 μm/min. Similar responses were elicited from four out of six preparations; however, contraction speed was highly variable. Outer hair cells also showed a slow structural change, most evident for the point OHC2. However, this change was hard to interpret since the optical section was slightly oblique.
FIGURE 7.
(A) Two constant-phase images acquired at the beginning and end of a 17-min period of overstimulation were subtracted from each other to highlight motion. Trajectories are for three points on supporting cells (Deiter 1–3). Outer hair cells (OHC 1–2), the basilar membrane (BM), and inner hair cells (IHC) are also displayed. (B) Euclidean distance between supporting cells and the basilar membrane during the overstimulation.
DISCUSSION
Many important physiological processes occur on a timescale that is beyond the time-resolution of a conventional confocal microscope. The study of such rapid phenomena has prompted development of new methods, such as pulsed laser imaging (e.g., Fisher and Fernandez, 1999), that has sufficient time resolution for imaging very fast changes in physiological parameters. With pulsed laser imaging, a high-power laser with short pulse length (<1 μs) is utilized to excite fluorophores loaded into cells. The timing of the laser pulse is synchronized to external events such as the depolarization of the cell. This method works well for relatively thin specimens such as isolated cells, but for thicker tissues, resolution is compromised due to the lack of confocality in the system.
Laser scanning confocal microscopy was developed to circumvent the problem of image distortion caused by out-of-focus light. Typical confocal microscopes are inherently slow due to the requirement for scanning the focused laser beam across the preparation. Using the method described here, we collected confocal images of a rapidly moving thick structure, the organ of Corti. The system performed reliably, with only minor adjustments, during several months of experiments. This required relatively small modifications that did not involve any of the more sensitive parts (such as the scanning mechanism itself). The original microscope control software was used and, by turning the AOM constantly on, the system again functioned as a standard confocal microscope.
Our method resulted in images where each pixel was acquired during a time window equal to the width of the laser pulse. Inevitably, this meant that the total acquisition time increased. For the system to work properly, the response of the system under study obviously has to be stably repeatable at least during the time it takes to acquire one image. If this were not the case, severe image distortion would result. Such image degradation was never seen in images of the organ of Corti.
An alternative way of achieving high-speed confocal imaging would be to increase the scanning speed (for review, see Tsien and Bacskai, 1995). Apart from the technical difficulties, this approach would probably require enhanced detectors and the use of relatively high laser powers (due to the short pixel dwell times). In contrast, the system described here scans at the normal speed of the microscope, with pixel dwell times on the order of 4 μs—sufficiently long for effective imaging even of faint specimens.
Computing the optical flow
Several authors have made use of the discrete wavelet transform for computation of optical flow (e.g., Magarey and Kingsbury, 1998; Bernard, 2001). The general idea is to produce several filtered versions of the original sequence with modified gradients but nearly the same image motion. The constraint in Eq. 1 then leads to an overdetermined system for the image motion, which is solved by least-square inversion. It is necessary to use filter banks that preserve most of the information in the original sequence. However, for computational efficiency, redundancy must be minimized. It has proven very effective to use a multiscale approach where filters of various sizes are applied, such as Gabor filters agenced in a multiscale pyramid (Weber and Malik, 1995). The DWT appears as a very natural tool in this context, as it produces a multiscale representation of an image that is complete (no information lost), essentially nonredundant, and implemented with fast algorithms. Our method is inspired by the one developed by Bernard (2001), although there are substantial differences, the main one being that we apply a nondecimated real DWT to the images, whereas both Bernard (2001) and Magarey and Kingsbury (1998) used a decimated complex DWT.
Another important difference lies in the combination of different scales of our DWT to produce an image flow estimate. The least-squares matrix M defined in Eq. 4 combines all the scales at the same time. A more standard approach would consist of building a least-squares matrix Mj for each scale j, and performing the estimation step by step in a coarse-to-fine process (Bernard, 2001). The point is that for a real, nondecimated DWT, the matrices Mj are typically singular, leading to a poor estimation. However, the full matrix M, taking all scales into account, behaves much better. This means that the support of the wavelets used should not be too large, which puts a limit to the resolution of the computation. In practice, however, the method is robust and performs very well quantitatively, as detailed under Results.
Recently, Cai et al. (2003) described a novel method for optical flow computation. Their method also performed better than the Lucas-Kanade algorithm, at least when using noise-free artificial displacements. Since noise has an important effect on the accuracy of the optical flow estimation, it is difficult to compare the performance of their algorithm against our own.
Motion pattern of the hearing organ
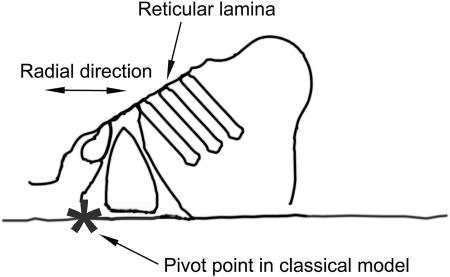
The two-dimensional motion pattern of the hearing organ is a crucial component in auditory transduction, since relative motion between different structures leads to gating of mechanically sensitive channels and ultimately to perception. Frequently, the organ of Corti has been assumed to vibrate as a single rigid body around a pivot point located close to the attachment of the basilar membrane to the bony core of the cochlea (ter Kuile, 1900; Rhode and Geisler, 1967; see also Fig. 8). This kinematic model, which is supported by indirect data (Hu et al., 1999; Hemmert et al., 2000), leads to certain predictions. Since the putative pivot point is located under the inner hair cells, the inner hair cell apex should move radially, an ideal condition for deflecting stereocilia. Since rigid vibration is assumed, only a single degree of freedom exists, and structural relations within the organ of Corti should remain static during motion. Although this model has attractive features, it is difficult to explain how outer hair cell motility can have such a profound influence on hearing sensitivity, since the rigidity of the motion entails absence of structural alterations. Therefore, some recent models include deformation of the organ of Corti as an important part of the transduction mechanism (e.g., Markin and Hudspeth, 1995; Neely and Stover, 1993). These models have also received indirect support (Mammano and Ashmore, 1993; Nilsen and Russell, 1999; Nuttall et al., 1999).
FIGURE 8.
Schematic drawing showing the location of the pivot point in the classical model. This model predicts purely radial motion for the top of the inner hair cells.
Several features of our data are at odds with the classical model (see also Fridberger and Boutet de Monvel, 2003). Radial displacement was absent at the inner hair cell apex. Instead, the reticular lamina moved in a direction perpendicular to its long axis. This agrees with one previous report (Hemmert et al., 2000) that nonetheless was interpreted as providing indirect support for the classical model. The graded increase of displacement that we observed at the reticular lamina is in agreement with previous reports (Ulfendahl et al., 1996; Hemmert et al., 2000). One previous interferometric study reported significant radial motion at the reticular lamina (Ulfendahl et al, 1995). However, unlike the present study, measurements in that study were performed with ruptures in Reissner's membrane, which may have produced alterations in the ionic environment in scala media.
In the current study, parts of the outer hair cells moved in a direction different from that of the reticular lamina. Such motion was also seen in recent experiments that used slow pressure changes to produce organ of Corti motion (Fridberger et al., 2002). These features are obviously incompatible with rigid vibration, demonstrating that structural relations within the organ of Corti are highly dynamic, at least during sound stimulation at the levels used here. Additional work is required to clarify the vibration pattern for lower stimulus intensities. However, we note that the passive mechanics of the organ are important for sound-evoked responses at all stimulus intensities and that no previous data exists on the internal sound-evoked vibration of the organ of Corti.
Images acquired during overstimulation allowed us to investigate the development of slow supporting cell contractions. These new data show that the contraction develops gradually during the course of the stimulation. This morphological change represents one of the earliest detectable alterations in organ structure during overstimulation. Recent studies have implied it as an important correlate of temporary threshold shifts, occurring before the development of other structural changes, such as outer hair cell swelling and stereocilia damage (Flock et al., 1999; Wang et al., 2002).
In summary, the system described in this article provides a means to capture very fast repeating events by relatively minor modifications to a standard confocal microscope. Such repeating events occur not only in the organ of Corti, but are also common during electrophysiological experiments, where isolated cells are typically subjected to repeated current or voltage steps. If small cells are studied, frame sizes can be kept small, and consequently, acquisition times can be relatively brief. For the case where a confocal microscope is already available, the method is also economical since the only new components needed are the acousto-optic modulator, laser fiber, and a computer with an A/D board and software (the necessary custom software is available on request from the first author). These are all standard components that can be purchased at relatively low cost.
Techniques for reliable motion detection are useful not only in auditory biophysics. A few other examples include monitoring the growth of cells, plants, growth cones, and the measurement of animal motion during behavioral studies. Thus, in several areas of physiology and neuroscience, methods described in this article should prove to be highly useful.
Supplementary Material
Acknowledgments
Mats Ulfendahl and Åke Flock are gratefully acknowledged for gift of indispensable equipment. Jan Lännergren and Lennart Löfqvist helped with various mechanical designs and custom electronics.
This work was supported by the Swedish Research Council, Stiftelsen Tysta Skolan, Hörselskadades Riksförbund, Svenska Sällskapet för Medicinsk forskning, Tore Nilsons stiftelse, Astrid och Gustav Kaleens fond, Åke Wibergs stiftelse, Bergvalls stiftelse, and the funds of the Karolinska Institute.
Jerker Widengren's present address is Dept. of Physics, Experimental Biomolecular Physics, SCFAB, Royal Institute of Technology, SE-10691, Stockholm, Sweden.
References
- Art, J. 1995. Photon detectors for confocal microscopy. In Handbook of Biological Confocal Microscopy. J. B. Pawley, editor. Plenum Press, New York. 183–195.
- Barron, J., D. Fleet, and S. Beauchemin. 1994. Performance of optical flow techniques. Int. J. Comp. Vision. 12:43–77. [Google Scholar]
- Bernard, C. 2001. Discrete wavelet analysis for fast optical flow computation. Appl. Comp. Harmonic Anal. 11:32–63. [Google Scholar]
- Boutet de Monvel, J., S. Le Calvez, and M. Ulfendahl. 2001. Image restoration for confocal microscopy: improving the limits of deconvolution. Biophys. J. 80:2455–2470. [DOI] [PMC free article] [PubMed] [Google Scholar]
- Brownell, W. E., C. R. Bader, D. Bertrand, and Y. de Ribaupierre. 1985. Evoked mechanical responses of isolated cochlear outer hair cells. Science. 227:194–196. [DOI] [PubMed] [Google Scholar]
- Cai, H., C.-P. Richter, and R. S. Chadwick. 2003. Motion analysis in the hemicochlea. Biophys. J. 85:1929–1937. [DOI] [PMC free article] [PubMed] [Google Scholar]
- Fisher, T. E., and J. M. Fernandez. 1999. Pulsed laser imaging of Ca2+ influx in a neuroendocrine terminal. J. Neurosci. 19:7450–7457. [DOI] [PMC free article] [PubMed] [Google Scholar]
- Flock, Å., B. Flock, A. Fridberger, M. Ulfendahl, and E. Scarfone. 1999. Supporting cells contribute to control of hearing sensitivity. J. Neurosci. 19:4498–4507. [DOI] [PMC free article] [PubMed] [Google Scholar]
- Frank, G., W. Hemmert, and A. W. Gummer. 1999. Limiting dynamics of high-frequency electromechanical transduction of outer hair cells. Proc. Natl. Acad. Sci. USA. 96:4420–4425. [DOI] [PMC free article] [PubMed] [Google Scholar]
- Franke, R., A. Dancer, S. M. Khanna, and M. Ulfendahl. 1992. Intracochlear and extracochlear sound pressure measurements in the temporal bone preparation of the Guinea pig. Acustica. 76:173–182. [Google Scholar]
- Fridberger, A., J. van Maarseveen, E. Scarfone, M. Ulfendahl, B. Flock, and Å. Flock. 1997. Pressure-induced basilar membrane position shifts and the stimulus-evoked potentials in the low-frequency region of the Guinea pig cochlea. Acta Physiol. Scand. 161:239–252. [DOI] [PubMed] [Google Scholar]
- Fridberger, A., Å. Flock, M. Ulfendahl, and B. Flock. 1998. Acoustic overstimulation increases outer hair cell Ca concentrations and causes dynamic contractions of the hearing organ. Proc. Natl. Acad. Sci. USA. 95:7127–7132. [DOI] [PMC free article] [PubMed] [Google Scholar]
- Fridberger, A., and J. Boutet de Monvel. 2003. Sound-induced differential motion within the hearing organ. Nat. Neurosci. 6:446–448. [DOI] [PubMed] [Google Scholar]
- Fridberger, A., J. Boutet de Monvel, and M. Ulfendahl. 2002. Internal shearing within the hearing organ evoked by basilar membrane motion. J. Neurosci. 22:9850–9857. [DOI] [PMC free article] [PubMed] [Google Scholar]
- Hemmert, W., H.-P. Zenner, and A. W. Gummer. 2000. Three-dimensional motion of the organ of Corti. Biophys. J. 78:2285–2297. [DOI] [PMC free article] [PubMed] [Google Scholar]
- Horn, B. K. P., and B. G. Schunck. 1981. Determining optical flow. Artif. Intell. 17:185–203. [Google Scholar]
- Hu, X., B. N. Evans, and P. Dallos. 1999. Direct visualization of organ of Corti kinematics in a hemicochlea. J. Neurophysiol. 82:2798–2807. [DOI] [PubMed] [Google Scholar]
- ter Kuile, E. 1900. Die Uebertragung der energie von der grundmembran auf die haarzellen. Pflugers Arch. 79:146–157. [Google Scholar]
- Lucas, B., and T. Kanade. 1981. An iterative image registration technique with an application in stereo vision. In Proceedings of the 7th International Joint Conference on Artificial Intelligence. Morgan Kaufman. 674–679.
- Magarey, J., and N. Kingsbury. 1998. Motion estimation using a complex-valued wavelet transform. IEEE Trans. Signal Proc. 46:1069–1084. [Google Scholar]
- Mammano, F., and J. F. Ashmore. 1993. Reverse transduction measured in the isolated cochlea by laser Michelson interferometry. Nature. 365:838–841. [DOI] [PubMed] [Google Scholar]
- Markin, V. S., and A. J. Hudspeth. 1995. Modeling the active process of the cochlea—phase relations, amplification, and spontaneous oscillation. Biophys. J. 69:138–147. [DOI] [PMC free article] [PubMed] [Google Scholar]
- Neely, S. T., and L. J. Stover. 1993. Otoacoustic emissions from a nonlinear, active model of cochlear mechanics. In Biophysics of Hair Cell Sensory Systems. H. Duifhuis, J. W. Horst, P. van Dijk, and S. M. van Netten, editors. World Scientific, Singapore. 64–71.
- Nilsen, K. E., and I. J. Russell. 1999. Timing of cochlear feedback: spatial and temporal representation of a tone across the basilar membrane. Nat. Neurosci. 2:642–648. [DOI] [PubMed] [Google Scholar]
- Nuttall, A. L., M. Guo, and T. Ren. 1999. The radial pattern of basilar membrane motion evoked by electric stimulation of the cochlea. Hear. Res. 131:39–46. [DOI] [PubMed] [Google Scholar]
- Press, W. H., S. A. Teukolsky, W. T. Vetterling, and B. P. Flannery. 1994. Numerical Recipes in C. Cambridge University Press, Cambridge, UK.
- Rhode, W. S., and C. D. Geisler. 1967. Model of the displacement between opposing points on the tectorial membrane and the reticular lamina. J. Acoust. Soc. Am. 42:185–190. [DOI] [PubMed] [Google Scholar]
- Robles, L., and M. A. Ruggero. 2001. Mechanics of the mammalian cochlea. Physiol. Rev. 81:1305–1352. [DOI] [PMC free article] [PubMed] [Google Scholar]
- Tolomeo, J. A., and M. C. Holley. 1997. Mechanics of microtubule bundles in pillar cells from the inner ear. Biophys. J. 73:2241–2247. [DOI] [PMC free article] [PubMed] [Google Scholar]
- Tsien, R. Y., and B. J. Bacskai. 1995. Video-rate confocal microscopy. In Handbook of Biological Confocal Microscopy. J. B. Pawley, editor. Plenum Press, New York. 459–478.
- Ulfendahl, M., S. M. Khanna, and C. Heneghan. 1995. Shearing motion in the hearing organ measured by confocal laser heterodyne interferometry. Neuroreport. 6:1157–1160. [DOI] [PubMed] [Google Scholar]
- Ulfendahl, M., S. M. Khanna, A. Fridberger, Å. Flock, B. Flock, and W. Jäger. 1996. Mechanical response characteristics of the hearing organ in the low-frequency regions of the cochlea. J. Neurophysiol. 76:3850–3861. [DOI] [PubMed] [Google Scholar]
- Ulfendahl, M. 1997. Mechanical responses of the mammalian cochlea. Progr. Neurobiol. 53:331–380. [DOI] [PubMed] [Google Scholar]
- Wang, Y., K. Hirose, and M. C. Liberman. 2002. Dynamics of noise-induced cellular injury and repair in the mouse cochlea. J. Assoc. Res. Otolaryngol. 3:248–268. [DOI] [PMC free article] [PubMed] [Google Scholar]
- Weber, J., and J. Malik. 1995. Robust computation of optical flow in a multi-scale differential framework. Int. J. Comp. Vision. 14:5–19. [Google Scholar]
Associated Data
This section collects any data citations, data availability statements, or supplementary materials included in this article.


