

Abstract
In the last decade evidence has accumulated that small domains of 50–700 nm in diameter are located in the exoplasmic leaflet of the plasma membrane. Most of these domains supposedly consist of specific sets of lipids and proteins, and are believed to coordinate signal transduction cascades. Whether similar domains are also present in the cytoplasmic leaflet of the plasma membrane is unclear so far. To investigate the presence of cytoplasmic leaflet domains, the H-Ras membrane-targeting sequence was fused to the C-terminus of the enhanced yellow fluorescent protein. Using single-molecule fluorescence microscopy, trajectories of individual molecules diffusing in the cytoplasmic leaflet of the plasma membrane were recorded. From these trajectories, the diffusion of individual membrane-anchored enhanced yellow fluorescent protein molecules was studied in live cells on timescales from 5 to 200 ms. The results show that the diffusion of 30–40% of the molecules is constrained in domains with a typical size of 200 nm. Neither breakdown of actin nor cholesterol extraction changed the domain characteristics significantly, indicating that the observed domains may not be related to the membrane domains identified so far.
INTRODUCTION
The Singer and Nicolson fluid mosaic model (Singer and Nicolson, 1972) has been the paradigm in cell biology for the description of the organization and dynamical behavior of the plasma membrane. In this model the bilayer is represented as a neutral two-dimensional solvent in which membrane proteins are homogeneously distributed and are free to move. However in the last decade experimental evidence indicated that the plasma membrane of various mammalian cell types is heterogeneous in structure and contains various types of domains (Sheetz, 1995; Jacobson et al., 1995; Kusumi and Sako, 1996; Edidin, 1997). One type of domain is referred to as liquid-ordered microdomain or “lipid raft.” These cholesterol- and sphingolipid-rich domains are thought to coexist with a more fluid phase and are enriched in lipids with saturated hydrocarbon chains (Simons and Ikonen, 1997; Simons and Toomre, 2000). Biochemically, lipid raft components are identified as the detergent-resistant membrane (DRM) fraction, observed after detergent extraction of cell membranes (Brown and Rose, 1992; Brown and London, 1998). Various biophysical techniques were used to measure the size of lipid rafts in vivo yielding values between 50 and 700 nm (Sheets et al., 1997; Varma and Mayor, 1998; Simson et al., 1998; Pralle et al., 2000; Schütz et al., 2000; Dietrich et al., 2002; Zacharias et al., 2002). A second type of diffusional domain found in the membrane of live cells is caused by a cytoskeletal network associated with the cell membrane, resulting in domains with a diameter of 350–750 nm (Kusumi and Sako, 1996; Fujiwara et al., 2002).
Most of the biophysical studies to identify membrane domains have focused on the exoplasmic leaflet of the plasma membrane, because of the easy accessibility of the outer membrane leaflet for the specific labeling of various membrane components. For this reason knowledge about domains in the cytoplasmic leaflet of the plasma membrane is immature, although recent work indicates their presence (Zacharias et al., 2002). From the biological point of view the cytoplasmic leaflet is of central importance, as most signaling pathways make use of proteins that are anchored in this leaflet, like small GTPases of the Ras family, the Src-family kinases, and G-proteins.
To investigate the presence of domains in the cytoplasmic leaflet a lipid-anchored fluorescent protein was produced which is targeted to the cytoplasmic leaflet of the plasma membrane. This protein consists of the enhanced yellow fluorescent protein (eYFP), which has the membrane targeting sequence of the human H-Ras fused to its C-terminus. This membrane targeting sequence consists of 10 amino acids and contains three cysteines to which one S-prenyl and two S-acyl groups are attached posttranslationally (Hancock et al., 1990; Apolloni et al., 2000). Association of such a lipid-anchored fluorescent protein with lipid rafts has recently been suggested by biochemical methods where it has been found in the DRM fraction (Prior et al., 2001). However, other studies indicate that prenylated proteins are not localized in the DRM fraction (Melkonian et al., 1999; Wang et al., 2001), making the possible association of prenylated proteins with lipid rafts unclear.
Because of the small size of the domains, advanced biophysical in vivo techniques are required for their identification and detailed study. Here we used single-molecule microscopy to track individual lipid-anchored fluorescent proteins in the cytoplasmic membrane of live cells. Detailed analysis of 35,128 trajectories revealed that 30–40% of the lipid-anchored eYFP molecules are confined in domains. These domains are ∼200 nm in size, are present in two different cell types, and at two different temperatures. The size of the observed domains does not depend significantly on the actin cytoskeleton or on cholesterol, which makes them different from membrane domains observed so far.
MATERIALS AND METHODS
DNA constructs
The DNA sequence encoding the 10 C-terminal amino acids of human H-Ras (GCMSCKCVLS), which includes the CAAX motif, was inserted in frame at the C-terminus of the enhanced yellow-fluorescent protein (eYFP, S65G/S72A/T203Y) coding sequence using two complementary synthetic oligonucleotides (Isogen Bioscience, Maarssen, The Netherlands). The integrity of the reading frame of the resulting eYFP-C10HRas construct was verified by sequence analysis. For expression in mammalian cells, the complete coding sequence of eYFP-C10HRas was cloned into the pcDNA3.1 vector (Invitrogen, Groningen, The Netherlands).
Cell cultures
In this study two cell lines were used: a human embryonic kidney cell line (tsA201) and a mouse fibroblast cell line (3T3-A14). Cells were cultured in DMEM medium supplemented with streptomycin (100 μg/ml), penicillin (100 units/ml), and 10% bovine serum in a 7% CO2 humidified atmosphere at 37°C (95% humidity). Cells were used for 12–14 passages and were transferred every four days. For microscopy the cells were cultured on #1 glass slides (Fisher Scientific's-Hertogenbosch, The Netherlands). Cells exhibiting a confluency level of 20% were used for transfection with either 2.5 μg DNA and 12.5 μl DOTAP (Amersham Pharmacia Biotech, Roosendaal, The Netherlands) or 1.0 μg DNA and 3 μl FuGENE 6 (Roche Molecular Biochemicals, Indianapolis, IN) per glass slide. The transfection efficiency, as determined by fluorescence microscopy, was in the range of 10–30%.
Single-molecule microscopy
The experimental arrangement for single-molecule imaging has been described in detail previously (Schmidt et al., 1995; Harms et al., 2001a). Briefly, cells adherent to glass slides were mounted onto the microscope and kept in PBS (phosphate-buffered saline: 150 mM NaCl, 10 mM Na2HPO4/NaH2PO4, pH 7.4). The microscope (Axiovert 100TV, Zeiss, Oberkochen, Germany) was equipped with a 100× oil-immersion objective (NA = 1.4, Zeiss). A temperature controller kept the cells at 22 or 37°C. The samples were illuminated for 3 ms by an Ar+-laser (Spectra Physics, Mountain View, CA) at a wavelength of 514 nm. The illumination intensity was set to 2 ± 0.2 kW/cm2. Use of an appropriate filter combination (DCLP530, HQ570/80, Chroma Technology, Brattleboro, VT; and OG530-3, Schott, Mainz, Germany) permitted the detection of individual fluorophores by a liquid-nitrogen-cooled slow-scan charge-coupled device (CCD) camera system (Princeton Instruments, Trenton, NY). The total detection efficiency of the experimental setup was 8%. For the observation of the mobility of the membrane-anchored fluorophores the focus was set to the apical membrane of cells (depth of focus ∼1 μm). The density of fluorescent proteins on the plasma membrane of selected transfected cells (4–6 days post transfection) was <1 μm−2, which permitted imaging and tracking of individual fluorophores. Furthermore, this low density ensured that fluorescent protein dimerization as reported by Zacharias et al. (2002) was not observed.
Fluorescence images were taken consecutively with up to 200 images per sequence. The signals on the CCD originating from individual molecules were fitted to a two-dimensional Gaussian surface with a full-width at half-maximum = 360 ± 40 nm, given by the point-spread function of our setup. The photon counts were determined with a precision of 20%, limited by the shot noise and readout noise of the CCD camera. Comparison of the single-molecule signal with the background noise yielded a signal/background noise ratio of 11. The latter figure translates into a positional accuracy for single-molecule localization of 35 nm (Bobroff, 1976). By connectivity analysis between consecutive images the two-dimensional trajectories of individual molecules in the plane of focus were reconstructed. These trajectories were up to nine steps in length, mainly limited by the blinking and photobleaching of the fluorophore (Harms et al., 2001a). To compensate for the limited length of individual trajectories multiple data sets were produced. Each data set was acquired with a different time between two consecutive images (time lag, tlag). By using different time lags, varying from 5 to 200 ms, the lateral mobility of membrane-anchored molecules was studied.
Trajectory analysis
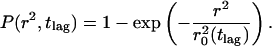
The trajectories were analyzed following a method developed earlier (Schütz et al., 1997). In brief, the lateral diffusion of Brownian particles in a medium characterized by a diffusion constant D is described by the cumulative distribution function for the square displacements, r2 (Anderson et al., 1992; Almeida and Vaz, 1995),
 |
(1) |
P(r2,tlag) describes the probability that the Brownian particle starting at the origin will be found within a circle of radius r at time tlag. It is characterized by the mean-square displacement of 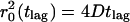 (Anderson et al., 1992). Provided that the system under study segregates into two components, one with a fast and one with a slow mobility, characterized by diffusion constants D1 and D2, and relative fractions α and (1-α), respectively, Eq. 1 becomes (Schütz et al., 1997)
 |
(2) |
with mean-square displacements of 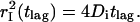
The probability distributions P(r2,tlag) were constructed for every time lag from the single-molecule trajectories by counting the number of square displacements with values ≤r2 and subsequent normalization by the total number of datapoints (Schütz et al., 1997). Only probability distributions with N > 90 data points were least-square fit to Eq. 2. This results in a parameter set 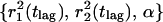 for each time lag, tlag, between 5 and 200 ms. It should be noted that our approach of fitting the probability distributions to Eq. 2 does lead to a robust estimation of the mean-square displacements
  and
and  even when the mobility is not purely random. By plotting
  and
and  versus tlag, the diffusional behavior of the respective populations of molecules is revealed. The data analysis method was verified by extensive simulations taking into account the signal/background ratio, and two distinct diffusional fractions of mobile point emitters. The positional accuracy in our measurements is 35 nm, which leads to a constant offset in
  of 4 × (35 nm)2 = 0.49 · 10−2 μm2 for all time lags (Schütz et al., 1997).
Fluorescence recovery after photobleaching (FRAP)
Cells were transfected with eYFP-C10HRas 3–4 days before the experiment. During the experiments cells were kept in PBS at 22°C. FRAP curves (see Fig. 5 in the Online Supplement for supporting information) were fit to the equations given by Feder et al. (1996).
Actin destabilization and cholesterol extraction
The actin cytoskeleton was destabilized by supplementing the medium with 0.5 μM latrunculin B (Calbiochem, San Diego, CA) followed by a 30-min incubation period at 37°C and 7% CO2. This treatment results in observable changes of the actin cytoskeleton (for supporting information, see Fig. 6 in the Online Supplement). As 0.025% DMSO is present during this latrunculin B treatment, control cells were incubated with 0.025% DMSO. After the incubation period, the cells were washed three times with PBS and measurements were taken within 30 min after incubation.
Cholesterol extraction was performed by incubating the cells in DMEM supplemented with 5 mM methyl-β-cyclodextrin (MβCD, Sigma-Aldrich Chemie, Steinheim, Germany) in a 7% CO2 humidified atmosphere at 37°C (95% humidity) for 1 h.
This treatment decreases the free cholesterol content of the total cell membrane fraction by ∼60% (supporting information: Fig. 7 and Table 2 in the Online Supplement). After the extraction cells were washed three times in PBS, and used for imaging for up to 1 h. The cholesterol extraction did not result in observable changes of cell morphology within 1.5 h after extraction.
RESULTS
Observation and tracking of individual lipid-anchored molecules
A fusion of the membrane targeting sequence of the human H-Ras with the enhanced yellow-fluorescent protein (eYFP-C10HRas, see Fig. 1 A) was constructed to study its diffusion in the cytoplasmic leaflet of mammalian cells. Cells that were transiently transfected with DNA encoding this fusion protein showed a clear membrane-localized fluorescence two days after transfection (for supporting information, see Fig. 8 in the Online Supplement).
FIGURE 1.

(A) Schematic drawing of the eYFP-C10HRas protein including the S-prenyl and two S-palmitoyl groups. White light (upper left) and corresponding fluorescence images (upper and lower right) of a tsA201 cell transfected with DNA encoding for eYFP-C10HRas. For the fluorescence image the cell was illuminated using 514-nm laser light for 3 ms at an intensity of 2 kW/cm2. Two membrane-localized signals attributed to single fluorescent proteins are present. (B) Example of a single-step photobleaching event of an individual eYFP-C10HRas, indicative for an individual fluorophore. (C) Analysis of 240 signals of individual eYFP-C10HRas molecules observed at the apical membrane of tsA201 cells (solid line). The probability density of the signal amplitude is nearly Gaussian-shaped with a maximum of 220 counts/3 ms. The statistics of the background signal (dashed line) is shown for comparison, being characterized by a width of σB = 19 counts/3 ms.
Four to six days after transfection, the density of membrane-anchored eYFP molecules was low enough (<1 μm−2) to observe signals of individual eYFP-C10HRas molecules (Fig. 1 A). Diffraction-limited spots with a mean signal intensity of 73 ± 14 counts/ms and single-step photobleaching events (Fig. 1, B and C) ensured that individual fluorescent molecules were observed (Schmidt et al., 1995; Harms et al., 2001a). Consecutive illuminations of the flat apical membrane area were used for tracking of individual eYFP molecules and construction of corresponding trajectories. In the inset of Fig. 2 two trajectories taken with a time lag of 80 ms are shown. The positional accuracy with which single molecules were localized was 35 nm. Variation of the time between two images allowed recording of sets of trajectories with time lags ranging from 5 to 200 ms.
FIGURE 2.

Cumulative distribution function for square displacements (N = 290), P(r2,tlag), of individual eYFP-C10HRas molecules observed at the apical membrane of 10 different tsA201 cells. Data were obtained with a time lag of 64 ms. The solid line represents the result of a biexponential fit according to Eq. 2, yielding  , and α = 0.76 ± 0.05. A monoexponential fit according to Eq. 1 (dashed line) fails. The inset shows two trajectories of individual eYFP-C10HRas molecules at the apical membrane of a tsA201 cell. The time between subsequent observations was 80 ms.
For each time lag, a set of trajectories (N > 90) was used to calculate the cumulative probability distribution of the square displacement. Fig. 2 shows the cumulative probability distribution for the time lag of 64 ms (dots). The data exhibit a biphasic behavior described by the biexponential probability function given in Eq. 2 (solid line). For the data shown in Fig. 2 the diffusion of molecules was characterized by a relative fraction, α = 0.76 ± 0.05 and the mean-square displacements 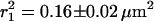 and
and  , respectively. For all time lags, samples, and environments measured, the data exhibit such biphasic behavior.
Single-molecule measurements on eYFP-C10HRas in tsA201 cells
Single-molecule diffusion measurements were first performed on eYFP-C10HRas in tsA201 cells at 22°C. Data sets with time lags between 8 and 200 ms were obtained and analyzed as described in the previous subsection, yielding the corresponding mean-square displacements and fractions. The data are summarized in Fig. 3, A–C, and Table 1. The fast diffusing molecules, characterized by the mean-square displacement  , represent the largest fraction of molecules (73 ± 5%). The fraction stays constant for time lags between 8 and 200 ms (Fig. 3 A). The mean-square displacement of this fast fraction followed a linear increase with time predicted for a freely diffusing species,
  (Fig. 3 B, solid line), and is characterized by a diffusion constant of D1 = 0.53 ± 0.02 μm2/s. The other fraction, containing 27 ± 5% of the molecules, exhibited a reduced mobility (Fig. 3 C). Below 75 ms the mean-square displacement increased with time, however, leveling off to a constant value of 2.1 ± 0.4 · 10−2 μm2 for longer time lags.
FIGURE 3.

Results obtained from the square displacement distribution analysis (according to Fig. 2) of data taken on tsA201 cells at 22°C (A–C), and data taken on 3T3-A14 cells at 37°C (D–F). The results of the fits are given in Table 1. The error bars represent the standard errors obtained from the fits of the data according to Eq. 2. (A and D) Fractions of the fast component, α, versus tlag for the two cell types studied. (B and E) The mean-square displacements,  of the fast fraction versus tlag. The data are fitted according to a free diffusion model (
 solid line). (C and F) Mean-square displacements,
  , of the slow fraction versus tlag. The data are fitted according to a confined diffusion model (Eq. 3, solid line). The dotted lines in C and F represent the offset due to the limited positional accuracy (see Materials and Methods); they have been omitted in B and E for clarity.
TABLE 1.
Summary of diffusion characteristics
| tsA201 cells, 22°C Single-molecule
|
3T3-A14 cells, 37°C Single-molecule
|
|||||
|---|---|---|---|---|---|---|
| Control | FRAP control | Control | +DMSO | +lat B | + MβCD | |
| α | 0.73 ± 0.05 | 0.73 ± 0.05 | 0.59 ± 0.07 | 0.71 ± 0.10 | 0.67 ± 0.05 | 0.72 ± 0.10 |
| D1 (μm2/s) | 0.53 ± 0.02 | 0.48 ± 0.11 | 1.13 ± 0.09 | 0.89 ± 0.04 | 0.83 ± 0.05 | 0.95 ± 0.06 |
| D0 (μm2/s) | 0.06 ± 0.01 | 0.29 ± 0.12 | 0.23 ± 0.12 | 0.31 ± 0.17 | 0.14 ± 0.08 | |
| L (nm) | 251 ± 35 | 206 ± 35 | 189 ± 45 | 156 ± 35 | 204 ± 67 | |
Such asymptotic behavior is explained by a confined diffusion model. The model assumes that diffusion is free within a square of side length L, which is surrounded by an impermeable, reflecting barrier. In such a model the mean-square displacement depends on L and the initial diffusion constant D0, and varies with tlag as (Kusumi et al., 1993),
 |
(3) |
From a fit of the data to Eq. 3 (solid line in Fig. 3 C) we obtained an instantaneous diffusion constant of D0 = 0.06 ± 0.01 μm2/s and an average domain size of L = 251 ± 35 nm.
FRAP on eYFP-C10HRas in tsA201 cells
In addition to single-molecule microscopy we performed fluorescence recovery after photobleaching (FRAP) experiments to determine if the domains seen in the single-molecule experiments would show up as an immobile fraction in FRAP. Recovery curves (N = 8; for supporting information, see Fig. 5 in the Online Supplement) were fit to the model described in Feder et al. (1996). The analysis yielded an average diffusion coefficient DFRAP = 0.48 ± 0.11 μm2/s and a mobile fraction of 73 ± 5%. The immobile population of 27 ± 5% in the FRAP experiments indicates that the domains observed in the single-molecule experiments are stable on a timescale of tens of seconds (for comparison, see Table 1).
Single-molecule measurements on eYFP-C10HRas in 3T3-A14 cells
To investigate if the domains observed in tsA201 cells were also present in a different cell line, we conducted single-molecule diffusion measurements on a mouse fibroblast cell line (3T3-A14) at 37°C. Data sets with time lags between 5 and 60 ms were obtained. The data are summarized in Fig. 3, D–F. The fast diffusing fraction again contains most molecules, 59 ± 7%, and stays constant between 10 and 60 ms (Fig. 3 D, Table 1). The corresponding mean-square displacement followed a linear increase with time (Fig. 3 E, solid line), characterized by a diffusion constant D1 = 1.13 ± 0.09 μm2/s. The minor fraction (41 ± 7%) of molecules exhibited a confined diffusion behavior. Fit of the data to Eq. 3 yielded an instantaneous diffusion coefficient D0 of 0.29 ± 0.12 μm2/s and an average domain size L = 206 ± 35 nm.
Involvement of actin and cholesterol in the observed domains
To elucidate the nature of the observed domains, two possibilities were investigated: the involvement of the actin cytoskeleton and the hypothesis that the domains were associated with cholesterol-dependent liquid-ordered lipid domains. Actin dependence was tested by treating 3T3-A14 cells with 0.5 μM of latrunculin B, which disrupts microfilament organization (for supporting information, see Fig. 6 in the Online Supplement). Single-molecule measurements (37°C) and diffusion analysis again revealed a fast, free diffusing population and a slower confined diffusing population of molecules (Fig. 4, A–C, Table 1). The diffusion coefficient of the slow fraction (D0 = 0.31 ± 0.17 μm2/s), as well as the domain size (L = 156 ± 35 nm), were not significantly different from the untreated (Fig. 3, D–F) or DMSO-treated controls (dashed lines in Fig. 4, A–C). However, it should be noted that the addition of 0.025% DMSO significantly reduced the diffusion constant of the free diffusing fraction from 1.13 ± 0.09 μm2/s to 0.89 ± 0.04 μm2/s.
FIGURE 4.

Results obtained from the square displacement distribution analysis of data taken on 3T3-A14 cells at 37°C after drug treatment. The fit results obtained for DMSO-treated cells (A–C) and untreated cells (D–F) are shown for comparison as dashed lines, results from the fits are given in Table 1. (A–C) Fraction (A) and mean-squared displacement of the fast (B) and the slow (C) fraction after treatment with 0.5 μM latrunculin B for 30 min. (D–F) Fraction (D), and mean-squared displacement of the fast (E) and the slow (F) fraction after treatment with 5 mM methyl-β-cyclodextrin for 1 h. The dotted lines in C and F represent the offset due to the limited positional accuracy (see Materials and Methods); they have been omitted in B and E for clarity.
The possibility that the observed domains were cholesterol-dependent liquid-ordered domains was tested by incubation of 3T3-A14 cells with 5 mM methyl-β-cyclodextrin for 1 h at 37°C. This treatment results in the extraction of 60% of the cholesterol out of the cellular membranes (for supporting information, see Fig. 7 and Table 2 in the Online Supplement). Single-molecule imaging and diffusion analysis were performed (Fig. 4, D–F), which again revealed two fractions of diffusing molecules. The diffusion coefficient of the confined fraction (D0 = 0.14 ± 0.08 μm2/s) and domain size (L = 204 ± 67 nm) did not differ significantly from untreated cells (dashed lines in Fig. 4, D–F; Table 1). However, the freely mobile fraction increased to α = 72 ± 10% (control: 59 ± 7%) after cholesterol extraction, and the diffusion coefficient of the fast fraction decreased from 1.13 ± 0.09 μm2/s to 0.95 ± 0.06 μm2/s.
DISCUSSION
Our data show that diffusional domains in the cytoplasmic leaflet of the plasma membrane in mammalian cells exist and that proteins anchored to the plasma membrane via the H-Ras membrane anchoring sequence are only partially captured within those domains. The average size of the observed domains was 251 ± 35 nm for human-embryo kidney tsA201 cells. It is interesting to note that the fraction of molecules which exhibits confined diffusion in the single-molecule experiments (27%) in these cells corresponds well to the immobile fraction observed in our FRAP experiments (27%). This similarity strongly suggests that the domains, which are much smaller than the bleaching spot in FRAP (200 nm vs. 1.7 μm), are stable on the timescale of the FRAP recovery lasting up to 10 s. Similar, though smaller (10–13%), immobile fractions have been observed in FRAP experiments on Rat-1 cells expressing a GFP-H-Ras fusion protein (Niv et al., 2002). In earlier studies on the diffusion of membrane-spanning L-type Ca2+ channels in HEK293 cells (Harms et al., 2001b) and studies on 1,2-dioleoyl-sn-glycero-3-{[N(5-amino-1-carboxypentyl)-iminodiacetic-acid]-succinyl} lipids embedded into the exoplasmic leaflet of the plasma membrane of human aorta smooth muscle cells (Harms et al., 2001a), no domains were observed. These results indicate that the ∼200-nm domains observed in the current study are most likely only sensed by proteins anchored in the cytoplasmic leaflet.
The domains in the cytoplasmic leaflet were observed in both mouse fibroblast 3T3-A14 cells and human-embryo kidney tsA201 cells. The size of the domains was independent of cell type. The fraction of molecules inside these domains was significantly larger in 3T3-A14 cells compared to tsA201 cells (41 ± 7% vs. 27 ± 5%), which could be due to cell type-related differences and the different temperatures used. As expected, the diffusion coefficients measured at 37°C are higher compared to those measured at 22°C.
To further elucidate the nature of the observed domains, 3T3-A14 cells were treated with drugs that would potentially disrupt domain organization. Under the assumption that the observed domains are liquid-ordered domains, extraction of 60% cholesterol from the cell membrane should result in a decrease in the size of the observed domains, a decrease of the population of molecules in domains, or a combination of these two effects. This has not been found in our experiments. The fact that the eYFP-C10HRas molecules do not partition in liquid-ordered domains to a significant extent is not completely unexpected. The presence of a branched and multiply unsaturated farnesyl group on the membrane targeting sequence of H-Ras (Fig. 1) does not favor a high partitioning in liquid-ordered domains (Wang et al., 2000, 2001; Melkonian et al., 1999; Wang and Silvius, 2001). However, the implications of this study for the cellular situation are not straightforward, since in cells the farnesyl group might be located outside the bilayer and bound to other membrane-associated molecules (Marom et al., 1995; Paz et al., 2001; Elad-Sfadia et al., 2002). Recent studies using fluorescence resonance energy transfer, likewise revealed that geranylgeranylation only, does not promote clustering in cholesterol- and sphingolipid-rich domains (Zacharias et al., 2002), but results in cholesterol-independent clustering. As palmitoylation is reversible and dynamic (Magee et al., 1987; Baker et al., 2000), it cannot be ruled out that a fraction of the observed eYFP-C10HRas molecules is not fully palmitoylated, resulting in a localization in cholesterol-independent clusters as observed by Zacharias et al. (2002).
However, in recent biochemical studies where the H-Ras membrane-targeting sequence (C-terminal nine amino acids of H-Ras) was fused to GFP (GFP-tH) it was found in the DRM fraction (Prior et al., 2001), indicating the potential affinity for liquid-ordered domains. Additionally, a recent electron microscopy (EM) study showed that GFP-tH is localized in cholesterol-dependent domains with a mean diameter of 44 nm that occupy as much as 35% of the cell surface (Prior et al., 2003). A similar study showed that 44% of the GFP-tH is localized in caveolae (Prior et al., 2001). A direct comparison of the EM-data with the current diffusion study is difficult. As the EM results were obtained on fixed plasma membrane fragments the prefixation structure and dynamical behavior is problematical to infer. An association of the domains found in the present study with those detected by EM seems an attractive possibility. The lack of any cholesterol-dependence and the relatively large size of the domains described in the present study makes this association less likely. However, we cannot entirely exclude that the structures observed in EM do partially account for the domains found here.
To elucidate the possible role of the cortical actin on the organization of the observed domains we applied the actin-polymerization-inhibiting drug latrunculin B. However, the cytoplasmic leaflet-domains observed in this study were not sensitive to latrunculin B, making it unlikely that they are due to the membrane-skeleton fence as proposed by Kusumi and Sako (Kusumi et al., 1993; Fujiwara et al., 2002).
As to the biological function of the observed domains, it was speculated that domains might play a role in separating H-Ras molecules in the inactive (GDP-bound) state from H-Ras molecules in the active (GTP-bound) state (Prior et al., 2001). Recent biochemical data (Prior et al., 2001), indicate that cholesterol-dependent lipid rafts play a major part in this separation function. The results and techniques described in this article provide a starting point to directly investigate the involvement of membrane domains in signaling processes in vivo with high spatial and temporal resolution.
SUPPLEMENTARY MATERIAL
An online supplement to this article can be found by visiting BJ Online at http://www.biophysj.org.
Supplementary Material
Acknowledgments
We thank J. Y. P. Butter for help with FRAP experiments and G. E. M. Lamers for assistance with the control experiments and confocal microscopy. Furthermore, we thank A. A. de Boer for maintenance of the cell cultures. The 3T3-A14 cells were a generous gift from Dr. D. M. Ouwens and Dr. J. A. Maassen, Leiden University Medical Center.
This work was supported by funds from the ALW/FOM program for Physical Biology (99FBK03) of the Nederlands Organisation voor Wetensdupelijk Onderzoek. L.C. acknowledges support from the Délégation General pour l'Armement and the European Marie-Curie fellowship program (IHP-MCFI-1999-00736).
L. Cognet's present address is Centre de Physique Moléculaire Optique et Hertzienne, CNRS UMR 5798 et Université Bordeaux 1, 351 Cours de la Libération, 33405 Talence, France.
G. S. Harms' present address is Rudolf-Virchow-Center for Experimental Biomedicine, Julius-Maximilians University Würzburg, Versbacher Str. 9, 97078 Würzburg, Germany.
References
- Almeida, P. F. F., and W. L. C. Vaz. 1995. Lateral diffusion in membranes. In Handbook of Biological Physics. R. Lipowsky and E. Sackmann, editors. Elsevier/North Holland, Amsterdam, The Netherlands. 305–357.
- Anderson, C. M., G. N. Georgiou, I. E. Morrison, G. V. Stevenson, and R. J. Cherry. 1992. Tracking of cell surface receptors by fluorescence digital imaging microscopy using a charge-coupled device camera. Low-density lipoprotein and influenza virus receptor mobility at 4°C. J. Cell Sci. 101:415–425. [DOI] [PubMed] [Google Scholar]
- Apolloni, A., I. A. Prior, M. Lindsay, R. G. Parton, and J. F. Hancock. 2000. H-ras but not K-ras traffics to the plasma membrane through the exocytic pathway. Mol. Cell. Biol. 20:2475–2487. [DOI] [PMC free article] [PubMed] [Google Scholar]
- Baker, T. L., M. A. Booden, and J. E. Buss. 2000. S-Nitrosocysteine increases palmitate turnover on Ha-Ras in NIH 3T3 cells. J. Biol. Chem. 275:22037–22047. [DOI] [PubMed] [Google Scholar]
- Bobroff, N. 1976. Position measurement with a resolution and noise-limited instrument. Rev. Sci. Instrum. 57:1152–1157. [Google Scholar]
- Brown, D. A., and E. London. 1998. Structure and origin of ordered lipid domains in biological membranes. J. Membr. Biol. 164:103–114. [DOI] [PubMed] [Google Scholar]
- Brown, D. A., and J. K. Rose. 1992. Sorting of GPI-anchored proteins to glycolipid-enriched membrane subdomains during transport to the apical cell surface. Cell. 68:533–544. [DOI] [PubMed] [Google Scholar]
- Dietrich, C., B. Yang, T. Fujiwara, A. Kusumi, and K. Jacobson. 2002. Relationship of lipid rafts to transient confinement zones detected by single particle tracking. Biophys. J. 82:274–284. [DOI] [PMC free article] [PubMed] [Google Scholar]
- Edidin, M. 1997. Lipid microdomains in cell surface membranes. Curr. Opin. Struct. Biol. 7:528–532. [DOI] [PubMed] [Google Scholar]
- Elad-Sfadia, G., R. Haklai, E. Ballan, H.-J. Gabius, and Y. Kloog. 2002. Galectin-1 augments Ras activation and diverts Ras signals to Raf-1 at the expense of phosphoinoside 3-kinase. J. Biol. Chem. 277:37169–37175. [DOI] [PubMed] [Google Scholar]
- Feder, T. J., I. Brust-Mascher, J. P. Slattery, B. Baird, and W. W. Webb. 1996. Constrained diffusion or immobile fraction on cell surfaces: a new interpretation. Biophys. J. 70:2767–2773. [DOI] [PMC free article] [PubMed] [Google Scholar]
- Fujiwara, T., K. Ritchie, H. Murakoshi, K. Jacobson, and A. Kusumi. 2002. Phospholipids undergo hop diffusion in compartmentalized cell membrane. J. Cell Biol. 157:1071–1081. [DOI] [PMC free article] [PubMed] [Google Scholar]
- Hancock, J. F., H. Paterson, and C. J. Marshall. 1990. A polybasic domain or palmitoylation is required in addition to the CAAX motif to localize p21ras to the plasma membrane. Cell. 63:133–139. [DOI] [PubMed] [Google Scholar]
- Harms, G. S., L. Cognet, P. H. Lommerse, G. A. Blab, and T. Schmidt. 2001a. Autofluorescent proteins in single-molecule research: applications to live cell imaging microscopy. Biophys. J. 80:2396–2408. [DOI] [PMC free article] [PubMed] [Google Scholar]
- Harms, G. S., L. Cognet, P. H. Lommerse, G. A. Blab, H. Kahr, R. Gamsjager, H. P. Spaink, N. M. Soldatov, C. Romanin, and T. Schmidt. 2001b. Single-molecule imaging of l-type Ca2+ channels in live cells. Biophys. J. 81:2639–2646. [DOI] [PMC free article] [PubMed] [Google Scholar]
- Jacobson, K., E. D. Sheets, and R. Simson. 1995. Revisiting the fluid mosaic model of membranes. Science. 268:1441–1442. [DOI] [PubMed] [Google Scholar]
- Kusumi, A., and Y. Sako. 1996. Cell surface organization by the membrane skeleton. Curr. Opin. Cell Biol. 8:566–574. [DOI] [PubMed] [Google Scholar]
- Kusumi, A., Y. Sako, and M. Yamamoto. 1993. Confined lateral diffusion of membrane receptors as studied by single particle tracking (nanovid microscopy). Effects of calcium-induced differentiation in cultured epithelial cells. Biophys. J. 65:2021–2040. [DOI] [PMC free article] [PubMed] [Google Scholar]
- Magee, A. I., L. Gutierrez, I. A. McKay, C. J. Marshall, and A. Hall. 1987. Dynamic fatty acylation of p21N-ras. EMBO J. 6:3353–3357. [DOI] [PMC free article] [PubMed] [Google Scholar]
- Marom, M., R. Haklai, G. Ben-Baruch, D. Marciano, Y. Egozi, and Y. Kloog. 1995. Selective inhibition of Ras-dependent cell growth by farnesylthiosalisylic acid. J. Biol. Chem. 270:22263–22270. [DOI] [PubMed] [Google Scholar]
- Melkonian, K. A., A. G. Ostermeyer, J. Z. Chen, M. G. Roth, and D. A. Brown. 1999. Role of lipid modifications in targeting proteins to detergent-resistant membrane rafts. Many raft proteins are acylated, while few are prenylated. J. Biol. Chem. 274:3910–3917. [DOI] [PubMed] [Google Scholar]
- Niv, H., O. Gutman, Y. Kloog, and Y. I. Henis. 2002. Activated K-Ras and H-Ras display different interactions with saturable nonraft sites at the surface of live cells. J. Cell Biol. 157:865–872. [DOI] [PMC free article] [PubMed] [Google Scholar]
- Paz, A., R. Haklai, G. Elad-Sfadia, E. Ballan, and Y. Kloog. 2001. Galectin-1 binds oncogenic H-Ras to mediate Ras membrane anchorage and cell transformation. Oncogene. 20:7486–7493. [DOI] [PubMed] [Google Scholar]
- Pralle, A., P. Keller, E. L. Florin, K. Simons, and J. K. Hörber. 2000. Sphingolipid-cholesterol rafts diffuse as small entities in the plasma membrane of mammalian cells. J. Cell Biol. 148:997–1008. [DOI] [PMC free article] [PubMed] [Google Scholar]
- Prior, I. A., A. Harding, J. Yan, J. Sluimer, R. G. Parton, and J. F. Hancock. 2001. GTP-dependent segregation of H-ras from lipid rafts is required for biological activity. Nat. Cell Biol. 3:368–375. [DOI] [PubMed] [Google Scholar]
- Prior, I. A., C. Muncke, R. G. Parton, and J. F. Hancock. 2003. Direct visualization of Ras proteins in spatially distinct cell surface microdomains. J. Cell Biol. 160:165–170. [DOI] [PMC free article] [PubMed] [Google Scholar]
- Schmidt, T., G. J. Schütz, W. Baumgartner, H. J. Gruber, and H. Schindler. 1995. Characterization of photophysics and mobility of single molecules in a fluid lipid membrane. J. Phys. Chem. 99:17662–17668. [Google Scholar]
- Schütz, G. J., G. Kada, V. P. Pastushenko, and H. Schindler. 2000. Properties of lipid microdomains in a muscle cell membrane visualized by single molecule microscopy. EMBO J. 19:892–901. [DOI] [PMC free article] [PubMed] [Google Scholar]
- Schütz, G. J., H. Schindler, and T. Schmidt. 1997. Single-molecule microscopy on model membranes reveals anomalous diffusion. Biophys. J. 73:1073–1080. [DOI] [PMC free article] [PubMed] [Google Scholar]
- Sheets, E. D., G. M. Lee, R. Simson, and K. Jacobson. 1997. Transient confinement of a glycosylphosphatidylinositol-anchored protein in the plasma membrane. Biochemistry. 36:12449–12458. [DOI] [PubMed] [Google Scholar]
- Sheetz, M. P. 1995. Cellular plasma membrane domains. Mol. Membr. Biol. 12:89–91. [DOI] [PubMed] [Google Scholar]
- Simons, K., and E. Ikonen. 1997. Functional rafts in cell membranes. Nature. 387:569–572. [DOI] [PubMed] [Google Scholar]
- Simons, K., and D. Toomre. 2000. Lipid rafts and signal transduction. Nature Rev. 1:31–39. [DOI] [PubMed] [Google Scholar]
- Simson, R., B. Yang, S. E. Moore, P. Doherty, F. S. Walsh, and K. A. Jacobson. 1998. Structural mosaicism on the submicron scale in the plasma membrane. Biophys. J. 74:297–308. [DOI] [PMC free article] [PubMed] [Google Scholar]
- Singer, S. J., and G. L. Nicolson. 1972. The fluid mosaic model of the structure of cell membranes. Science. 175:720–731. [DOI] [PubMed] [Google Scholar]
- Varma, R., and S. Mayor. 1998. GPI-anchored proteins are organized in submicron domains at the cell surface. Nature. 394:798–801. [DOI] [PubMed] [Google Scholar]
- Wang, T. Y., R. Leventis, and J. R. Silvius. 2000. Fluorescence-based evaluation of the partitioning of lipids and lipidated peptides into liquid-ordered lipid microdomains: a model for molecular partitioning into “lipid rafts.” Biophys. J. 79:919–933. [DOI] [PMC free article] [PubMed] [Google Scholar]
- Wang, T. Y., R. Leventis, and J. R. Silvius. 2001. Partitioning of lipidated peptide sequences into liquid-ordered lipid domains in model and biological membranes. Biochemistry. 40:13031–13040. [DOI] [PubMed] [Google Scholar]
- Wang, T. Y., and J. R. Silvius. 2001. Cholesterol does not induce segregation of liquid-ordered domains in bilayers modeling the inner leaflet of the plasma membrane. Biophys. J. 81:2762–2773. [DOI] [PMC free article] [PubMed] [Google Scholar]
- Zacharias, D. A., J. D. Violin, A. C. Newton, and R. Y. Tsien. 2002. Partitioning of lipid-modified monomeric GFPs into membrane microdomains of live cells. Science. 296:913–916. [DOI] [PubMed] [Google Scholar]
Associated Data
This section collects any data citations, data availability statements, or supplementary materials included in this article.