Abstract
Circular dichroism (CD) spectra of meso-tetrakis(N-methylpyridinium-4-yl)porphyrin (TMPyP) that are associated with various duplex and triplex AT oligomers were investigated in this study. A strong positive CD was apparent for both the TMPyP complexed with duplex d[(A-T)12]2, d(A)12·d(T)12 and triplex d(A)12·d[(T)12]2 at a low mixing ratio. As the mixing ratio increased, bisignate excitonic CD was produced for TMPyP complexed with duplexes, whereas the positive CD signal remained the same for the TMPyP-d(A)12·d[(T)12]2 complex. This difference in the CD spectrum in the presence of duplex and triplex oligomers indicates that the moderate stacking of TMPyP occurs at the major groove of the duplex and the monomeric binding occurs in (or near) the minor groove. When TMPyP forms a complex with duplex d[(A-T)6]2 only excitonic CD was observed, even at a very low mixing ratio. Therefore, at least seven or more basepairs are required for TMPyP to exhibit a monomeric CD spectrum. After close analysis of the CD spectrum, the TMPyP-poly[d(A-T)2] complex could be explained by a combination of the CD spectrum of the monomeric, moderately stacked, and extensively stacked TMPyP.
INTRODUCTION
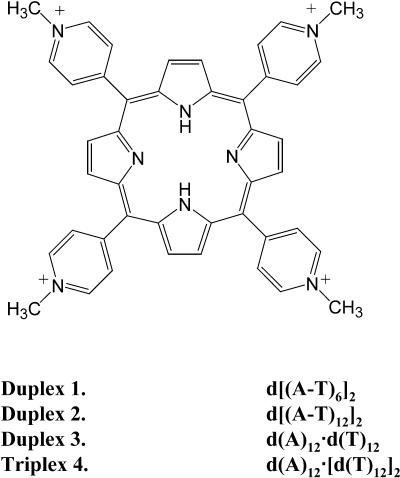
The interaction between DNA and porphyrins has been studied intensively for the potential applications in cancer chemotherapy and its unique DNA binding properties (for review, see Fiel, 1989; Marzilli, 1990; Pasternack and Gibbs, 1996). Several binding modes of porphyrin to DNA have been reported, including intercalation, outside-binding (Fiel, 1989; Marzilli, 1990; Pasternack and Gibbs, 1996), and groove binding (Kuroda and Tanaka, 1994; Sehlstedt et al., 1994; Schneider and Wang, 1994; Lipscomb et al., 1996; Yun et al., 1998; Lee et al., 2002a). In general, the flat porphyrin free-base intercalates into GC-rich regions (Fiel, 1989; Strickland et al., 1990). NMR studies have shown that the intercalation occurs at the 5′CG3′ site, not at the 3′CG5′ or other sites (Marzilli et al., 1986; Guliaev and Leontis, 1999). The groove binding mode of porphyrin has been reported mainly based on the extensive circular and linear dichroism studies (Kuroda and Tanaka, 1994; Sehlstedt et al., 1994; Schneider and Wang, 1994; Lipscomb et al., 1996; Yun et al., 1998; Lee et al., 2001, 2002a). For instance, the groove binding mode seemed to be a preferable mode when the meso-tetrakis(N-methylpyridinium-4-yl)porphyrin (referred to as TMPyP in this study, Fig. 1) forms a complex with AT rich DNA at low porphyrin to DNA base ratios. In the groove binding mode, whether or not the side of the porphyrin ring fits into the narrow minor groove or whether porphyrin locates in the major groove still remains to be clarified.
FIGURE 1.
Molecular structure of TMPyP and the oligomers used in this work.
The outside-binding that occurs, in general, at AT sites is divided into two categories, namely, outside-stacking and outside-random binding. The outside-random binding mode, in which positively charged porphyrin interacts with negatively charged phosphate groups of DNA by electrostatic interaction, has been reported (Carvlin et al., 1982; Carvlin and Fiel, 1983; Banville et al., 1986). On the other hand, the majority of the porphyrins either moderately or extensively stacks outside of the DNA stem. The extensively stacked porphyrin is related to the inducing of the DNA aggregation. The porphyrins that have been known to stack outside of the DNA include meso-tetrakis(p-tri-N-methyl-pyridiniumyl)porphyrin (Marzilli et al., 1986; Banville et al., 1986; LeDoan et al., 1987), meso-tetrakis[4-[3-(trimethylammonio)prophyloxy]phenyl]porphyrin (Mukundan et al., 1994, 1995), trans-bis(N-methylpyridinium-4-yl)diphenyl porphyrin (Pasternack et al., 1998; Ismail et al., 2000), and some copper(II)porphyrins (Pasternack et al., 2001). Despite the extensive studies on the outside-stacking of porphyrin to DNA, the exact location where the stacking occurs still remains undetermined.
In this study, the CD spectra in the Soret absorption band of the TMPyP-AT oligomers were investigated. Particularly, the CD spectra of the TMPyP complexed with various duplexes and the triplex were compared. In the triplex, the Hoogsteen basepaired dT strand blocks the major groove of the duplex. Therefore, if TMPyP is located in the major groove of the duplex, alteration in the CD properties are to be expected. Similar approaches have been taken to investigate the location of drugs in the DNA complex (Kim and Nordén, 1993; Kim et al., 1996; Choi et al., 1997). The spectral properties of TMPyP bound to two oligomers with different lengths, namely, d[(A-T)6]2 and d[(A-T)12]2, were also compared to investigate the effect of the length of the oligomers on the stacking/groove binding preferentiality of TMPyP. The oligomers used in this study are shown in Fig. 1.
MATERIALS AND METHODS
TMPyP was purchased from Midcentury (Chicago, IL) and used without further purification. Its extinction coefficient was determined spectrophotometrically as ɛ424nm = 2.26 × 105 cm−1M−1 in 1 mM cacodylate buffer, pH 7.0. This buffer was used throughout this study. Therefore, in the following text, 0 mM NaCl indicates that 1 mM Na+ is present in the solution that comes from the counterion of the cacodylate molecule. A 100-mM NaCl indicates 101 mM Na+ ion is present in the solution (100 mM from NaCl and 1 mM from the buffering molecule). Oligonucleotides were a gift from Professor Nicholas E. Geacintov, Chemistry Department, New York University. The triple helical d(A)12·[d(T)12]2 was stabilized by simmering the mixture of 1:2 molar amount of d(A)12 and d(T)12 in the presence of 1 mM MgCl2 and 20 mM NaCl followed by overnight annealing at 5°C. The formation of the proper duplex and triplex were ensured by their characteristic melting profiles and CD spectra. The mixing ratio R in this study is defined by the ratio [porphyrin]/[oligomer] concentration; thus, the mixing ratio of 1 (R = 1) indicates one porphyrin molecule per oligomer. In other words, R = 1 indicates 1 porphyrin per 12 basepairs and base triplets for the 12mer duplex and triplex, respectively, and 1 porphyrin per 6 basepairs for 6mers. The appearance of spectra for the porphyrin-DNA system is affected by the order of mixing (Ismail et al., 2000). Therefore, in this study, aliquots of concentrated TMPyP (typically ∼200 μM) were always added last to the DNA solution. All measurements were performed at 5°C, unless otherwise specified. CD spectra were recorded on a Jasco J715 spectropolarimeter and absorption spectra on a Jasco V550 spectrophotometer, (Jasco, Tokyo, Japan). CD spectra were averaged over an appropriate number of scans when necessary.
RESULTS
Self-stacking of TMPyP in aqueous solution
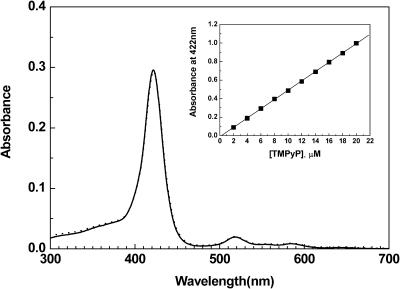
It has been known that some porphyrins stack by themselves in aqueous solution (Ismail et al., 2000; Pasternack et al., 2001) and produce hypochromism in the Soret absorption region. The extent of the self-stacking depends on the salt and porphyrin concentration. Therefore, whether TMPyPs stack by themselves in our condition was evaluated by the absorption spectrum. The spectra were identical in the presence and absence of 100 mM NaCl (Fig. 2), indicating that the presence of up to 100 mM NaCl did not induce the self-stacking of TMPyP. The absorbance at 422 nm, which is the absorption maximum of TMPyP, obeys the Beer-Lambert law, indicating that the concentration dependence of the self-stacking can also be ignored (Fig. 2, inset). The difference in the ability to stack may be attributed to the difference in the number of charges on the porphyrin ring.
FIGURE 2.
Absorption spectrum of 6.36 μM TMPyP in the presence (dashed curve) and absence (solid curve) of 100 mM NaCl. (Inset) Absorbance at 422 nm of TMPyP with respect to the concentration in the presence of 0 mM NaCl.
FIGURE 3.
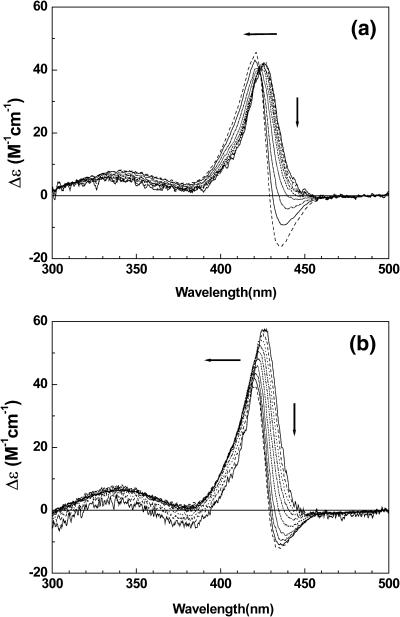
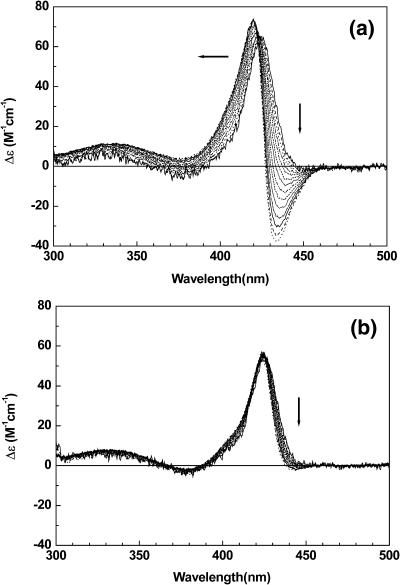
The mixing ratio dependent CD spectrum of TMPyP bound to duplex 2 at [NaCl] = 0 mM (a) and 100 mM (b). To the direction of arrow R = 0.4, 0.6, 0.8, 1.0, 1.2, 1.4, 1.6, 2.0, and 2.2. [oligomer] = 5.0 μM.
Effect of the length of AT duplex on TMPyP stacking
Fig. 3 depicts the mixing-ratio–dependent CD spectrum of TMPyP in the presence of duplex 2 at the two representative NaCl concentrations. At a low salt concentration and low mixing ratios (0 mM, Fig. 3 a), a monomeric positive CD band in the Soret band is apparent with a maximum at ∼425 nm. As the mixing ratio increases, the bisignate excitonic CD spectrum becomes more significant with its negative minimum at ∼435 nm and the positive maximum 421 nm. This shift in the equilibrium produces an isodichroic point at ∼423 nm, suggesting that only two species of TMPyP exist in the system, unless the CD spectra of porphyrins with different binding modes are coincidentally identical. Similar mixing-ratio–dependent behavior was observed in the presence of 100 mM NaCl (Fig. 3 b). However, the intensity of the monomeric CD is lower and the intensity of the excitonic CD is higher than those recorded at 0 mM NaCl. This difference may be understood either by the different portions of the duplex at various NaCl concentrations or by preferentiality of the monomeric TMPyP in the presence of salt. The ratio (ΔA/A)260nm of the oligomer 2 at 0 mM NaCl was ∼20% whereas that at 100 mM was ∼30% (data not shown).
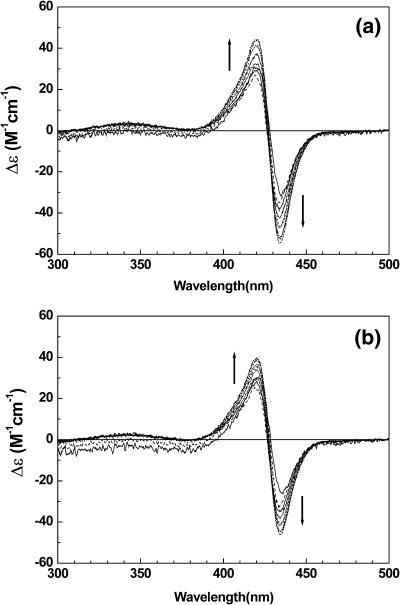
The CD spectra of the TMPyP-duplex 1 at 0 and 100 mM NaCl are depicted in Fig. 4. At both salt concentrations, the monomeric CD was not observed (Fig. 4 a: 0 mM NaCl; Fig. 4 b: 100 mM NaCl). As the mixing ratio increases, the intensity of the excitonic CD shows the tendency to increase. At a mixing ratio as low as R = 0.2 (which corresponds to one TMPyP per five duplexes), no evidence for the monomeric CD was observed. This observation is surprising in the sense that the only difference between duplex 1 and 2 is their length; that is, duplex 1 has 6 AT basepairs, whereas duplex 2 has 12 basepairs. The locations of the negative minimum (435 nm) and the positive maximum (421 nm) are identical to those of the TMPyP-duplex 2 complex, suggesting that the pattern of stacking on duplex 1 and 2 is similar.
FIGURE 4.
The mixing ratio dependent CD spectrum of TMPyP bound to duplex 1 at [NaCl] = 0 mM (a) and 100 mM (b). Conditions are the same as in Fig. 3.
Effect of the nature of the template oligomers on TMPyP stacking
The appearance of the mixing-ratio–dependent CD spectrum of the TMPyP-duplex 3 complex is quite similar to that of the TMPyP-duplex 2 complex; the monomeric behavior is apparent at a low mixing ratio, and the contribution of the excitonic CD becomes more important as the mixing ratio increases(Fig. 5 a). The appearance of excitonic CD of the TMPyP-duplex 3 is similar to those complexed with duplex 1 and 2, although the arrangement of the bases is different. This observation is in contrast with the results obtained by Lee et al. (2002a) from the TMPyP-poly[d(A-T)2] and the TMPyP-poly(dA)·poly(dT) complex. They reported that the sign of excitonic CD depends on the order of the DNA bases; the CD spectrum of TMPyP complexed with poly[d(A-T)2] is characterized by a negative band at short wavelengths followed by a positive band at long wavelengths. On the other hand, TMPyP complexed with poly(dA)·poly(dT) has been reported to exhibit the excitonic CD, which is opposite in the order of sign to the TMPyP-poly[d(A-T)2] complex.
FIGURE 5.
The mixing-ratio–dependent CD spectrum of TMPyP bound to duplex 3 (a) and triplex 4 (b) at 0 mM NaCl. The triplex 4 contains 1 mM MgCl2 to stabilize the triplex. [duplex] = [triplex] =5 μM. To the arrow direction, R = 0.2, 0.4, 0.6, 0.8, 1.0, 1.2, 1.4, 1.6, 1.8, 2.0, 2.2, 2.4, 2.6, and 3.0. The presence of MgCl2 did not affect the absorption spectrum of the oligomer-free TMPyP.
When TMPyP forms a complex with the triplex 4, in which the major groove is blocked by the third strand d(T)12, TMPyP exhibits only the monomeric CD in the Soret absorption band of up to a mixing ratio of 3, i.e., three TMPyPs per triplex 4 (Fig. 5 b). The CD spectrum is characterized by a positive peak at 424 nm and a shoulder around 410 nm, which is identical to that obtained from the TMPyP-duplex 3 complex at a low binding ratio. Since the minor groove of duplex 3 is similar to that of the triplex while the major groove is blocked by the third dT strand, this observation is strong evidence that the monomeric TMPyP is associated with both the triplex and duplex in the minor groove. If TMPyP is bound in the major groove of the duplex, a large alteration in its spectral properties or removal of TMPyP would be expected by blocking the major groove. A negative CD band in the 430–440 nm region starts to appear at a mixing ratio of 4.0 (data not shown), suggesting that the overpopulated TMPyPs start to replace the third strand.
CD spectrum of the TMPyP-poly[d(A-T)2] complex
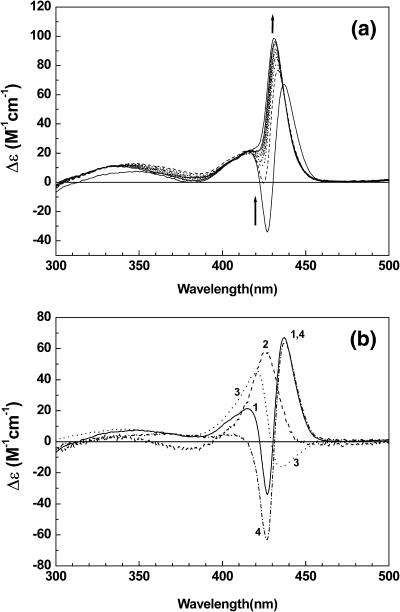
In general, the CD spectrum of the TMPyP-poly[d(A-T)2] complex at a low mixing ratio consists of two positive CD bands: a small band (or shoulder) at short wavelengths followed by a relatively strong band at long wavelengths (Kuroda et al., 1994; Lee et al., 2001, 2002a). Appearance of this CD species (Fig. 6 a) has been reported to depend on the salt concentration (Lee et al., 2002b). At a low salt concentration, not only were two positive bands apparent at 416 nm and 437 nm, but also a strong negative band at ∼427 nm. The positive band at the short wavelength remained despite the increasing salt concentrations of up to 200 mM, whereas the one at the long wavelength shifts to a short wavelength of 431 nm. The CD spectra of the TMPyP-poly[d(A-T)2] complex can be decomposed into three parts, namely, monomeric, moderately stacked, and extensively stacked TMPyP. For instance, the CD spectrum of the TMPyP-poly[d(A-T)2] complex at 0 mM NaCl (curve 1 in Fig. 6 a) was the best accounted for by the combination that (curve 4) = curve 1 − (0.42 × curve 2) + (0.30 × curve 3) (Fig. 6 b). Here, curve 1 is the measured CD spectrum of the TMPyP-poly[d(A-T)2] complex in the presence of 0 mM NaCl, and curves 2 and 3 are the CD spectra of the TMPyP-duplex 2 complex at the lowest and the highest mixing ratios; hence, they are assumed as monomer and moderately stacked TMPyP, respectively. The coefficients were determined from the assumption that the CD spectrum (curve 4) of extensively stacked TMPyP may be antisymmetric, i.e., the intensity of the negative and positive CD bands is the same.
FIGURE 6.
(a) NaCl concentration dependent CD spectrum of the TMPyP-poly[d(A-T)2] complex. [poly[d(A-T)2]] = 200 μM in nucleobase, [TMPyP] = 10 μM. For the arrow direction, the concentration of NaCl is 0, 1, 4, 14, 30, 50, 80, 100, and 200 mM. (b) CD spectrum of the TMPyP-poly[d(A-T)2] complex in the presence of 0 mM NaCl (curve 1), TMPyP-duplex 2 complex at R = 0.4 (curve 2) and 2.2 (curve 3). Curve 4 = curve 1 − (0.42 × curve 2) + (0.30 × curve 3). See text.
DISCUSSION
Location of the monomeric and excitonic TMPyP on the AT template
The presence of the d(T)12 strand that lies in the major groove of duplex 3, running parallel to the d(A)12, is expected to change the binding mode (Eimer and Nordén, 1995) or inhibit the binding of major groove interacting drugs (Kim and Nordén, 1993). On the other hand, the spectral properties of the intercalators and the minor groove binding drugs (4′,6-diamidino-2-phenylindole (DAPI) and Hoechst 33258) in the presence of duplex poly(dA)·poly(dT) and triplex poly(dA)·[poly(dT)]2 are similar (Kim et al., 1996, 1997). These observations clearly indicate that the binding mode of the intercalator and the minor groove binding drugs was not affected by the presence of the third strand. In the TMPyP-duplex 3 complex case, the excitonic bisignate CD spectrum that may correspond to the moderate stacking of TMPyP (see the next section for the discussion of the moderate and extensive stacking of TMPyP) is visible (Fig. 5 a). The presence of the third strand results in the disappearance of this excitonic species (Fig. 5 b), indicating that the stacking of TMPyP occurs in the major groove of duplex 3. However, TMPyP, which exhibits a strong positive CD band in the Soret band at a low TMPyP/oligomer ratio, remains even in the presence of the third strand, indicating that the monomeric TMPyP species locates in (or near) the minor groove of duplex 3 and triplex 4. A similar CD spectrum for TMPyP-duplex 2 suggests that the binding mode of TMPyP is similar for duplex 2 and 3. The minor groove binding mode for the TMPyP-poly[d(A-T)2] complex at a low [drug]/[nucleobase] was reported to exhibit a similar positive CD band (Kuroda and Tanaka, 1994; Yun et al., 1998; Lee et al., 2001, 2002a; Lee et al., 2002b).
The effect of oligomer length and salt concentration on the exciton formation
In comparison of duplex 1 and 2 (Figs. 4 a and 3 a, respectively), which consist of 6 and 12 A-T basepairs, respectively, we concluded that a certain length of the oligomer is necessary for TMPyP to form a monomeric complex. When there is enough space, which should be longer than six basepairs, TMPyP prefers to bind in (or surface at) the minor groove as a monomer. As the TMPyP concentration increases, the stacking starts to dominate. Formation of TMPyP stacking is evidently accompanied by a decrease in the population of the monomeric component, which is especially pronounced for the TMPyP-duplex 2 complex at a low NaCl concentration. On the same duplex 2 templates, the CD signal of the monomeric TMPyP is stronger in the presence of a high salt concentration (Fig 3, a and b). The preferentiality of the monomeric TMPyP at the high salt concentration may be the result of the abundant duplex, as previously mentioned.
Water-soluble porphyrins and their Cu(II) complex (Gibbs et al., 1988; Pasternack et al., 1991, 1993, 2001), and porphyrins with tentacle periphery substituents (Mukundan et al., 1994, 1995) have been reported to stack on the DNA template either moderately or extensively. The extensively self-stacked form favored high mixing ratios and high salt concentrations. The shape and intensity of the CD signal of the organized array of stacked porphyrins were best accounted for by an electric field produced by a coupling of one oscillating dipole with the other dipoles (Pasternack et al., 1993). In the extensive arrays of the porphyrin-DNA complex, 103–106 porphyrin molecules were contained (Pasternack et al., 2001). Therefore, it seems obvious that the excitonic CD observed for the TMPyP-oligomer complex in our condition is not due to the extensively stacked form of porphyrins.
The appearance of the CD spectrum of the TMPyP-poly[d(A-T)2] complex depends on the mixing ratio (Lee et al., 2001; Lee et al., 2002b) and the NaCl concentration (Fig. 6 a). Two positive bands of the TMPyP-poly[d(A-T)2] complex that appear at a low mixing ratio were attributed to the coexistence of the TMPyP that binds in the minor and major groove (Kuroda and Tanaka, 1994), or to TMPyP that locates in (or near) the minor groove (Lee et al., 2001). However, the combination of the CD spectrum of moderately stacked (in the major groove) and monomeric TMPyP (in the minor groove) could also be a possible option. As the concentration of NaCl decreases, a new negative band in the CD spectrum appears (bottom curve in Fig. 6 a and curve 1 in Fig. 6 b) that cannot be explained by any combination of these two CD spectra. Subtraction of the proper amount of monomeric (curve 2, Fig. 6 b) and excitonic CD (curve 3, Fig. 6 b) results in the appearance of a new CD band (curve 4, Fig. 6 b), its order of the negative and positive band opposite to the excitonic CD spectrum of the moderately stacked TMPyP (curve 3, Fig. 6 b). Although the CD spectral feature of this species is not ambiguous because the coefficients of the monomeric and excitonic CD are arbitrary, the shape is similar to that observed for the TMPyP-poly[d(A-T)2] complex at a high mixing ratio (Lee et al., 2001). Therefore, this CD species may be assigned to TMPyP that is extensively stacked on the poly[d(A-T)2] template.
Acknowledgments
This study was supported by a Yeungnam University internal research grant (2002) conferred to the Advance Research Center for Gene Selective Reaction.
Byeong Hwa Yun's present address is Chemistry Dept., New York University, New York, NY 10003 USA.
References
- Banville, D. L., L. G. Marzilli, J. A. Strickland, and W. D. Wilson. 1986. Comparison of the effects of cationic porphyrins on DNA properties: influence of GC content of native and synthetic-polymers. Biopolymers. 25:1837–1858. [DOI] [PubMed] [Google Scholar]
- Carvlin, M. J., N. Datta-Gupta, and R. J. Fiel. 1982. Circular dichroism spectroscopy of a cationic porphyrin bound to DNA. Biochem. Biophys. Res. Commun. 108:66–73. [DOI] [PubMed] [Google Scholar]
- Carvlin, M. J., and R. J. Fiel. 1983. Intercalative and nonintercalative binding of large cationic porphyrin ligands to calf thymus DNA. Nucleic Acids Res. 11:6121–6139. [DOI] [PMC free article] [PubMed] [Google Scholar]
- Choi, S. D., M. S. Kim, S. K. Kim, P. Lincoln, E. Tuite, and B. Nordén. 1997. Binding mode of [ruthenium(II) (1,10-phenanthroline)2L]2+ with poly(dT*dA-dT) triplex. Ligand size effect on third-strand stabilization. Biochemistry. 36:214–223. [DOI] [PubMed] [Google Scholar]
- Eimer, T., and B. Nordén. 1995. Intercalative interaction of ethidium dyes with triplex structure. Bioorg. Med. Chem. 3:701–711. [DOI] [PubMed] [Google Scholar]
- Fiel, R. J. 1989. Porphyrin-nucleic acid interactions: a review. J. Biomol. Struct. Dyn. 6:1259–1274. [DOI] [PubMed] [Google Scholar]
- Gibbs, E. J., I. Tinoco, Jr., M. F. Maestre, P. A. Ellinas, and R. F. Pasternack. 1988. Self-assembly of porphyrins on nucleic acid templates. Biochem. Biophys. Res. Commun. 157:350–358. [DOI] [PubMed] [Google Scholar]
- Guliaev, A. B., and N. B. Leontis. 1999. Cationic 5,10,15,20-tetrakis(N-methylpyridinium-4-yl)porphyrin fully intercalates at 5′-CG-3′ steps of duplex DNA in solution. Biochemistry. 38:15425–15437. [DOI] [PubMed] [Google Scholar]
- Ismail, M. A., P. M. Rodger, and A. Rodger. 2000. Drug self-assembly on DNA: sequence effects with trans-bis(4-N-methylpyridiniumyl)diphenyl porphyrin and Hoechst. 33258. J. Biomol. Struct. Dyn. Conversation. 11:335–348. [DOI] [PubMed] [Google Scholar]
- Kim, H. K., J. M. Kim, S. K. Kim, A. Rodger, and B. Nordén. 1996. Interactions of intercalative and minor groove binding ligands with triplex poly(dA)·[poly(dT)2] and with duplex poly(dA)·poly(dT) and poly[d(A-T)2] studied by CD, LD, and normal absorption. Biochemistry. 35:1187–1194. [DOI] [PubMed] [Google Scholar]
- Kim, S. K., and B. Nordén. 1993. Methyl green: a DNA major-groove binding drug. FEBS Lett. 315:61–64. [DOI] [PubMed] [Google Scholar]
- Kim, S. K., J. S. Sun, T. Garestier, C. Hélène, C. H. Nguyen, E. Bisagni, A. Rodger, and B. Nordén. 1997. Binding geometries of triple helix selective benzopyrido[4,3b]indole ligands complexed with double- and triple-helical polynucleotides. Biopolymers. 42:101–111. [Google Scholar]
- Kuroda, R., and H. Tanaka. 1994. DNA-porphyrin interactions probed by induced CD spectroscopy. J. Chem. Soc. Chem. Commun. 1575–1576.
- LeDoan, T., C. Perrouault, M. Chassignol, N. T. Thung, and C. Hélène. 1987. Sequence-targeted chemical modifications of nucleic acids by complementary oligonucleotides covalently linked to porphyrins. Nucleic Acids Res. 15:8643–8659. [DOI] [PMC free article] [PubMed] [Google Scholar]
- Lee, S., S. H. Jeon, B. J. Kim, S. W. Han, H. G. Jang, and S. K. Kim. 2001. Classification of CD and absorption spectra in the Soret band of H2TMPyP bound to various synthetic polynucleotides. Biophys. Chem. 92:35–45. [DOI] [PubMed] [Google Scholar]
- Lee, S., Y. A. Lee, H. M. Lee, J. Y. Lee, D. H. Kim, and S. K. Kim. 2002a. Rotation of periphery methylpyridine of meso-tetrakis(n-N-methylpyridiniumyl)porphyrin (n = 2,3,4) and its selective binding to native and synthetic DNAs. Biophys. J. 83:371–381. [DOI] [PMC free article] [PubMed] [Google Scholar]
- Lee, Y. A., S. Lee, T. S. Cho, C. Kim, S. W. Han, and S. K. Kim. 2002b. Binding mode of meso-tetrakis( N-methylpyridinium-4-yl)porphyrin to poly[d(I-C)2]: effect of amino group at the minor groove of poly[d(G-C)2] on the porphyrin-DNA interaction. J. Phys. Chem. B. 106:11351–11355. [Google Scholar]
- Lipscomb, L. A., F. X. Zhou, S. R. Presnell, R. J. Woo, M. E. Peek, R. R. Plaskon, and L. D. Williams. 1996. Structure of a DNA-porphyrin complex. Biochemistry. 35:2818–2823. [DOI] [PubMed] [Google Scholar]
- Marzilli, L. G. 1990. Medical aspects of DNA-porphyrin interactions. New J. Chem. 14:409–420. [Google Scholar]
- Marzilli, L. G., L. D. Banville, G. Zon, and W. D. Wilson. 1986. Pronounced H-1 and P-31 NMR spectral changes on meso-tetrakis(N-methylpyridinium-4-yl)porphyrin binding to poly[d(G-C)]·poly[d(G-C)] and to 3-tetradecaoligodeoxyribonucleotides: evidence for symmetric, selective binding to 5′CG3′ sequences. J. Am. Chem. Soc. 108:4188–4192. [Google Scholar]
- Marzilli, L. G., G. Pethö, M. Kin, M. S. Kim, and D. W. Dixon. 1992. Tentacle porphyrins: DNA interactions. J. Am. Chem. Soc. 114:7575–7577. [Google Scholar]
- Mukundan, N. E., G. Pethö, D. W. Dixon, M. S. Kim, and L. G. Marzilli. 1994. Interactions of an electron-rich tetracationic tentacle porphyrin with calf thymus DNA. Inorg. Chem. 33:4676–4687. [Google Scholar]
- Mukundan, N. E., G. Pethö, D. W. Dixon, and L. G. Marzilli. 1995. DNA-tentacle porphyrin interactions: AT over GC selectivity exhibited by an outside binding self-stacking porphyrin. Inorg. Chem. 34:3677–3687. [Google Scholar]
- Pasternack, R. F., C. Bustamante, P. J. Collings, A. Giannetto, and E. J. Gibbs. 1993. Porphyrin assemblies on DNA as studied by a resonance light-scattering technique. J. Am. Chem. Soc. 115:5393–5399. [Google Scholar]
- Pasternack, R. F., S. Ewen, A. Rao, A. S. Meyer, M. A. Freedman, P. J. Collings, S. L. Frey, M. C. Ranen, and J. C. de Paula. 2001. Interaction of copper(II) porphyrins with DNA. Inorg. Chim. Acta. 317:59–71. [Google Scholar]
- Pasternack, R. F., A. Giannetto, P. Pagano, and E. J. Gibbs. 1991. Self-assembly of porphyrin on nucleic acids and polypeptides. J. Am. Chem. Soc. 113:7799–7800. [Google Scholar]
- Pasternack, R. F., and E. J. Gibbs. 1996. Porphyrin and metalloporphyrin interactions with nucleic acids. In Metal Ions in Biological Systems 33. Probing of Nucleic Acids by Metal Complexes of Small Molecules. A. Sigel and H. Sigel, editors. Marcel Dekker, New York. 367-397. [PubMed]
- Pasternack, R. F., J. I. Goldsmith, and E. J. Gobbs. 1998. A spectroscopic and thermodynamic study of porphyrin/DNA supramolecular assemblies. Biophys. J. 75:1024–1031. [DOI] [PMC free article] [PubMed] [Google Scholar]
- Schneider, H. J., and M. Wang. 1994. DNA interactions with porphyrins bearing ammonium side chains. J. Org. Chem. 59:7473–7478. [Google Scholar]
- Sehlstedt, U., S. K. Kim, P. Carter, J. Goodisman, J. F. Vollano, B. Nordén, and J. C. Dabrowiak. 1994. Interaction of cationic porphyrins with DNA. Biochemistry. 33:417–426. [DOI] [PubMed] [Google Scholar]
- Strickland, J. A., L. G. Marzilli, and W. D. Wilson. 1990. Binding of meso-tetrakis( N-methylpyridiniumyl)porphyrin isomers to DNA: quantitative comparison of the influence of charge distribution and copper(II) derivatization. Biopolymers. 29:1307–1323. [DOI] [PubMed] [Google Scholar]
- Yun, B. H., S. H. Jeon, T. S. Cho, S. Y. Yi, U. Sehlstedt, and S. K. Kim. 1998. Binding mode of porphyrins to poly[d(A-T)2] and poly[d(G-C)2]. Biophys. Chem. 70:1–10. [DOI] [PubMed] [Google Scholar]


