

Abstract
As typical anchorage-dependent cells myocytes must balance contractility against adequate adhesion. Skeletal myotubes grown as isolated strips from myoblasts on micropatterned glass exhibited spontaneous peeling after one end of the myotube was mechanically detached. Such results indicate the development of a prestress in the cells. To assess this prestress and study the dynamic adhesion strength of single myocytes, the shear stress of fluid aspirated into a large-bore micropipette was then used to forcibly peel myotubes. The velocity at which cells peeled from the surface, Vpeel, was measured as a continuously increasing function of the imposed tension, Tpeel, which ranges from ∼0 to 50 nN/μm. For each cell, peeling proved highly heterogeneous, with Vpeel fluctuating between 0 μm/s (∼80% of time) and ∼10 μm/s. Parallel studies of smooth muscle cells expressing GFP-paxillin also exhibited a discontinuous peeling in which focal adhesions fractured above sites of strong attachment (when pressure peeled using a small-bore pipette). The peeling approaches described here lend insight into the contractile-adhesion balance and can be used to study the real-time dynamics of stressed adhesions through both physical detection and the use of GFP markers; the methods should prove useful in comparing normal versus dystrophic muscle cells.
INTRODUCTION
Anchorage of cells to matrix is central to many aspects of mammalian physiology, including the formation and function of both compliant and contractile tissues. Changes in the adhesive properties of many cell types also underlie numerous pathologies and disease processes. Detachment and readhesion of cancer cells, for example, are central to metastasis (Mason et al., 2002; Righi et al., 2003; Shen and Falzon, 2003; Van Den Brule et al., 2003), and—more relevant to the studies here—defects and disruption of muscle cell adhesion to extracellular matrix (ECM) seem responsible for multiple forms of muscular dystrophies (MDs) (Angoli et al., 1997; Campbell, 1995). Duchenne MD, for example, is caused by a lack of the protein dystrophin (Koenig et al., 1988), which normally links the actin cytoskeleton to ECM receptors, and defects in the ECM protein laminin have been reported in a form of congenital MD (Helbling-Leclerc et al., 1995). Skeletal muscle cells are also widely studied for insights into cell differentiation. Starting as motile, mononucleated myoblasts, these cells aggregate and fuse to become immobile, syncytial myotubes that express proteins in distinct spatio-temporal patterns, ranging from a striated cytoskeleton to adhesive assemblies known as costameres (Pardo et al., 1983; Ervasti, 2003). Here we probe several general physical features of myocyte adhesion, considerably refining an earlier micropipette technique (Ra et al., 1999) to achieve deeper insight into the attachment of individual cells.
Although muscle contraction is extensively studied and now deeply understood, myocyte adhesion is comparatively less understood but is clearly important to effectively transmitting sarcomeric contractions. Skeletal myocytes are typically bundled in parallel through adhesion to a compliant, interconnecting matrix. One typical method of studying muscle contractility and integrity of bundles as well as of individual sarcomeres is a twitch test in which the tension and length of the muscle as a whole are characterized. For this test, a fiber is held at the ends and stimulated to contract (Carlson, 1974; Hack et al., 1999), while either the tension or length of the fiber is held constant and the other parameter is measured. The contraction velocity is also obtained and extrapolated to the maximum velocity at zero load using the Hill equation (Hill, 1938). In the context of adhesion, such velocities and/or loads dictate the needed levels of cell-cell adhesion, but because the muscle is pinned at each end, there is no way to physically examine the adhesion along the length of the fiber bundle.
The study of overall tissue cell adhesion has traditionally involved assaying a large population of cells. In a typical spreading assay, for example, the average contact area between cells and the substrate is used as a simple indicator of the affinity for attachment (Ingber, 1990; Mooney et al., 1995; Healy et al., 1999; Erdman et al., 2001). During a centrifugation assay, adherent cells are subjected to centrifugal forces, and the mean number of cells that remain attached after exposure to force are compared to the initial number of attached cells (Angoli et al., 1997; Giacomello et al., 1999). Flow chamber assays have also been used, where cells are exposed to hydrodynamic force (either steady or not) and the numbers of attached cells before and after exposure to fluid shear are compared (Cozens-Roberts et al., 1990; Curwen et al., 1982). Garcia and co-workers' spinning disk device combines both centrifugal and shear forces (Garcia et al., 1997). Although many of these tests can be simple to perform, they are not well suited to the linear geometry of a myotube, which can be millimeters in length.
Micropeeling of tissue cells as described here has several general advantages over traditional adhesion assays by being continuous, quantitative, and focused on the time-dependent detachment forces as well as on the substructure of single cells along their entire lengths. A key first step is to impose initial spatial “boundary conditions” on the cells that are intended to limit cell branching and simplify and standardize cell geometry. This is achieved by micropatterning the substrate with linear adhesive domains that generate straight, multinucleated myotubes, up to 1000-μm long. We show that lifting and detaching one end of such cells leads to a partial relaxation of cell length that reveals contractile prestress. We then controllably aspirate these elongated cells into large-bore micropipettes and forcibly peel the cells from the substrate. Because the entire peeling process is directly observed in the microscope, the dynamic detachment of the cell and the spatially heterogeneous contributions of physically and fluorescently detected focal adhesions are visible and measurable in real time. This method thus represents an opportunity to closely examine the heterogeneity of cell-substrate adhesion within a single cell.
MATERIALS AND METHODS
Defined substrates for long-term cell patterning
Patterning of cells on substrates has been widely reported, and exploits various strategies (Carlson, 1974; Clark et al., 1992; Bhatia et al., 1994; Healy et al., 1996; Folch and Toner, 1998; Chen et al., 1998), but patterns often become overgrown with proliferating cells after 24–48 h in serum-supplemented media. The method of Healy and co-workers (Bearinger et al., 1997; Thomas et al., 1999) is one of several exceptions, and we adapt a version of it in this work to muscle cell cultures, which generally require several weeks to differentiate.
Glass slides or coverslips (hereafter, “slides” will refer either to standard microscope slides cut into 0.75-×-1-inch sections or else 1.5 circular coverslips, 25 mm in diameter) are cleaned by submersion in piranha solution (2 parts sulfuric acid to 1 part hydrogen peroxide) for 10 min followed by 5 min rinsing in deionized (DI) water. The slides are then spin coated with positive photoresist S1813 (Shipley, Marlborough, MA) at 4000 rpm for 25 s (1 in Fig. 1 A). The coated slides are soft baked for 1–3 min at 115°C and exposed to 2400 J of 300- to 500-nm ultraviolet light through a mask of the desired pattern (2 in Fig. 1 A). The exposed slides are soaked in developing solution (1 part Shipley Microposit 351 concentrate to 5 parts DI water) for 40 s–1 min, rinsed in a DI water overflow chamber for 1 min, dried, and hard baked for 1–2 min at 115°C. This process results in lithographically patterned slides (3 in Fig. 1 A).
FIGURE 1.

Substrate patterning for growing isolated myotubes. (A) A glass slide is first spin coated with photoresist (1), and then exposed to ultraviolet light through a mask of the desired pattern (2). The exposed resist is then developed away, resulting in lithographically patterned slides (3), and the bare regions of glass are finally coated with ATC (4). After the patterned photoresist is stripped away, pAAm is bound to the silane-coated glass (5) and mPEG is then bound to the pAAm gel (6), resulting in p(AAm-co-EG) IPN patterned slides (7). (B) The p(AAm-co-EG) IPN patterned slides are finally treated with APES and collagen. After 24 h, fluorescently labeled collagen I preferentially adsorbs to the amino-silane coated glass and not to the IPN.
The lithographically patterned slides are further modified with an interpenetrating polymer network (IPN) of polyacrylamide pAAm and polyethylene glycol (PEG). First, allyltrichlorosilane (ATC, Sigma, St. Louis, MO) is bound to the exposed glass on lithographically patterned slides by submerging the slides in a 1.25% solution of ATC in anhydrous toluene for 5 min followed by rinsing in toluene and baking (4 in Fig. 1 A) After the photoresist is stripped by sonicating in acetone, IPN is bound to the exposed allyl groups as described in Bearinger et al. (1997), with some modifications. Briefly, slides are placed face down in a glass petri dish, covered with acrylamide solution, and exposed to 312-nm light for 20 min in the presence of the photointiator benzoin methyl ether (BME, Polysciences, Warrington, PA) and N,N-methylenebis acrylamide cross-linker (BIS, Polysciences), which results in slides patterned with pAAm (5 in Fig. 1 A). After rinsing and sonication in reverse osmosis, ultrapure water (UP water), slides are lightly rubbed between the index finger and thumb under running water and inspected by phase microscopy. Slides successfully patterned with pAAm (throughout) are then placed face down in a glass petri dish, covered with a PEG monomethyl ether monomethacrylate (MW 1000) (mPEG, Polysciences) solution and exposed to 312-nm light for 20 min in the presence of BME and BIS. Slides are rinsed and sonicated in UP water, resulting in p(AAm-co-EG) IPN-patterned slides (7 in Fig. 1 A). The untreated glass islands on IPN-patterned slides were grafted with 3-aminopropyltriethoxysilane (APES, Sigma) by submersion in a 2% solution of APES in toluene for 15 min, followed by rinsing in UP water and baking. Finally, rat-tail collagen I (BD Biosciences, Palo Alto, CA) is adsorbed to the APES-treated islands by overnight incubation in a solution of 0.002% collagen I in 1% acetic acid at 4°C. The finished pattern thus consists of adhesive domains of collagen-adsorbed glass, 20-μm wide and varying from 200- to 1000-μm long, surrounded by nonadhesive IPN (Fig. 1 B).
Cell cultures
C2C12 murine skeletal myocytes (CRL-1772, ATCC, Rockville, MD) are maintained in 75-cm2 flasks (Corning Glass Works, Corning, NY) in 10 mL DMEM (GIBCO Laboratories, Grand Island, NY) supplemented with 20% fetal bovine serum (GIBCO), 0.5% chick embryo extract (GIBCO), and 0.5% penicillin/streptomycin (10,000 units/mL and 10,000 μg/mL, respectively) (GIBCO). Cells are passaged every 2–3 days by detaching with trypsin-EDTA (GIBCO). In preparation for the experiment, fully patterned slides are seeded with ∼104 cells. One day after plating (day 1), the media is changed to differentiation media (DMEM supplemented with 10% horse serum (GIBCO) and 0.5% penicillin/streptomycin). The cells are grown at 37°C in 5% CO2 for 2, 6, or 14 days. Differentiation media is replaced every other day.
For experiments with smooth muscle cells (SMCs), A7r5 rat aorta derived cells (CRL-1444, ATCC) are grown in 75-cm2 flasks (Corning) in 10 mL of DMEM supplemented with 10% fetal bovine serum and 0.5% penicillin/streptomycin. Cells are passaged every 3–4 days by detaching with trypsin-EDTA (GIBCO). Plasmid for pEGFP-paxillin (BD Biosciences Clontech, Palo Alto, CA) containing a kanamycin resistance gene is amplified in DH5α competent cells and transfected into SMCs using Lipofectamine as a vector (Invitrogen, Carlsbad, CA) and following a standard protocol (Evans et al., 1999). Briefly, DNA-lipid complexes are incubated in 1 mL serum-free media for 45 min at room temperature, mixed with serum-containing media to a final serum concentration of 2.5%, and added to culture flasks for a 24-h incubation period (Engler et al., 2003). Cultures are rinsed and grown in complete growth medium supplemented by 250 μg/mL kanamycin (GIBCO). Transfected cells are then plated on unpatterned, collagen-adsorbed coverslips and grown for 24 h in preparation for peeling.
Cell relaxation and forced peeling method
After 6 days in culture, myotubes grown on patterned slides are generally fully fused (see text), and are ready to be peeled with a micropipette/syringe pump system. Micropipettes ∼1-inch long are cut from cylindrical, hollow optical waveguides (Polymicro Technologies, Phoenix, AZ) with tightly controlled dimensions: The inner diameter is 75 ± 1 μm and the outer diameter is 150 ± 1 μm. After cutting with an optical fiber cutter (York Photonic Technology Ltd, North Yorkshire, UK), the polyimide coating is burned off in a flame, and the pipette is mounted (in a micromanipulator via a continuous water line) at a fixed, acute angle, ϕ (∼30–40°), relative to the substrate (Fig. 2 A). Because the cell dimensions (∼20-μm wide by ∼5-μm high) are small compared to the 75-μm inner diameter of the micropipette, the cell only occupies ∼2% of the cross-sectional area of the pipette. This ensures that the drag force of the aspirating fluid rather than the pressure drop dominates the cell peeling. It also appears that hydrodynamic forces (if not gravity) hold the aspirated portion of the cell flat against the pipette wall. Friction is likely to be minimal because micropipettes are pretreated with BSA to minimize any cell-glass adhesion, and we also observe that, during an experiment, a cell easily slides out of the pipette once the flow is off and the pipette is translated. Although the presence of the cell within the pipette changes the cross-sectional area available for fluid flow (∼2% per above), the error introduced by this change is negligible compared to measurement errors associated with the optical limitations of the microscope (Nikon TE300 with a 10×, 0.17 numerical aperture (NA) phase objective).
FIGURE 2.

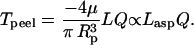
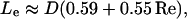
Cell-peeling schematic in side view. A multinucleated muscle cell is aspirated into a large bore, cylindrical micropipette (of radius Rp). The shear stress, τcell, acting on the cell is integrated over the aspirated length of cell into the pipette, Lasp, to give the peeling tension Tpeel. At a flow rate of 10 μL/min, the Reynolds number for a 75-μm diameter pipette is 47.2. The motorized stage is translated to the left at Vstage in an effort to approximate or exceed Vpeel. A typical inclination angle of the pipette, ϕ, is 30–40°. (B) An enlarged view illustrates the height difference, h, established between the pipette and the top of the cell. Although h can vary between experiments, h is held constant once peeling begins, and is ∼5 μm. As sketched, receptor-ligand bonds between the cell and the substrate are broken during peeling. The amount of bending that occurs is influenced by ϕ, Tpeel, and the adhesion strength.
Peeling is initiated by first detaching one end of the cell and allowing time for cell relaxation. (In a few cases, the cells are peeled without waiting for complete relaxation.) Subsequently, cells are aspirated as illustrated in Fig. 2 with a motorized stage translated at a velocity to stay “ahead” of the peel. Flow rates are controlled by a syringe pump (model SP120p-300, World Precision Instruments, Sarasota, FL) with a flow rate that ranges over six orders of magnitude, from 0.001 to 602 μL/min. During a peeling experiment, the aspirated length, Lasp, of a cell can reach nearly 1 mm. With a pipette diameter of 75 μm and a typical aspirated length of 200 μm, this range of flow rates can produce peeling tensions ranging from 0.08 pN/μm to 48.45 nN/μm as can be calculated below. The maximum Reynolds number is Re ≤ 170, which is well below the classical transition from laminar to turbulent flow limit at Re = 2100.
Forced cell peeling: hydrodynamic analysis
Per Fig. 2 A, the large pipette/cell system can be most simply modeled as pipe flow. Because the cell dimensions are negligible compared to the diameter of the pipette, the shear stress acting on the cell inside the pipette is calculated at the pipette radius (Rp):
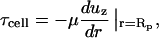 |
(1) |
where μ is the fluid viscosity. The drag force, Fdrag, is simply the shear stress integrated over the length, Lasp, and width, W, of cell aspirated into the pipette:
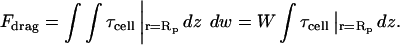 |
(2) |
Because we have observed that W inside the pipette generally does not change by >∼20% under the stresses of aspiration, we have taken it to be a constant. The peeling tension applied to the cell is then the drag force divided by W, or
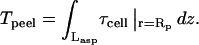 |
(3) |
The velocity profile for well-established flow inside a pipette is parabolic, and, in terms of a controlled flow rate, Q, has the form:
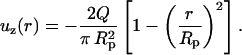 |
(4) |
For well-established flow, the fluid velocity is not a function of axial position. After taking the derivative of Eq. 4, Tpeel reduces to
 |
(5) |
Thus, for an established flow profile at a constant flow rate, the peeling tension at or very near the peeling front is simply a linear function of the aspirated cell length. This is true at any instant, even if the end-pinned aspirated length might change as the viscoelastic cell slowly stretches inside the pipette. This is because the external forces (and any cell-generated stress) always balance the pinning, adhesive forces in the absence, as here, of significant cell inertia and acceleration.
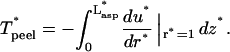
An accurate calculation of the shear stress, however, should account for the effects of the entry length on the development of the fluid flow profile. The entry length for flow into a pipe is given by the relation (Denn, 1980):
 |
(6) |
where D = 2Rp. Using representative values for the Reynolds number (assuming no wall roughness), Eq. 6 gives entrance lengths ranging from 140 to 300 μm. Because these lengths are often comparable to the aspirated cell length, Lasp, entrance flow effects must also be taken into consideration in determining the shear stress on the cell.
Specifically, within the entrance length the velocity profile is a function of the axial position. The needed function and its derivative (to obtain τcell) are calculated from published flow data (Schlichting, 1979) and are presented in Appendix 1. The flow is seen to be well established for 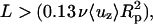 where ν = μ/ρ. The effect of the oblique external wall at angle ϕ to the pipette has been experimentally examined and tends to increase the entrance length by ∼10%. We therefore neglect this latter effect.
Given that the microscope's field of view has a maximum diameter of 300 μm, the tension for cells longer than 300 μm cannot be measured directly. In addition, because there is a height difference between the peeling front and the end of the cell inside the pipette, the peeling front and the end of the cell cannot be in focus simultaneously. Thus, at some time points, Lasp, and therefore Tpeel, must be calculated. If this is necessary for points when the cell is peeling, the length peeled is simply added to the aspirated length. For points where the cell is stuck, the length inside the pipette is fit linearly to the measured data points for Lasp, which accounts for any cell stretching.
Peeling velocities for each cell are calculated in 1-s intervals, which is the smallest time interval possible for the needed through-focus in the imaging process. This time interval is sufficient for velocity observations. Finally, the minimum velocity measurable within the resolution of the microscopy and methods is ∼1 μm/s.
SMC peeling
A7Rr5 cells transfected with GFP-paxillin (Engler et al., 2004) are peeled from (unpatterned) collagen-coated glass using micropipette aspiration as described by Ra et al. (1999). Although explicit forces are only approximated from the pressure drop in the small-bore aspirating pipette, cell peeling velocities are more definitively observed. In addition, the amount of GFP-paxillin attached both to the cell and to the substrate is measured by the fluorescence intensity.
Fluorescent staining
To determine the extent of muscle cell differentiation, cells are stained for myosin and actin. Cells grown on coverslips are fixed with formaldehyde, incubated in a 5% BSA (Sigma) blocking solution for 1 h at 37°C, permeabilized with 0.5% Triton-X-100 (Fisher Scientific, Atlanta, GA) and incubated overnight at 4°C in 1:50 mouse anti-myosin (catalog number 18-0105 Zymed, San Francisco, CA) or 1:200 in mouse anti-vinculin (catalog number V9131 Sigma) in PBS. Cells are then incubated for 1 h at 37°C in 1:100 FITC-conjugated anti-mouse IgG (Sigma) and cells stained for myosin are also incubated in 60 μg/mL TRITC-phalloidin (Sigma). Finally, the cells are incubated for 10 min in 1:100 Hoechst 33342 (Molecular Probes, Eugene, OR) to label DNA. Fluorescently labeled cells are examined under epi-fluorescence using a 60× (1.4 NA, oil) objective and images are recorded with a liquid nitrogen cooled CCD camera (Model CH360, Photometrics, Tuscon, AZ). Alternatively, cells are viewed using total internal reflectance (TIRF) microscopy using a 60× (NA 1.45, oil) objective, and images are recorded with a cascade CCD camera (Photometrics).
RESULTS
Patterned cell differentiation
Initially plated at random on the substrates, mononucleated myoblasts generally crawl onto the collagen-coated strips, or “islands,” within 24 h (Fig. 3). The inset image in Fig. 3 suggests subsequent fusion of the cells into syncytial myotubes, and also highlights the relatively well-defined cell width and ends, and the absence of all but a few branches (Fig. 3, arrowhead). Compared to typical cultures of myotubes, these IPN-patterned cells show almost no branching. Although cell branching between islands and growth onto the IPN portion of the substrate does occasionally occur, the efficiency of this pattern ranges from 90 to 100%, where efficiency is defined as number of cell islands/(number of cell islands + branches). Proliferation generally stops within the first 1–2 days of culture, and the cells can maintain this pattern for at least 14 days, the duration of the experiments.
FIGURE 3.

Phase contrast images of C2C12 cells growing on the IPN-defined patterns at day 4 after plating. Cells recognize the pattern with nearly 100% efficiency. Two myotubes, 1000-μm and 600-μm long, are shown within dashed boxes. Rounded cells (arrows) and the occasional branched myotube (arrowhead) are most likely due to defects in the IPN, and account for 10% of the total cells. Upper inset is a differentiated myotube, and illustrates a cell width, W, that varies by less than a factor of 2 along the entire length of the cell.
The differentiation state of the cells was further characterized to establish that the cells were becoming myotubes. Cells grown for 2, 6, and 14 days were stained for myosin, actin, and DNA (Fig. 4). By day 6, the cells have clearly formed multinucleated syncytia. The cells show a transition from cortical actin at the plasma membrane between adjacent nuclei to more organized bundles. The cells also show an increase in diffuse myosin when immuno-stained (data not shown). In fully differentiated muscle cells, of course, myosin should be organized into the M-lines and actin should localize to Z-discs, giving the classic muscle striation. Such organization is not evident in these patterned cells by day 14; instead, the actin filaments achieve a stable, stress fiber-like form, and myosin exhibits a diffuse structure. Although sarcomeres do not form here even by day 24, the same cells grown on flexible substrates and under similar conditions do show significant striation, which suggests that the compliance of the substrate has a profound effect on the cellular contractile apparatus (data not shown). The results here thus imply that the rigidity of the collagen-coated glass might allow isometric contractions but tends to lock myotubes into a stress-fiber dominated state. Based on these observations alone, such cells might be anticipated to accumulate or achieve a certain level of contractile prestress.
FIGURE 4.

Actin labeling reveals the differentiation state of the myotubes. C2C12 cells are plated on IPN patterns, grown for 2, 6, and 14 days, and then stained for F-actin (red), and DNA (blue). Arrows in the day 2 images highlight clear membrane divisions between cells, showing that the myoblasts have not yet fused. Although the cells are clearly fused by day 6, actin maintains a stress fiber-like orientation that persists thereafter.
Slow relaxation of a detached end: self-peeling
When detached from the substrate at one end by careful scraping with the end of a glass micropipette, myotubes are seen to spontaneously relax (Fig. 5, A and B). This type of self-peeling occurs until the cell reaches the next “physical focal adhesion” (PFA). During this process, the relaxing portion of the cell displaces, as a whole, in apparent affine deformation along the surface of the substrate. The length for each relaxing cell is measured as a function of time and is found to fit an exponential decay, with an average fitted R2 = 0.94 (Fig. 5 C), and a characteristic time constant, tself-peel, determined for each cell. On average, the cells reach an equilibrium after contracting 19 ± 3% of their initial length. Once an equilibrium is reached, the remainder of the cell is available for forced cell peeling. Interestingly, separate studies of the same cells grown on soft patterned gels show that such cells relax minimally when detached, even while appearing more striated (data not shown). A subset of cells (∼60%) here also undergoes a second relaxation after the initial equilibrium, and in these cases, decays are fit only through the first equilibrium (Fig. 5 C). Cells that relax twice reach equilibrium faster; the average tself-peel for twice-relaxing cells is about half the average tself-peel for cells that relax only once (Fig. 5 E), consistent with either less drag or a greater prestress that can drive two relaxation processes.
FIGURE 5.

Spontaneous relaxation of end-detached myotubes. (A and B) When one end of a cell is mechanically detached from the substrate with a micropipette, the cell partially relaxes to an intermediate point. (C) The cell length versus time data are fit with an exponential decay ( ) to determine the time constant, tself-peel, for the relaxation process. A subpopulation of cells undergoes a second relaxation (circles), and in these cases, the data are fit only through the first equilibrium point. On average, cells contract 19% of their initial length. (D) The Voigt model for viscoelasticity includes a dashpot with a drag coefficient c, and a spring with a spring constant k, which distribute an applied force, F. (E) The time constants for relaxation are averaged among three cells that undergo one relaxation and again among five cells that relax a second time. Cells that relax only one time have a time constant two times that of cells that relax twice.
The single exponential decay found here is expected for the relaxation of a simple viscoelastic body with one time constant driven by elastic contraction but limited by internal dissipation, as in the Voigt model (Fig. 5 D). Thus, tself-peel = c/k, where c is the drag coefficient representing adhesive disruption and/or cytoplasmic dissipation, and k is the spring constant representing an elastic prestress. The faster double relaxation observed in some cells implies that the accumulated prestress can be relieved by breaking additional adhesive attachments. A characteristic velocity of such processes is approximated by dividing the average total distance relaxed, ΔLeqbm, by the average tself-peel. For both singly and doubly relaxing cells, this value is 2–3 μm/s. In other words, between the strong end-anchoring PFA and the most proximal PFA, the contractile prestress is sufficient to peel at a rate of Vself-peel on the order of μm/s. Importantly, this value of Vself-peel is comparable to the sarcomeric contraction velocities of several μm/s obtained in traditional twitch tests, e.g., Pate and Cooke (1985) and Cooke et al. (1988). As discussed below, Vself-peel can also be used in combination with forced cell peeling to provide an estimate for the contractile prestress, σ, generated within the myotube and presumed equivalent to k.
Forced detachment: cell peeling
Cells that have been allowed to self-peel (as well as unrelaxed cells) are forcibly peeled until they are completely detached by aspirating an increasing length of cell (Fig. 6 A) into a large-bore micropipette, per Fig. 2. During an aspiration experiment, the velocity of a cell being peeled (Vpeel) fluctuates considerably along the length of the cell due to focal adhesions that are again identified as PFAs. On average, cells are stuck at PFAs for 80% of the duration of the peel; PFAs therefore dominate adhesion of the cell to the substrate. At PFAs, which are likely to be a collection of many molecular focal adhesions (as imaged later), the adhesion can be so strong that the cell will stretch by as much as 50% (and also thin slightly) inside the pipette during aspiration. This stretching of Lasp increases the peeling tension, even though Vpeel may remain zero (Fig. 6, A and B). Although the cell width, W, also appears to thin, we measured W at five points along the aspirated length during the peel, and found it to change by <10–20%. Treating W as a constant (per Eq. 2) is therefore reasonable, and we can safely assume that viscoelasticity of the cell is largely accounted for by measuring Lasp in the calculation of shear-induced tension.
FIGURE 6.

Aspirated length, peeling tension, and peeling front velocity versus time for a representative cell. (A) The tension, Tpeel, (▴) is a function of the length of myotube aspirated into the pipette, Lasp; hence Tpeel increases as Lasp (▵) increases. The tension can also increase while the cell is stuck on a physical focal adhesion due to stretching of the cell inside the pipette; this occurs here from 3 to 27 s. Such stretching is indicative of strong attachment at PFAs. The sharp increase in Tpeel at 30 s (*) is where the PFA yields, and causes a sudden increase in Lasp. (B) The cell peeling velocity fluctuates due to focal adhesions along the cell length. With this particular myotube, points where the cell is stuck are plotted as hollow squares, and points where the cell is peeling are solid squares. Note that this cell is stuck more often than it peels, indicating that PFAs can dominate a cell's adhesion to the substrate.
Peeling results for multiple myotubes are summarized in Fig. 7 A, where we directly plot the force-velocity relation as Vpeel vs. Tpeel. For analysis purposes, any velocity less than a fraction χ, where χ = 50%, of the preceding acceptable velocity is defined as a nonpeeling PFA. Multiple peeling velocities are averaged into bins of similar peeling tensions, and the number of data points in each bin are indicated. A sensitivity analysis with χ = 25% or χ = 75% results in binned data that still fall within the error of Fig. 7 A. In addition, increasing the flow rate by 50% between experiments does not significantly alter the velocity versus tension data. At higher flows, one tends to obtain less data on the low Tpeel vs. Vpeel portion of the plot.
FIGURE 7.

Velocity versus tension analysis for both (A) maximal cell peeling and (B) detachment from the stronger physical focal adhesions. The error bars indicate the standard deviation of the averages; the numbers represent the data points in each bin. (A) Velocity data for six cells are binned according to Tpeel. The resulting points (circles) are fit with a logarithmic function (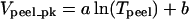 ), simplified from Ra et al. (1999) and Dembo et al. (1988). This fit (R2 = 0.91) yields a tension intercept, To, of 5.4 nN/μm (see text). Representative data from one peeling experiment are also shown (squares). Because of inhomogeneous adhesion to the substrate, the peeling velocity of this single cell fluctuates, decreasing at PFAs. In this analysis, PFAs are defined simply as ≤50% of the preceding Vpeel measurement (□). (B) The peeling velocities at PFA sites are not necessarily zero. The hollow points typifying PFAs in A undergo the same binned analysis, and are replotted with a similar logarithmic fit that yields a To of 6.6 nN/μm.
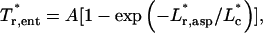
Vpeel of threshold-defined PFAs are not included in the averaged data points of Fig. 7 A. This averaged data set of peak Vpeel's (Vpeel_pk) vs. Tpeel is clearly nonlinear. It is well-fit with an offset logarithm suggested by more complex models in previous peeling experiments (Ra et al., 1999) and theoretical analyses (Dembo et al., 1988):
 |
(7) |
From the fit, Vpeel_pk = 0 μm/s at Tpeel = 5.4 nN/μm. Importantly, the zero-velocity intercept, To = exp(−b/a), represents the minimum tension required to detach a cell from the substrate.
Data from peeling of a single cell are also shown (squares) in Fig. 7 A. These results demonstrate that the peeling velocities of PFAs as operationally defined here are not necessarily zero. The peeling velocities of PFAs can therefore be analyzed according to the same criterion as the entire cell: a point with a velocity less than χ = 50% of the last accepted velocity is discarded and treated as nonpeeling. The resulting set of accepted peeling points are then binned and fit with Eq. 7 (Fig. 7 B), and the tension intercept for PFA peeling is again To = 6.6 nN/μm. There is no significant difference between this To and To = 5.4 nN/μm for the peeling data; thus, the minimum tension that peels a cell along its length is the tension required to overcome a generalized attachment.
Finally, the end of a detached cell invariably proves to be strongly attached, which is clearly indicative of a PFA (Fig. 8). For half of the cells peeled, the average time spent stuck to the substrate at the final PFA is >70% of the total time spent stuck at any PFA. This strong end attachment is suggestive of an especially high density of focal adhesion protein at the cell ends. This suggestion is confirmed by TIRF microscopy of cells stained for vinculin (Fig. 8 C), a key focal adhesion protein together with paxillin, talin, etc. The high focal adhesion density may result from the fact that the cell (or cell nuclei) at either end are subject to different stresses, and thus alter protein assembly, or perhaps expression. This end effect on focal adhesions was further examined below but in a different myocyte system; namely, smooth muscle cells expressing a fluorescent chimera of another focal adhesion protein paxillin.
FIGURE 8.

Strong attachment of a myotube end. (A) The top view of a myotube that has been peeled until only one end remains attached. After the cell is exposed to flow for >5 min, the pipette is displaced laterally (B), causing the cell to stretch ∼17% of its length without detaching. The ∼200-μm long myotube remains firmly attached to the substrate at its end for >6 min. (Schematics are also top view.) (C) A TIRF image of vinculin in a patterned myocyte. Vinculin is a focal adhesion protein, and immunostaining reveals a high density of focal adhesions along the ends and sides of the patterned muscle cell. This protein is also particularly dense in the corners of the cell (arrowheads).
Focal adhesion detachment visualized in transfected cell peeling
Smooth muscle cells present at least one major advantage for deeper insight: they are readily transfected with the focal adhesion marker GFP-paxillin. SMCs are also a simpler, mononucleated system. From thresholded images of the transfected cells (Fig. 9), it is clear that focal contacts are densest at the cell ends and edges, consistent with the discussions about end attachment of myotubes (Fig. 8). These cells have also been forcibly peeled from collagen-adsorbed glass. (SMCs do not exhibit self-peeling.) Aspiration again drives cell peeling although the small cell size and the dimensions of the pipette used complicate tension determinations.
FIGURE 9.

Peeling of GFP-paxillin transfected SMCs. (A and B) Time sequences of the peeling of transfected SMCs reveal very strong adhesion to the substrate at focal adhesions. The red color indicates the focal adhesions that are attached to both the cell and the substrate. During peeling, the focal adhesions fracture, leaving behind fluorescent residue (green). (A′ and B′) The total area of these green fractured focal adhesions increases sharply during a fracture, and corresponds to a spike in Vpeel. In B, such a fracture occurs between 18 and 18.5 s, as indicated by a star.
During and after peeling, SMCs clearly show fracture at a large fraction of their paxillin-rich focal adhesions, leaving fluorescent residue on the substrate (Fig. 9, A and B). The cumulative area of these fractured focal adhesions (fractured FAs) can be tabulated by thresholding the raw peeling image at each time point, and measuring the area of the fluorescent contacts to the surface. Contacts that are still attached to the cell are colored red in Fig. 9, whereas contacts that have fractured from the cell and remain attached to the surface are colored green. At any time point, the total FA area covered by the fractured (green) FA contacts is normalized by dividing by the initial contact area (red) to obtain the % Area Fractured FA, as plotted in green in Fig. 9, A′ and B′.
After cells are completely peeled, the % Area Fractured FA averages 40 ± 5% (n = 3 cells). It does not reach 100% (Fig. 9, A′ and B′) because a large percentage of focal adhesions disappears with the cell as it is aspirated into the pipette. Indeed, the length of the cell aspirated at a given time point (Lasp) is roughly proportional to the difference between the initial contact area (red area at t = 0) and the total area of FAs attached to the substrate at a given time (red + green areas at time t). The peeling velocities clearly exhibit sharp peaks immediately after fracture events, pointing towards a decreased level of attachment between focal adhesions (Fig. 9, A′ and B′).
Since Lasp increases with time in the SMC experiments (Fig. 9, A′ and B′) — as in the skeletal muscle cell peeling experiments — a tentative comparison can be made between the two systems. First, the peeling tension on the SMC is also increasing with time (or else is constant) as more of the cell is aspirated into the pipette; this is similar to the increasing tension acting on the skeletal muscle cell (Fig. 6 A). Consistent with this, the peak velocity also tends to increase over time. The analogy is particularly striking when compared to the PFA-defined fluctuations in the skeletal muscle cell peeling experiments. The peeling velocity of SMCs thus depends heavily on the attachment strength of paxillin-associated FAs, just as Vpeel of a skeletal muscle cell is regulated by PFAs.
Finally, the focal adhesion fracturing that occurs during micropipette peeling here contrasts with other studies where cells are detached by shear, with clean detachment of adhesions and without cell fracturing (Gallant et al., 2002). This difference is likely due to the high shear/high load rate regime of the micropipette aspiration compared to the low shear/low load rate of typical adhesion assays. However, extraction of integrins from cells during cell crawling has been observed before with notions of physiological significance (Palecek et al., 1996). Presumably, the FA fracturing seen with SMCs is highly traumatic to a cell, which may help clarify why contractile myocytes, including SMCs, develop adhesion mechanisms based less on integrins and the classical FA apparatus and more on highly flexible dystrophin and specialized adhesion receptors (Ervasti and Campbell, 1993; Blake et al., 2002).
DISCUSSION
Patterning and peeling methodology
The patterning and peeling of myocytes described here represents a considerable improvement over previously described methods (Ra et al., 1999). A first critical difference is highly efficient patterning of the cells. The IPN coating adapted here for myotubes (Bearinger et al., 1997; Thomas et al., 1999) has a patterning efficiency that approaches 100%, which is far higher than that obtained by the micromechanical patterning method described in Ra et al. (1999). The key reason for the higher efficiency lies in the nonadhesive nature of the IPN, which defines a stark adhesive contrast with the collagen islands that attract cells. This patterning technique provides an adhesive contrast that can last up to at least four weeks, which is as long or longer than most published patterning methods (Healy et al., 1996; Luk et al., 2000; McDevitt et al., 2002). Besides increasing the time available for culturing cells, the IPN-defined pattern has the advantage over Ra et al. (1999) of generating or imposing very well-defined ends for each myotube (e.g., Fig. 4, day 14). This patterning method thus creates an opportunity to examine the ends of a single myotube, and may model the myotendinous junctions of functioning muscle, which are known to be enriched in adhesion proteins such as dystrophin.
It was previously suggested that the IPN acts as a nonadhesive surface coating, because proteins cannot adsorb, and therefore cells cannot adhere, to the brush-like PEG layer. Indeed, Bearinger et al. (1997) showed that after 24 h of incubation, there was no significant protein deposition onto unpatterned IPN as measured by spectroscopic ellipsometry and recent studies employing a quartz crystal microbalance have confirmed these observations (data not shown) There may, however, be another critical mechanism responsible for the nonfouling nature of the p(AAm-co-EG) IPN surface: the stiffness of the thin polymer coating. Recently, 3T3 fibroblasts have been shown to migrate towards stiff substrates in a process termed durotaxis (Lo et al., 2000). Preliminary AFM studies of the IPN patterns reveal that the collagen-coated glass is considerably stiffer than IPN (data not shown). Thus, a compliance contrast between the IPN and the collagen-coated glass may also play an important role in maintaining the pattern efficiency.
A second and more important improvement with the large-pipette peeling technique described here is that the shear stress of the aspirating fluid—and not the aspiration pressure—drives peeling. Friction is thus negligible in the large-bore pipette method, compared to the smaller pipette method. In addition, Tpeel varies with peeled cell length, yielding a wide range of data for Tpeel vs. Vpeel for a single cell.
Comparison with adhesion assays
To determine how the micropipette peeling data compare with previous adhesion data, the peeling results are compared with the radial flow chamber (RFC) data of Peel and DiMilla (1999). Their experiment consisted of comparing the detachment of mouse M210B4 bone marrow stromal cell cultures at different degrees of confluence; data for cells at 100% confluence are considered here. To illustrate the types of approximations needed in analyses of bulk assays and also to compare the RFC results with the peeling results here, the shear stresses are first converted to apparent peeling tensions. Because the diameter of a cell is so much smaller than the diameter of the RFC (15 mm), the “peeling” tension (T) is approximated by integrating the shear stress (τ) over the upper surface of the cell and dividing by the perimeter of the leading edge of the cell. This reduces to  where d is the cell diameter. Using an estimated cell diameter of 50 μm, the maximum tension at which no cells detach from the surface is 0.8 nN/μm. This value is analogous to the To, found here to be 5.4 nN/μm by the single-cell peeling technique. Considering the many differences between the two systems (substrate type, cell type, single versus sheets of cells), as well as the approximations made in the RFC calculations, these two values compare reasonably well.
A major benefit of the micropipette peeling method is that PFAs can be studied separately from whole-cell adhesion through the observation and analysis of decreased or zero velocity points along the length of the cell. This is the only technique where such a comparison is possible, as most other techniques used to quantify adhesion strength measure the average strength over the entire cell and reflect only the areas of strongest adhesion. In a recent article making use of submicron patterning, Garcia and co-workers (1997) determine the effect of focal adhesion assembly on the overall adhesion strength of 3T3 fibroblasts (Gallant et al., 2002). Just as we find here that the very firmly bound PFA at the end of the cell corresponds to a high density of focal adhesions (Fig. 8 C), Gallant et al. (2002) show that focal adhesion assembly fostered by particular micropatterns also significantly increases adhesion strength.
The contribution that focal adhesions make to the adhesion strength is perhaps not surprising, given the high density of integrins at focal adhesions (Schaller et al., 1995; Moulder et al., 1996). In addition, focal adhesions also function as mechanosensors (Riveline et al. 2001; Beningo et al., 2001) and act as components of signaling cascades (Mortier et al., 2001; Schaller, 2001). Actin is bound to focal adhesions via talin (Burridge and Connell, 1983; Horwitz et al., 1986; Kaufmann et al., 1991); thus, focal adhesions provide a link between the cytoskeleton and ECM.
Sustained prestress
The nonzero tension intercept provides evidence of a finite resting tension (Fig. 7). Wang et al. (2002) found that overall cell stiffness increases with tensile stress, inducing a prestress on the membrane. This indicates that the cytoskeleton of resting cells is stabilized by the tensile stresses within the filaments, as suggested by others (Stamenovic et al., 1996; Ingber, 1997). Prestress seems to have different effects on different cell types. In bone cells, for example, prestress has been theorized to protect the circularly fibered lamellae of osteons from lesions (Ascenzi, 1999). Although the role of prestress in muscle has yet to be fully determined, in almost all cell types prestress is central to mechanosensing, causing cells to adapt to mechanical forces in the environment (Bausch et al., 1998; Stamenovic et al., 2002; Wang et al., 2002).
This prestress is detected in skeletal muscle cells not only in a nonzero To, but also in the “self-peeling” phenomenon observed in the myotubes. Because there is an apparent lack of contractile apparatus in muscle cells grown on patterned IPN, prestress provides an explanation for the relaxation process. Because actin is linked to focal adhesions by talin, focal adhesions can be thought of as pinning the cytoskeleton to the substrate at discrete points along the length of the cell. Therefore, when one end of the cell is detached from the substrate, a “pin” is released, and the cell relaxes up to the point of the next “pin”. Any focal adhesions that remain attached to the ECM behind the relaxing segment, however, maintain the tension in the rest of the actin fibers. Thus, only one segment of the cell undergoes contraction. This concept of discrete strong attachments is supported by the forced peeling data, which show PFAs occurring an average of every 30 μm. By spacing the PFAs in this way, these elongated cells can thus distribute tension between strong attachment points and thereby withstand more stress for a smaller number of adhesion molecules. This spacing is perhaps a means of minimizing the number of PFAs necessary for attachment.
By taking the characteristic relaxation velocity of Vself-peel ∼ 2–3 μm/s defined above, the forced peeling data of Fig. 7 implies Tprestress ≈ Tpeel ∼ 6–10 nN/μm is close to the minimum tension needed to detach a cell from the substrate. This tension can be converted to a prestress by dividing by the cell height of h ∼ 5 μm, giving an approximate cell prestress of σprestress ≈ Tprestress / h ∼ 1.3 kPa. This range is well within that found for human airway SMCs (Wang et al., 2002). From the C2C12 cells that exhibit a double relaxation, tension on both sides of a given PFA appears initially balanced in maintaining attachment to the substrate. In other words, once the cell relaxes to the first PFA, it displays only a temporary equilibrium before the prestress on the other side of that PFA overcomes the attachment to the surface. Thus, the prestress in a doubly relaxing cell is clearly strong enough to break receptor/ligand bonds between the cell and the ECM, even at a PFA.
In a recent study, Munevar et al. (2001) find that 3T3 fibroblasts grown on flexible substrates undergo a similar relaxation process when one end of a cell is chemically detached. The characteristic relaxation velocities for two cells averaged 0.1 ± 0.4 μm/s, and occurred at measured, initial traction stresses of 1.7 ± 0.2 kPa. Although the tractions are similar to σprestress here, these velocities for 3T3 cells are slow compared to the peeling velocities of C2C12 cells. This difference may indicate the effect of the flexible substrate on the cell. Because the flexible substrate moves with the cell as it relaxes, the cell may have time to adjust its stress accordingly. In contrast, cells on rigid substrates have no mechanisms of stress relaxation other than detachment from the substrate.
FA fracture and peeling velocity fluctuations
The experiments with GFP-paxillin transfected SMCs offer a glimpse of the potential application of the micropipette peeling technique. Because the aspiration pressure, and not the shear stress, is used to peel the SMCs from the substrate in these studies, the peeling tension is not measurable. Nevertheless, the data obtained from the SMC experiments highlight the advantage of the microscopy in the general peeling techniques here. It can be seen in real time that focal adhesions adhere so firmly that they disengage from the cell rather than detach from the substrate.
Large-bore pipette studies of C2C12 cells transfected with dynamic fluorescently labeled markers of focal adhesions such as GFP-paxillin or GFP-actin should also reveal correlations with adhesion strength of focal adhesions in addition to the molecular dynamics of focal adhesion detachment. The ability to isolate and characterize the physical properties of focal adhesions should prove to be a significant contribution to the overall understanding of tissue cell adhesion, especially of myocytes where molecular defects are already known.
It is anticipated that this micropeel method can be used to examine the adhesion of primary skeletal myocytes for comparison to primary cells with muscular dystrophy. Key questions remain as to the exact contributions of various membrane proteins to the overall dynamic adhesion strength of muscle cells, and this peeling technique could serve to elucidate these contributions.
CONCLUDING REMARKS
For adherent tissue cells, the micropipette peeling technique is an improvement over conventional adhesion assays in that it provides a quantitative, single-cell measure of cell adhesion. The applied tension can be more easily assessed without gross averaging. The method is designed for the study of elongated isolated cells adhering to ECM, and allows for the examination of adhesive heterogeneity due to focal adhesions within a single cell. Perhaps surprisingly, skeletal myocytes develop a prestress strong enough to break receptor-ligand bonds. Micropipette peeling should be useful in examining cell adhesion on a much deeper level through the closer correlation with adhesion structures. The transfection of fluorescently tagged adhesion molecules clearly enable this detailed examination of mechanism, both of detachment and also of how up- or downregulated proteins such as integrins and/or dystrophin can locally affect the adhesion.
Acknowledgments
The authors thank Shamik Sen of the University of Pennsylvania for determining the effect of the oblique wall, Dr. Alina Popescu of the University of Pennsylvania for assistance with AFM measurements, and Andrew Griffin of Bell Laboratories for performing photolithography, as well as providing necessary materials.
Support was made possible by a fellowship from the American Heart Association (M.G.) and grants from the National Institutes of Health (Presidential Early Career Awards for Scientists and Engineers) and Muscular Dystrophy Association.
APPENDIX 1
Entrance effects
Within the entrance length of the pipette, the velocity profile, and therefore the shear stress, is a function of the axial position. Schlichting presents these experimentally determined fluid velocity profiles as a function of axial position in terms of the following dimensionless parameters:
 |
(A1) |
 |
(A2) |
 |
(A3) |
 |
(A4) |
 |
(A5) |
Data for r* = 0.0, 0.2, 0.4, 0.6, 0.7, 0.8, and 0.9 are reported. To determine the shear stress within the entry length, these data are first replotted as u* vs. r* for representative values of z*. The data set for u* = 0 at r* = 1 (no slip boundary condition) are also included, and the derivative du*/dr* is numerically determined.
Rewriting Eq. 1 in dimensionless parameters yields
 |
(A6) |
The peeling tension, Eq. 3, becomes
 |
(A7) |
For established flow, Eq. A7 simply reduces to 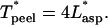 For flow within the entrance length of the pipette, however, the integral must be numerically determined.
This resulting set of data points is rotated by φ (where φ = 1.3 rad; see Fig. A1), and the rotated data are fit to
 |
(A8) |
where A = 0.035 and  The R2 for this fit is 0.99, with
  as the characteristic decay length for entry flow into the pipette. Equation A8 can then be used to back out the dimensionless value of
  which is converted into nN/μm with Eq. A1.
FIGURE A1.

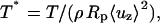
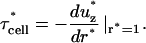
Entry-length flow effects cause an offset in the peeling tension. The dashed line is the dimensionless tension calculated assuming the flow is well established throughout the pipette. The solid line is the tension within the entrance length of the pipette. The difference between the two curves is approximately constant.
Because the shear stress is continuous, the entrance length is defined where  According to the numerical derivative, this occurs at z* = 0.13. The fluid flow is therefore defined as well established for z* > 0.13. Thus, the tension is calculated according to the entrance length estimation for
  and for established flow thereafter.
As is clear from Fig. A1, the correction for the entrance effects results in an increase of the overall tension. In addition, beyond a small initial axial position, this increase is a constant offset of ∼0.11 dimensionless tension units.
Note that this calculation is just a first approximation in determining the shear stress within the entrance length of the pipette. The effects of the coverslip and cell on the flow profile of the fluid are ignored (although these have been experimentally determined to increase the entrance length by ∼10%; see text).
Notation used: μ, fluid viscosity; ν, kinematic viscosity; ρ, fluid density; σ, prestress; τ*, dimensionless shear stress; τcell, shear stress acting on the cell; χ, cutoff for determining a PFA; 〈 〉, average dimensionless fluid velocity in the axial direction; 〈uz〉, average fluid velocity in the axial direction; Ap, cross-sectional area of the pipette; C, constant equal to
 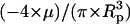 ; c, drag coefficient for Voigt model; Fdrag, drag force; k, spring constant for Voigt model; L, cell length on substrate; Lasp, aspirated length of the cell;
  dimensionless aspirated length;
  rotated dimensionless aspirated length;
  dimensionless characteristic entrance length; Le, entrance length of the pipette; ΔLeqbm, total distance relaxed during a relaxation experiment; Q, aspirating fluid flow rate; r, radial coordinate axis; r*, dimensionless radial coordinate axis; Rp, pipette radius; tself-peel, time constant; T*, dimensionless peeling tension;
  dimensionless tension in the entrance length region;
  rotated dimensionless tension in the entrance length region;
  dimensionless tension in the established flow region; Tent, tension in the entrance length region; Tpeel, peeling tension;
  dimensionless fluid velocity in the axial direction; uz, fluid velocity in axial direction; Vpeel, peeling velocity; Vpeel_pk, peak peeling velocity; Vstage, motorized stage velocity; W, cell width; z, axial coordinate axis; z*, dimensionless axial coordinate axis.
References
- Angoli, D., P. Corona, R. Baresi, M. Mora, and E. Wanke. 1997. Laminin-alpha2 but not -alpha1-mediated adhesion of human (duchenne) and murine (mdx) dystrophic myotubes is seriously defective. FEBS Lett. 408:341–344. [DOI] [PubMed] [Google Scholar]
- Ascenzi, M. G. 1999. A first estimation of prestress in so-called circularly fibered osteonic lamellae. J. Biomech. 32:935–942. [DOI] [PubMed] [Google Scholar]
- Bausch, A. R., F. Ziemann, A. A. Boulbitch, K. Jacobson, and E. Sackmann. 1998. Local measurements of viscoelastic parameters of adherent cell surfaces by magnetic bead microrheometry. Biophys. J. 75:2038–2049. [DOI] [PMC free article] [PubMed] [Google Scholar]
- Bearinger, J. P., D. G. Castner, S. L. Golledge, A. Rezania, S. Hubchak, and K. E. Healy. 1997. P(aam-co-eg) interpenetrating polymer networks grafted to oxide surfaces: surface characterization, protein adsorption, and cell detachment studies. Langmuir. 13:5175–5183. [Google Scholar]
- Beningo, K. A., M. Dembo, I. Kaverina, J. V. Small, and Y. L. Wang. 2001. Nascent focal adhesions are responsible for the generation of strong propulsive forces in migrating fibroblasts. J. Cell Biol. 153:881–888. [DOI] [PMC free article] [PubMed] [Google Scholar]
- Bhatia, S. N., M. Toner, R. G. Tompkins, and M. L. Yarmush. 1994. Selective adhesion of hepatocytes on patterned surfaces. Ann. N. Y. Acad. Sci. 745:187–209. [DOI] [PubMed] [Google Scholar]
- Blake, D. J., A. Weir, S. E. Newey, and K. E. Davies. 2002. Function and genetics of dystrophin and dystrophin-related proteins in muscle. Physiol. Rev. 82:291–329. [DOI] [PubMed] [Google Scholar]
- Burridge, K., and L. Connell. 1983. A new protein of adhesion plaques and ruffling membranes. J. Cell Biol. 97:359–367. [DOI] [PMC free article] [PubMed] [Google Scholar]
- Campbell, K. P. 1995. Three muscular dystrophies: loss of cytoskeleton-extracellular matrix linkage. Cell. 80:675–679. [DOI] [PubMed] [Google Scholar]
- Carlson, F. D. 1974. Muscle Physiology. W. D. McElroy and C. P. Swanson, editors. Prentice-Hall, Inc., Englewood Cliffs, NJ.
- Chen, G., Y. Imanishi, and Y. Ito. 1998. Effect of protein and cell behavior on pattern-grafted thermoresponsive polymer. J. Biomed. Mater. Res. 42:38–44. [DOI] [PubMed] [Google Scholar]
- Clark, P., P. Connolly, and G. R. Moores. 1992. Cell guidance by micropatterned adhesiveness in vitro. J. Cell Sci. 103:287–292. [DOI] [PubMed] [Google Scholar]
- Cooke, R., K. Franks, G. B. Luciani, and E. Pate. 1988. The inhibition of rabbit skeletal muscle contraction by hydrogen ions and phosphate. J. Physiol. 395:77–97. [DOI] [PMC free article] [PubMed] [Google Scholar]
- Cozens-Roberts, C., J. A. Quinn, and D. A. Lauffenberger. 1990. Receptor-mediated adhesion phenomena. Model studies with the radical-flow detachment assay. Biophys. J. 58:107–125. [DOI] [PMC free article] [PubMed] [Google Scholar]
- Curwen, K. D., H. Y. Kim, M. Vazquez, R. I. Handin, and M. A. Gimbrone, Jr. 1982. Platelet adhesion to cultured vascular endothelial cells. A quantitative monolayer adhesion assay. J. Lab. Clin. Med. 100:425–436. [PubMed] [Google Scholar]
- Dembo, M., D. C. Torney, K. Saxman, and D. Hammer. 1988. The reaction-limited kinetics of membrane-to-surface adhesion and detachment. Proc. R. Soc. Lond. B Biol. Sci. 234:55–83. [DOI] [PubMed] [Google Scholar]
- Denn, M. 1980. Process Fluid Mechanics. Prentice-Hall, Inc., Englewood Cliffs, NJ.
- Engler, A., L. Bacakova, C. Newman, A. Hategan, M. Griffin, and D. Discher. 2004. Substrate compliance versus ligand density in cell on gel responses. Biophys. J. 86:617–628. [DOI] [PMC free article] [PubMed] [Google Scholar]
- Erdman, R., R. C. Stahl, K. Rothblum, M. A. Chernousov, and D. J. Carey. 2001. Schwann cell adhesion to a novel heparan sulfate-binding site in the n-terminal domain of alpha4 type v collagen is mediated by syndecan-3. J. Biol. Chem. 277:7619–7625. [DOI] [PubMed] [Google Scholar]
- Ervasti, J. M. 2003. Costameres: the achilles' heel of herculean muscle. J. Biol. Chem. 278:13591–13594. [DOI] [PubMed] [Google Scholar]
- Ervasti, J. M., and K. P. Campbell. 1993. A role for the dystrophin-glycoprotein complex as a transmembrane linker between laminin and actin. J. Cell Biol. 122:809–823. [DOI] [PMC free article] [PubMed] [Google Scholar]
- Evans, K., K. Schifferli, and P. Hawley-Nelson. 1999. High-efficiency transfection of hela cells. Focus. 21:15. [Google Scholar]
- Folch, A., and M. Toner. 1998. Cellular micropatterns on biocompatible materials. Biotechnol. Prog. 14:388–392. [DOI] [PubMed] [Google Scholar]
- Gallant, N. D., J. R. Capadona, A. B. Frazier, D. M. Collard, and A. J. Garcia. 2002. Micropatterned surfaces to engineer focal adhesions for analysis of cell adhesion strengthening. Langmuir. 18:5579–5584. [Google Scholar]
- Garcia, A. J., P. Ducheyne, and D. Boettiger. 1997. Quantification of cell adhesion using a spinning disc device and application to surface-reactive materials. Biomaterials. 18:1091–1098. [DOI] [PubMed] [Google Scholar]
- Giacomello, E., J. Neumayer, A. Colombatti, and R. Perris. 1999. Centrifugal assay for fluorescence-based cell adhesion adapted to the analysis of ex vivo cells and capable of determining relative binding strengths. Biotechniques. 26:764–766. [DOI] [PubMed] [Google Scholar]
- Hack, A. A., L. Cordier, D. I. Shoturma, M. Y. Lam, H. L. Sweeney, and E. M. McNally. 1999. Muscle degeneration without mechanical injury in sarcoglycan deficiency. Proc. Natl. Acad. Sci. USA. 96:10723–10728. [DOI] [PMC free article] [PubMed] [Google Scholar]
- Healy, K. E., A. Rezania, and R. A. Stile. 1999. Designing biomaterials to direct biological responses. Ann. N. Y. Acad. Sci. 875:24–35. [DOI] [PubMed] [Google Scholar]
- Healy, K. E., C. H. Thomas, A. Rezania, J. E. Kim, P. J. McKeown, B. Lom, and P. E. Hockberger. 1996. Kinetics of bone cell organization and mineralization on materials with patterned surface chemistry. Biomaterials. 17:195–208. [DOI] [PubMed] [Google Scholar]
- Helbling-Leclerc, A., X. Zhang, H. Topaloglu, C. Cruaud, F. Tesson, J. Weissenbach, F. M. Tome, K. Schwartz, M. Fardeau, K. Tryggvason, et al. 1995. Mutations in the laminin alpha 2-chain gene (lama2) cause merosin-deficient congenital muscular dystrophy. Nat. Genet. 11:216–218. [DOI] [PubMed] [Google Scholar]
- Hill, A. V. 1938. The heat of shortening and the dynamic constants of muscle. Proc. Roy. Soc. B. 126:136–195. [Google Scholar]
- Horwitz, A., K. Duggan, C. Buck, M. C. Beckerle, and K. Burridge. 1986. Interaction of plasma membrane fibronectin receptor with talin–a transmembrane linkage. Nature. 320:531–533. [DOI] [PubMed] [Google Scholar]
- Ingber, D. E. 1990. Fibronectin controls capillary endothelial cell growth by modulating cell shape. Proc. Natl. Acad. Sci. USA. 87:3579–3583. [DOI] [PMC free article] [PubMed] [Google Scholar]
- Ingber, D. E. 1997. Integrins, tensegrity, and mechanotransduction. Gravit Space Biol Bull. 10:49–55. [PubMed] [Google Scholar]
- Kaufmann, S., T. Piekenbrock, W. H. Goldmann, M. Barmann, and G. Isenberg. 1991. Talin binds to actin and promotes filament nucleation. FEBS Lett. 284:187–191. [DOI] [PubMed] [Google Scholar]
- Koenig, M., A. P. Monaco, and L. M. Kunkel. 1988. The complete sequence of dystrophin predicts a rod-shaped cytoskeletal protein. Cell. 53:219–226. [DOI] [PubMed] [Google Scholar]
- Lo, C. M., H. B. Wang, M. Dembo, and Y. L. Wang. 2000. Cell movement is guided by the rigidity of the substrate. Biophys. J. 79:144–152. [DOI] [PMC free article] [PubMed] [Google Scholar]
- Luk, Y.-Y., M. Kato, and M. Mrksich. 2000. Self-assembled monolayers of alkanethiolates presenting mannitol groups are inert to protein adsorption and cell attachment. Langmuir. 16:9604–9608. [Google Scholar]
- Mason, M. D., G. Davies, and W. G. Jiang. 2002. Cell adhesion molecules and adhesion abnormalities in prostate cancer. Crit. Rev. Oncol. Hematol. 41:11–28. [DOI] [PubMed] [Google Scholar]
- McDevitt, T. C., J. C. Angello, M. L. Whitney, H. Reinecke, S. D. Hauschka, C. E. Murry, and P. S. Stayton. 2002. In vitro generation of differentiated cardiac myofibers on micropatterned laminin surfaces. J. Biomed. Mater. Res. 60:472–479. [DOI] [PubMed] [Google Scholar]
- Mooney, D. J., R. Langer, and D. E. Ingber. 1995. Cytoskeletal filament assembly and the control of cell spreading and function by extracellular matrix. J. Cell Sci. 108:2311–2320. [DOI] [PubMed] [Google Scholar]
- Mortier, E., F. Cornelissen, C. van Hove, L. Dillen, and A. Richardson. 2001. The focal adhesion targeting sequence is the major inhibitory moiety of fak-related non-kinase. Cell. Signal. 13:901–909. [DOI] [PubMed] [Google Scholar]
- Moulder, G. L., M. M. Huang, R. H. Waterston, and R. J. Barstead. 1996. Talin requires beta-integrin, but not vinculin, for its assembly into focal adhesion-like structures in the nematode caenorhabditis elegans. Mol. Biol. Cell. 7:1181–1193. [DOI] [PMC free article] [PubMed] [Google Scholar]
- Munevar, S., Y. L. Wang, and M. Dembo. 2001. Distinct roles of frontal and rear cell-substrate adhesions in fibroblast migration. Mol. Biol. Cell. 12:3947–3954. [DOI] [PMC free article] [PubMed] [Google Scholar]
- Palecek, S. P., C. E. Schmidt, D. A. Lauffenburger, and A. F. Horwitz. 1996. Integrin dynamics on the tail region of migrating fibroblasts. J. Cell Sci. 109:941–952. [DOI] [PubMed] [Google Scholar]
- Pardo, J. V., J. D. Siliciano, and S. W. Craig. 1983. A vinculin-containing cortical lattice in skeletal muscle: transverse lattice elements (“costameres”) mark sites of attachment between myofibrils and sarcolemma. Proc. Natl. Acad. Sci. USA. 80:1008–1012. [DOI] [PMC free article] [PubMed] [Google Scholar]
- Pate, E., and R. Cooke. 1985. The inhibition of muscle contraction by adenosine 5′ (beta, gamma- imido) triphosphate and by pyrophosphate. Biophys. J. 47:773–780. [DOI] [PMC free article] [PubMed] [Google Scholar]
- Peel, M. M., and P. A. DiMilla. 1999. Effect of cell-cell interactions on the observable strength of adhesion of sheets of cells. Ann. Biomed. Eng. 27:236–246. [DOI] [PubMed] [Google Scholar]
- Ra, H. J., C. Picart, H. Feng, H. L. Sweeney, and D. E. Discher. 1999. Muscle cell peeling from micropatterned collagen: direct probing of focal and molecular properties of matrix adhesion. J. Cell Sci. 112:1425–1436. [DOI] [PubMed] [Google Scholar]
- Righi, L., S. Deaglio, C. Pecchioni, A. Gregorini, A. L. Horenstein, G. Bussolati, A. Sapino, and F. Malavasi. 2003. Role of cd31/platelet endothelial cell adhesion molecule-1 expression in in vitro and in vivo growth and differentiation of human breast cancer cells. Am. J. Pathol. 162:1163–1174. [DOI] [PMC free article] [PubMed] [Google Scholar]
- Riveline, D., E. Zamir, N. Q. Balaban, U. S. Schwarz, T. Ishizaki, S. Narumiya, Z. Kam, B. Geiger, and A. D. Bershadsky. 2001. Focal contacts as mechanosensors: externally applied local mechanical force induces growth of focal contacts by an mdia1-dependent and rock-independent mechanism. J. Cell Biol. 153:1175–1186. [DOI] [PMC free article] [PubMed] [Google Scholar]
- Schaller, M. D. 2001. Paxillin: a focal adhesion-associated adaptor protein. Oncogene. 20:6459–6472. [DOI] [PubMed] [Google Scholar]
- Schaller, M. D., C. A. Otey, J. D. Hildebrand, and J. T. Parsons. 1995. Focal adhesion kinase and paxillin bind to peptides mimicking beta integrin cytoplasmic domains. J. Cell Biol. 130:1181–1187. [DOI] [PMC free article] [PubMed] [Google Scholar]
- Schlichting, H. 1979. Boundary-Layer Theory. J. Kestin, translator. McGraw-Hill, Inc., New York.
- Shen, X., and M. Falzon. 2003. Pth-related protein modulates pc-3 prostate cancer cell adhesion and integrin subunit profile. Mol. Cell. Endocrinol. 199:165–177. [DOI] [PubMed] [Google Scholar]
- Stamenovic, D., J. J. Fredberg, N. Wang, J. P. Butler, and D. E. Ingber. 1996. A microstructural approach to cytoskeletal mechanics based on tensegrity. J. Theor. Biol. 181:125–136. [DOI] [PubMed] [Google Scholar]
- Stamenovic, D., Z. Liang, J. Chen, and N. Wang. 2002. Effect of the cytoskeletal prestress on the mechanical impedance of cultured airway smooth muscle cells. J. Appl. Physiol. 92:1443–1450. [DOI] [PubMed] [Google Scholar]
- Thomas, C. H., J. B. Lhoest, D. G. Castner, C. D. McFarland, and K. E. Healy. 1999. Surfaces designed to control the projected area and shape of individual cells. J. Biomech. Eng. 121:40–48. [DOI] [PubMed] [Google Scholar]
- Van Den Brule, F., S. Califice, F. Garnier, P. L. Fernandez, A. Berchuck, and V. Castronovo. 2003. Galectin-1 accumulation in the ovary carcinoma peritumoral stroma is induced by ovary carcinoma cells and affects both cancer cell proliferation and adhesion to laminin-1 and fibronectin. Lab. Invest. 83:377–386. [DOI] [PubMed] [Google Scholar]
- Wang, N., I. M. Tolic-Norrelykke, J. Chen, S. M. Mijailovich, J. P. Butler, J. J. Fredberg, and D. Stamenovic. 2002. Cell prestress. I. Stiffness and prestress are closely associated in adherent contractile cells. Am. J. Physiol. Cell Physiol. 282:C606–C616. [DOI] [PubMed] [Google Scholar]