Abstract
A number of dihydrocholesterol-phospholipid mixtures have been examined using the epifluorescence microscopy of monolayers at the air-water interface. These mixtures form two coexisting liquids. Fluorescence contrast was provided using a variety of different lipid probes. With increasing monolayer pressure, all of the charged probes show contrast inversion at higher dihydrocholesterol concentrations. That is, with increasing pressure the charged probes transfer from one liquid to the other, reversing the fluorescence contrast. A wide variety of phospholipids were studied, and the inversion was seen in all cases. In the inverted state and at the higher dihydrocholesterol concentrations, the immiscibility persists to the highest pressures employed, 30–40 mN/m. The data show that binary dihydrocholesterol-phospholipid mixtures can form three distinct liquids, one of which is interpreted as a phase rich in condensed complex.
INTRODUCTION
There is a long history of the use of phase diagrams to infer complex formation as well as less specific intermolecular interactions in liquids. The early work of F. Dolezalek in 1908 and J. J. Laar in 1910 is described by Prausnitz et al. (1999). In 1989, Corrales and Wheeler extended this early work. They combined a thermodynamic model of complex formation with less specific intermolecular interactions to show how a binary liquid mixture can give rise to two, side-by-side upper miscibility critical points (Corrales and Wheeler, 1989). A number of epifluorescence microscope studies of cholesterol-phospholipid mixtures have been carried out in which such pairs of upper miscibility points were reported (McConnell and Radhakrishnan, 2003). These reported results led to the proposal for the formation of condensed complexes between Dchol (dihydrocholesterol) and cholesterol and phospholipids. The work in this article now casts doubt on the properties of one of the critical points. On the other hand, this work confirms the formation of two two-phase fields, a result that conforms to the Corrales-Wheeler model and points to complex formation.
The use of epifluorescence microscopy to determine the phase diagrams of liquid mixtures of Dchol or cholesterol and phospholipid in monolayers at the air-water interface has been reviewed (McConnell and Radhakrishnan, 2003). The coexisting liquids in these monolayers are visualized by including a low concentration of fluorescent lipid probe in the monolayers. The probe partitions preferentially into one of the phases. Thermodynamic phase diagrams for these mixtures are determined by measuring the pressures and compositions at which two coexisting phases convert to one phase.
In the epifluorescence microscope, the coexisting liquid phases look white and black, when the fluorescent probe partitions unequally between the two phases. For simplicity, we refer to one phase as the black phase, and the other phase as the white phase. Experimentally, a point on the phase boundary is taken to be the pressure-composition point at which the black and white phases merge and become a single gray phase. In the cases where the monolayer consisted of small white domains surrounded by a black liquid, the phase boundary was determined by the pressure and compositions at which the small while domains disappear; that is, the point at which fluorescence contrast is lost (Radhakrishnan and McConnell, 1999a).
In unpublished studies in this laboratory, A. Radhakrishnan observed a striking phenomenon, contrast inversion, in the epifluorescence of phytosterol-phospholipid mixtures. That is, on increasing monolayer pressure, white domains became black, and the surrounding black liquid became white. This contrast inversion is due to a reversible pressure-mediated transfer of the fluorescent lipid probe from (usually circular) liquid domains to the surrounding liquid. This observation, together with independent observations by one of us (T.M.O.), has led to a reexamination of all of our earlier work on cholesterol-phospholipid mixtures. Contrast inversion has now been seen in every mixture studied. The mixtures include a wide variety of phospholipids, varying in chain composition as well as headgroup. Unfortunately, the inversion is generally difficult to detect for small domains (≤2–3 μm), and may have been mistaken in earlier work for domain disappearance. The inversion is easily observed for large liquid domains (≥10 μm). Our earlier work favored examination of smaller domains since they are most likely to have composition equilibrium.
The interpretation of the phase diagrams of cholesterol-phospholipid mixtures in terms of complexes used an extension of the thermodynamic model of Corrales and Wheeler (1989). With this model the reported pairs of upper miscibility critical points provide evidence for condensed complex formation. The two liquid-liquid upper miscibility critical points are referred to as the α- and β-critical points. The work described below throws doubt on the β-critical points we reported in the earlier work. That is, the true β-critical points probably occur at higher temperatures and pressures than we reported. Even so, the present work confirms the existence of both α- and β-two-phase fields. The model of condensed complexes remains consistent with these new results.
The broader significance of the new findings is the conclusion that all phospholipids form three distinct liquid phases in monolayer mixtures with Dchol. Since the phase with an intermediate proportion of Dchol is interpreted as the condensed complex phase, then all phospholipids form condensed complexes with Dchol (and cholesterol). This includes unsaturated phospholipids as well as saturated phospholipids with the shorter fatty acid chains. The stoichiometry of the complex depends on the phospholipid (or mixture of phospholipids), with the unsaturated phospholipids forming complexes with a higher proportion of Dchol. For example, the relative stoichiometry for DOPC (dioleoylphosphatidylcholine) and diphytanoyl PC are ∼70 and 80 mol %, respectively.
METHODS
Microscopy
Epifluorescence microscopy was carried out as described previously (Radhakrishnan and McConnell, 1999b). Briefly, this entails using a Zeiss III RS microscope (Oberkochen, Germany) with a COHU-intensified charge-coupled analog camera. Monolayers were spread onto a homemade Langmuir Teflon trough with a movable barrier. A Wilhelmy plate (R&K GmbH, Potsdam, Germany) measured the surface pressure as the difference between the surface tension of water and that of the monolayer. All experiments were carried out at 24.5 ± 0.5°C. Lipid mixtures and stock solutions were stored at −20°C between uses.
Lipids
Dchol rather than cholesterol was used in most of the experiments to minimize air oxidation. Extensive experiments have shown that the two sterols yield substantially the same phase diagrams (McConnell and Radhakrishnan, 2003). Dchol was purchased as a powder from Sigma-Aldrich (St. Louis, MO) and then brought up to a concentration of 10 mg/ml in chloroform (Sigma-Aldrich 99+% A.C.S. HPLC grade) and used without further purification. DMPC (dimyristoylphosphatidylcholine), DiC15PC (dipentadecanoylphosphatidylcholine), DMPS (dimyristoylphosphatidylserine), diphytanoyl PC, DOPC, and egg sphingomyelin (Egg SM) were purchased from Avanti Polar Lipids (Alabaster, AL) and used without further purification. DMPS, diphytanoyl PC, and Egg SM were acquired as 10 mg/ml solutions in chloroform. DMPC and DiC15PC were purchased as powders and then brought up to a concentration of 10 mg/ml in chloroform. DOPC was purchased as a hygroscopic powder in nitrogen and then brought up in chloroform (first purified on an alumina column) to a concentration of 10 mg/ml in an argon atmosphere to eliminate oxidation. DOPC/Dchol mixtures (1 mg/ml in chloroform/methanol) were also examined in an argon atmosphere for an average of 20–30 min/experiment. No oxidation effects such as unstable transition pressures or changes in domain morphology were seen. All other phospholipid/Dchol mixtures (1 mg/ml in chloroform/methanol) were examined for an average of 20–45 min/experiment. Some experiments were carried out with PBS (phosphate-buffered saline, pH 7.2, 150 mM sodium chloride; Gibco, Grand Island, NY) as the subphase instead of distilled water (pH 5.4) to test the effect of ionic strength on the contrast inversion or transition pressure of the mixture (see Fig. 4 C).
FIGURE 4.
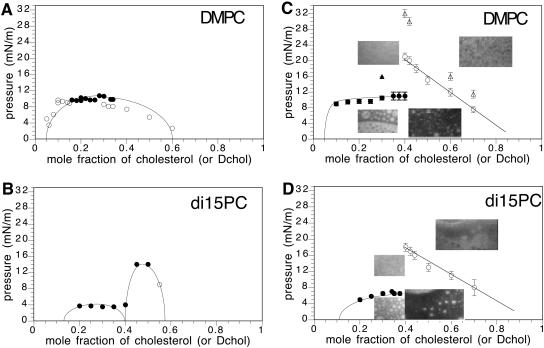
Experimental pressure-composition phase diagrams. (A) DMPC/Dchol (or cholesterol), 0.06–2 mol % Texas Red DHPE probe for Dchol <40 mol %. One mol % NBD probe was used to visualize mixtures at 40 and higher mol % Dchol. The solid circles mark transitions having domain shape fluctuations. The unfilled circles mark transition pressures without shape fluctuations. (B) DiC15PC/Dchol (or cholesterol), 0.4 mol % Texas Red DHPE. A and B are taken from Keller et al. (2000). (C) DMPC/Dchol, 2 mol % Texas Red DHPE probe. The micrograph inserts on the left side of the figure are for a 30-mol % Dchol mixture above and below the critical pressure. Note that (upper left) the membrane is homogeneous above the critical pressure, and (lower left) the membrane is heterogeneous below the critical pressure, showing white domains on a black background, as well as black domains on a white background, as expected for a critical composition. (The α-critical composition is ∼30 mol % Dchol.) The micrographs on the right side are of a 50 mol % Dchol mixture above (upper right) and below (lower right) the contrast inversion pressure. The unfilled circles denote the contrast inversion pressure. When the subphase is PBS, the solid triangle marks the α-critical pressure and the open triangles mark the β-contrast inversion pressures. (D) DiC15PC/Dchol, 2 mol % Texas Red DHPE probe. Micrographs on the left side of the figure refer to a 30-mol % Dchol mixture below and above the transition pressure. Micrographs on the right side refer to 50-mol % Dchol mixture below and above the contrast inversion pressure. The α-critical composition is ∼35 mol % Dchol. The unfilled circles denote the contrast inversion pressure.
Probes
All mixtures studied contained 0.2–2 mol % of a fluorescent probe. Negatively charged probes used were Tred DHPE (n-(Texas-Red sulfonyl)-1,2-dihexadecanoyl-sn-glycero-3-phosphoethanolamine triethylammonium salt), TredX DHPE (n-(Texas-Red-X (X = aminohexanoyl spacer))-1,2-dihexadecanoyl-sn-glycero-3-phosphoethanolamine triethylammonium salt), and NBD DMPE (n-(7-nitrobenz-2-oxa-1,3-diazol-4-yl),-1,2-dimyristoyl-sn-glycero-3-phosphoethanolamine triethylammonium salt). Positively charged probes used were diIC18 (1,1′-dioctadecyl-3,3,3′,3′-tetramethylindocarbocyanine perchlorate) and diIC12 (1,1′-didodecyl-3,3,3′,3′-tetramethylindocarbocyanine perchlorate). Neutral probes used were NBD-C6-HPC (2-(6-(7-nitrobenz-2-oxa-1,3-diazol-4-yl)amino)hexanoyl-1-hexadecanoyl-sn-glycero-3-phosphocholine) and bis-BODIPY PC (1,2-bis-(4,4-difluoro-5,7-dimethyl-4-boro-3a,4a-diaza-s-indacene-3-undecanoyl)-sn-glycero-3-phosphocholine). All probes were purchased from Molecular Probes (Eugene, OR), received in solid form, and brought up in chloroform or methanol, except for NBD-DMPE, which was purchased from Avanti Polar Lipids as a 1-mg/ml solution in chloroform.
Review of monolayer phase diagrams
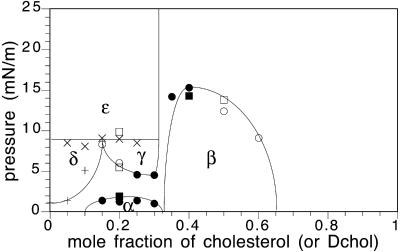
Fig. 1 shows a recently published phase diagram of a mixture of Dchol and phospholipids that describes a number of liquid-liquid immiscibilities (Radhakrishnan and McConnell, 2002). We can briefly outline previous studies of cholesterol-phospholipid mixtures using this diagram. In the first study of liquid-liquid immiscibility in monolayers, it was presumed that the immiscibility in DMPC-cholesterol mixtures was described by a single two-phase field, similar to α in Fig.1 (Subramaniam and McConnell, 1987). See also Hirshfeld and Seul (1990). (In this early work the phase boundary at the higher cholesterol concentrations was uncertain due to properties of the probes used; see Benvegnu and McConnell, 1993.) Later, it was reported that for some lipid mixtures there are two two-phase fields, α and β, as illustrated in this figure (Radhakrishnan and McConnell, 1999a). In this, and in subsequent studies, it was reported that only a limited group of phospholipids formed this second β-two-phase region (McConnell and Radhakrishnan, 2003). The most recent work, illustrated here in Fig. 1, reports the existence of three two-phase fields, α, β, and γ. This article is concerned with 1), a revision in the phase boundaries of the β-two-phase field and 2), an enlargement of the previously reported group of phospholipids that form a β-two-phase field. We will not discuss the γ-two-phase field except to note that this γ-field can also be modeled using the thermodynamic model of condensed complexes.
FIGURE 1.
Illustrative pressure-composition phase diagram for cholesterol-phospholipid mixtures. This diagram describes a ternary monolayer mixture of 70:30 DMPS:GM1 and Dchol (or cholesterol) doped with 0.2 mol % Texas Red DHPE. The subphase is distilled water, pH 5.4. The fields α, β, and γ are liquid-liquid coexistence regions and δ and ɛ are solid-liquid coexistence regions. Phase boundaries for mixtures with cholesterol instead of Dchol are marked by squares. Taken from Radhakrishnan and McConnell (2002). (In unpublished work, A. Radhakrishnan has observed that a similar phase diagram holds for binary DMPS/Dchol mixtures at 37°C.)
RESULTS
Contrast inversion
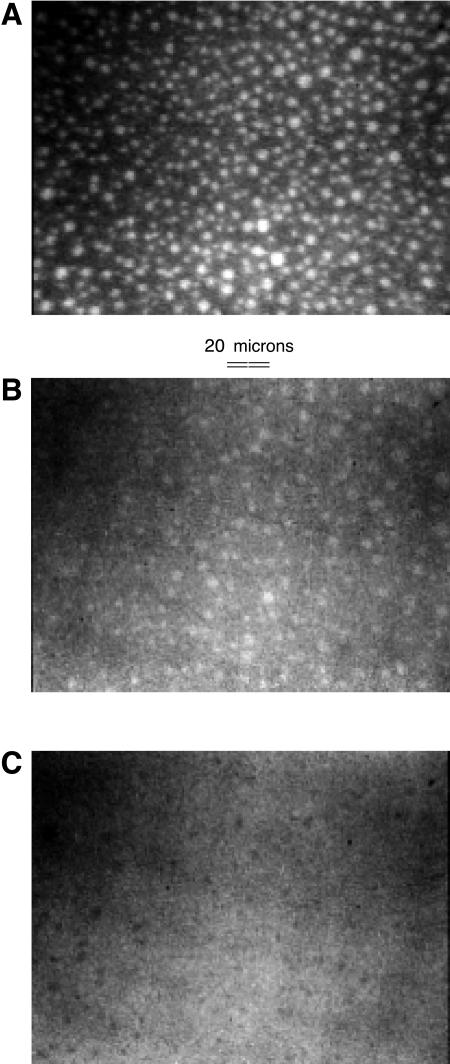
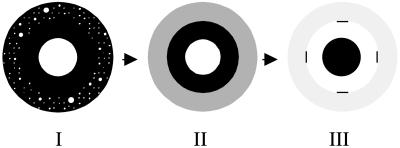
An example of contrast inversion is given in Fig. 2. With increasing monolayer pressure the white fluorescent domains eventually become black, due to loss of fluorescent probe to the surrounding liquid. Slow compression passes through an intermediate pressure where there is no contrast and domains are not visible. More rapid compression and decompression can lead to the distributions depicted in Fig. 3. For example, at lower pressures the probe might be concentrated in a 50-μm diameter circular liquid domain, sketched in Fig. 3 I. A large number of smaller domains are also depicted; these domains are significantly repelled by the large domain and also by one another. Compression gives rise to expulsion of probe from the small domains, producing a region of weak fluorescence (Fig. 3; gray region in II). Further compression results in the expulsion of probe from the large domain, leaving it black and surrounded by a localized white fluorescent halo, as in II→III in Fig. 3. If a domain with the probe distribution in III is subjected to rapid decompression, then the probe flows quickly back into the center liquid domain III→II. At larger distances from the central domain, the equilibration of probe distribution takes place by simple diffusion. This distribution can be nonuniform even after 10 min at a fixed pressure. (Note that the transfer of probe across the phase boundaries is rapid because it is driven by a pressure-dependent jump in the chemical potentials.)
FIGURE 2.
Epifluorescence micrographs of a DOPC/Dchol mixture with 30 mol % Dchol and 2 mol % Texas Red DHPE, subphase distilled water. (A) Monolayer pressure ∼4 mN/m. (B) Monolayer pressure ∼10 mN/m, just below inversion. (C) Monolayer pressure ∼12 mN/m, just above inversion. The smallest white domains in A lose probe to the background first and become invisible in B. The larger remaining white domains in B become diffuse in appearance, and when enough probe is lost, become the black domains in C. (The variation in picture quality and lighting is an artifact, and not due to the microscope or camera.) See Fig. 5 A for pressure-composition plots for this mixture.
FIGURE 3.
Schematic of contrast inversion. (I) At low pressures, ∼1–6 mN/m for DiC15PC, the probe prefers the phospholipid-rich phase. (II) As the pressure is increased to ∼10–12 mN/m, the smaller domains lose contrast first and form a gray cloud. (III) The inversion pressure is reached at ∼12–14 mN/m and all domains (>5 μm) appear black. The four dashes in III are drawn to delineate the outer gray and inner white ring. See text.
Table 1 gives a list of the experiments carried out where contrast inversion was seen. Contrast inversion was observed only in the β-two-phase field. That is, inversion is only seen at Dchol concentrations greater than the cusp composition. In general, pressure cycling of the monolayer ultimately yields domains of uniformly small size (≤10 μm). The smallest domains are doubtless closest to composition equilibrium, but in that case the inversion is more difficult to observe. For the larger domains, no major effect of domain size on the inversion pressure is observed. In the sketch in Fig. 3 (I→II) depicting the first pressure cycle, the smallest observable domains lose probe and “disappear” at pressures below the nominal inversion pressures. It is not known whether they invert at a lower pressure, or simply lose contrast due to gradual loss of probe. The data selected for Table 1 are a compromise between the use of small and large domain sizes. Note particularly the evidence of β-two-phase fields for Dchol mixtures with DMPC, diphytanoyl PC, and DOPC, none of which was reported in earlier work. Note also that Table 1 has two entries for DiC18. This probe shows two inversions and has two inversion pressures.
TABLE 1.
Contrast inversion pressures for charged probes
| Phospholipid | Dchol (mol %) | Probe | Contrast inversion (mN/m) | Domain size (μm) |
|---|---|---|---|---|
| DiC14:0 PC (DMPC) | 40 | Tred DHPE | 22 | ≤3 |
| 42 | Tred DHPE | 20 | ≤5 | |
| 45 | Tred DHPE | 18 | >10< | |
| 50 | Tred DHPE | 15 | >10< | |
| 60 | Tred DHPE | 12 | ≤5 | |
| 70 | Tred DHPE | 6.5 | ≤2 | |
| DiC15 PC | 40 | Tred DHPE | 18 | ≤5 |
| 42 | Tred DHPE | 17 | ≤5 | |
| 44 | Tred DHPE | 16 | >10< | |
| 50 | Tred DHPE | 14 | >10< | |
| 50 | TredX DHPE | 19 | >10< | |
| 50 | NBD DMPE 1.5% | 10 | 2–5 | |
| 50 | diIC12+ | 14 (inc) | 2–5 | |
| 50 | diIC18+ | 10 (inc) | ≤5 | |
| 60 | Tred DHPE | 11 | >10< | |
| 70 | Tred DHPE | 8 | >10< | |
| 70 | TredX DHPE | 11 | >10< | |
| 70 | NBD DMPE 1.5% | – | >10< | |
| 70 | diIC12+ | 5 (inc) | 2–5 | |
| 70 | diIC18+ | 6 (inc), 14 (inc) | ≤5 | |
| 2:1 diC14 PS | 50 | Tred DHPE | 14 | 2–5 |
| diC14 PC (DMPS:DMPC) | 70 | Tred DHPE | 9 | ≤5 |
| 90 | Tred DHPE | 4 | ≤5 | |
| diPhytanoyl PC | 80 | Tred DHPE | 16 | 2–5 |
| 90 | Tred DHPE | 13 | 2–5 | |
| diC18:1 PC (DOPC) | 70 | Tred DHPE | 12 | 2–5 |
| 80 | Tred DHPE | 10 | 2–5 | |
| Egg sphingomyelin | 45 | Tred DHPE | 14 | <2 |
Dye concentrations were 2 mol % unless otherwise stated.
+, positively charged probes; (inc), the inversion pressure increases with each subsequent compression; and >10<, domains are larger and smaller than 10 μm.
Both DiI probes gradually leave the monolayer (presumably forming micelles) with every compression. The α-phase critical pressure and the inversion pressures increase as a likely consequence of this loss, by ∼1 or 2 mN/m for each consecutive compression up to 40 mN/m. In contrast, increases of Tred DHPE concentration leads to an increase of the α-phase critical pressure.
The gradual loss of DiI probe from the monolayer is evidenced by gradual loss of fluorescence intensity and change of critical and inversion pressures. The other charged probes do not show this effect, nor is there any significant loss of the membrane lipids from the monolayer in our experiments.
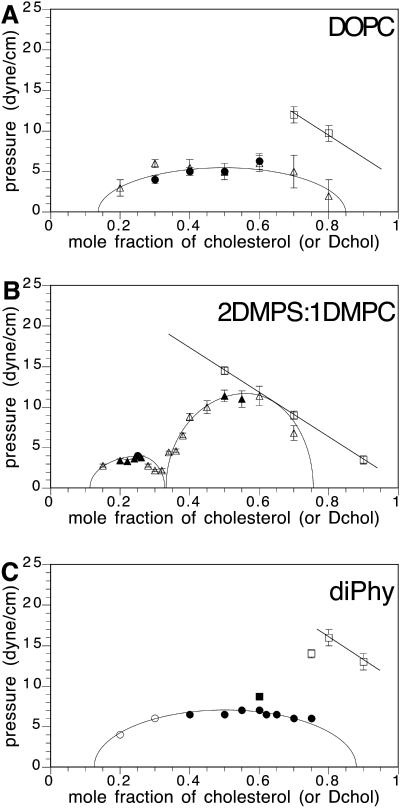
Fig. 4, A and B, shows phase diagrams reported earlier. The diagram in Fig. 4 A describes a single two-phase region with a critical composition of ∼25 mol % Dchol, and a critical pressure of ∼10 mN/m. The inversion data for the same mixtures are shown in Fig. 4, C and D, respectively. The data in Fig. 4 C describe liquid-liquid immiscibility at pressures well above the 10-mN/m critical pressure. The phase diagram in Fig. 4 B is taken from Keller et al. (2000). The data in Fig. 4, C and D, show that contrast inversion in the β-two-phase fields was missed in the earlier work. In the case of Fig. 4, A and C, the data in the range 15–35 mol % are judged to be essentially the same in the two cases. Fig. 5 gives three additional examples of previously reported phase diagrams. In each case, a β-two-phase field is present.
FIGURE 5.
Experimental pressure-composition phase diagrams. (A) DOPC/Dchol. The solid circles represent transition pressures for mixtures visualized with 0.5 mol % Texas Red DHPE and the unfilled squares represent transition pressures for mixtures visualized with 2 mol %. The solid circles also denote domain shape fluctuations at the transition pressure. The critical composition is ∼50 mol % Dchol. The unfilled squares mark the contrast inversion pressures. The triangles are taken from Hagen and McConnell (1997; 0.25 mol % Texas Red DHPE). (B) 2:1 DMPS:DMPC/Dchol. The solid circle denotes the critical pressure for 25 mol % Dchol visualized with 1 mol % Texas Red DHPE. The unfilled squares represent contrast inversion for mixtures visualized with 2 mol % Texas Red DHPE. The triangles are from Radhakrishnan and McConnell (1999a; 0.2 mol % Texas Red DHPE). The α-critical composition is ∼25 mol % Dchol. (C) Diphytanoyl PC/Dchol. The squares represent mixtures visualized with 2% Texas Red DHPE. The solid square denotes an α-transition with domain fluctuations. The unfilled square at 70 mol % Dchol represents a transition from two phases to one, whereas the unfilled squares at 80 mol % and 90 mol % Dchol mark contrast inversion. The circles are taken from Keller et al. (2000; 0.06–0.2 mol % Texas Red).
Charged probes and subphase ionic strength
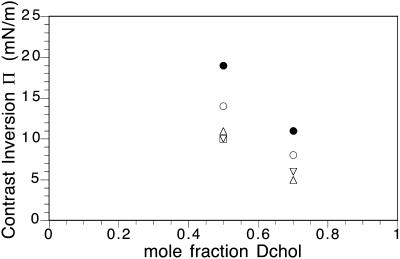
All the data in Figs. 4 and 5 show a strong dependence of the inversion pressure on membrane composition. This was surprising, since we expected the inversion pressure to be constant in a two-phase field. As discussed later, an effect of probe charge was suspected. To test this, the effect of ionic strength on inversion pressure was investigated, with the results shown in Fig. 4. Also, inversion pressures were measured for different charged probes, with results given in Fig. 6. All the charged probes showed inversion pressures that depend on Dchol concentration.
FIGURE 6.
Contrast inversion pressures for DiC15PC/Dchol mixtures with 50 mol % and 70 mol % Dchol having charged probes. The negatively charged probes are Texas Red DHPE 2 mol % (unfilled circles), Texas Red-X DHPE 2 mol % (solid circles), and NBD head-labeled DMPE 1.5 mol % (unfilled square). Positively charged probes are diIC12 2 mol % (up triangle) and diIC18 2 mol % (down triangle). Errors (not shown) are 5–10%.
Neutral probes
Two neutral probes were used, NBD-C6-HPC and BODIPY PC. With these probes, inverted domains were never seen. The BODIPY PC probe at 0.3 mol % and 50 mol % diC15 PC/Dchol showed a complex behavior. With increasing pressure, the probe exits the white circular domains, producing a diffuse white cloud. On further pressure increase, domains reappear at 20–25 mN/m and continue to be seen until 40 mN/m, where compression is halted. In the case of 0.5% NBD, DiC15 PC 30 mol % Dchol, there was no effect of PBS on the α-critical point pressure, and no evident effect on the β-two-phase region.
Properties of the β-two-phase liquids
In our earlier experimental studies of Dchol-phospholipid mixtures, we concluded that these mixtures can form three distinct liquids. This conclusion remains valid in mixtures showing contrast inversion. Various lines of evidence are summarized below.
Contrast inversion is never seen in the α-two-phase field, and is always seen in the β-two-phase field when domains are sufficiently large (≥10 μm). Thus, the properties of the α- and β-immiscibility fields are distinctly different, implying the existence of three liquid phases.
For all the probes employed, and at pressures below the contrast inversion pressure, the probes preferentially partition into the phase lowest in cholesterol concentration, both in the α- and β-composition regions. This in itself does not distinguish between a single two-phase region and two two-phase regions. However, as one changes composition, the relative proportions of black and white phases show a sudden switch at the cusp composition, and this is only consistent with two two-phase fields. This relative partitioning is reversed above the contrast inversion pressure.
In certain ranges of pressure, liquid domains in the β-two-phase seemingly attract one another, and sometimes fuse. This is only seen with membranes with charged probes. This has never been observed with domains in the α-two-phase field. The origin of this attraction is not understood. The attraction and fusion has been observed at pressures both below and above the inversion pressure, for the larger domains (≥10 μm). The attraction is pressure-dependent. Fusing domains in the β-region look like the fusion of liquid droplets. See Discussion.
Brownian domain motion sometimes appears suppressed for domains in the β-region. This effect is only seen when using charged probes.
In both α- and β-regions repeated pressure cycling of the monolayer between high and low pressures leads to the formation of small domains, a few μm in diameter. For small white domains in a black background at the lower pressures, the domains in the α- and β-regions look somewhat different, in part because the black background is darker in the β-two-phase region.
Composition equilibration and small domains
Mixtures of Dchol and phospholipid generally form large and variable-sized domains when first spread from a chloroform-methanol solvent at the air-water interface. The constant pressure equilibration rate of domain size (and composition) in such monolayers with large domains is very low. However, due to the special properties of dipolar monolayers, composition equilibrium is virtually assured near the α-critical point. This equilibration is expected because of the striping in which the two phases become more and more interdigitated. On the other hand, in the β-two-phase region, there is no corresponding condition where one can be assured of equilibration. By trial and error we have found that cycling the monolayer several times between low and high pressures can yield a “snowstorm” pattern—a large number of small domains of similar size and shape, somewhat reminiscent of a snowstorm. We think it likely that this represents an equilibrium condition, since equilibration by diffusion should be relatively rapid when domains are relatively uniform in size and small.
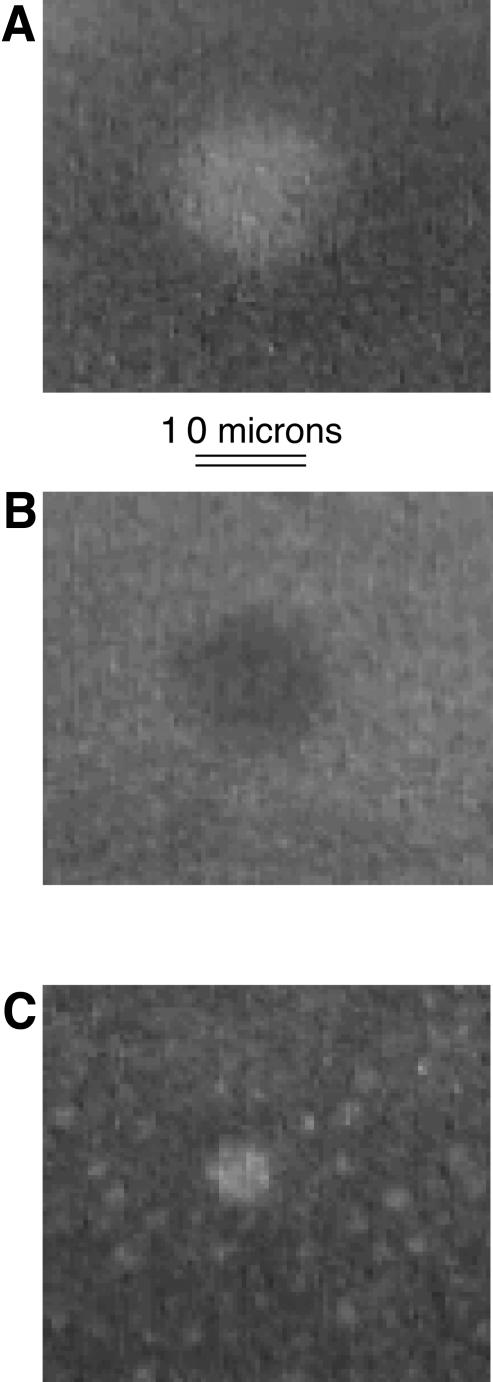
A possible mechanism for the formation of smaller domains in the β-region is suggested by the data in Fig. 7. In this experiment the inversion of a 16-μm-diameter domain (A to B) is brought about by an increase in pressure from 10 mN/m to 15 mN/m. The monolayer pressure is raised to 40 mN/m and then lowered to 7 mN/m, yielding the smaller domain (C), ∼5 μm in diameter.
FIGURE 7.
Epifluorescence micrographs of a DiC15PC/50 mol % Dchol mixture with 2 mol % Texas Red DHPE, water subphase. Some domains break into smaller domains after compressing the monolayer to high pressures. (A) Monolayer pressure ∼10 mN/m, below the contrast inversion pressure. (B) Monolayer pressure ∼15 mN/m, just above inversion. (C) Monolayer pressure ∼7 mN/m after compressing monolayer to high pressure (∼40 mN/m) and coming back down in pressure through the inversion. The larger white domain in A inverts to a black domain of the same size in B. After reaching a high pressure and coming back down through the inversion, the large white domain in A is now a smaller white domain surrounded by many even smaller domains in C. The pictured domains are circular, but generally look diffuse just before and after inversions.
DISCUSSION
Schematic phase diagram
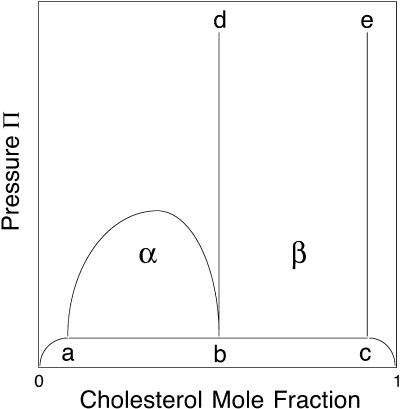
A schematic phase diagram for the various mixtures studied in this work is given in Fig. 8. This diagram differs quantitatively from the previously reported diagrams in that here there is no β-critical point at room temperature. The most important objective in this work has been to confirm the existence of two two-phase fields, α and β. The evidence for this is based on the distinctive properties of these two regions as summarized above in Results. Contrast inversion is one of the distinctive properties of the β-region, and is discussed later.
FIGURE 8.
Schematic phase diagram showing two two-phase fields, α and β. The triple point line a-b-c has not been seen experimentally. Contrast inversion is seen in the β-two-phase region. The composition of the phase boundary e–c is likely to be close to that of pure Dchol. The phase boundary d–b lies close to the cusp composition.
Absent the existence of the α- (and γ-) two-phase field, the β-two-phase field by itself might be thought of as simply describing the solubility of Dchol (or cholesterol) in a liquid phospholipid. That is, the phase boundary b–d in Fig. 8 would correspond to the solubility limit for Dchol, with respect to the separation into a cholesterol-rich monolayer phase. (In bilayers the cholesterol may leave the membrane and form insoluble crystals; see Veatch and Keller, 2002; Huang and Feigensen, 1999.) However, the invariable presence of the α-two-phase field in all of the Dchol-phospholipid mixtures shows that complexes (or some molecular equivalent) must be present. The existence of the α-two-phase field is pointed to by domain critical point striping (Keller and McConnell, 1999).
The α-critical point together with the neighboring β-region suggest a cusp in between these regions in the phase diagram. On infrequent occasions a monolayer has been formed with a putative cusp composition, and no domains were observed, in accord with the presence of a deep cusp in the phase diagram (data not shown). Most often however, the monolayer does not have a uniform composition, and domains are seen at the cusp composition. In fact, traces of striping can sometimes even be seen in the β-region, but these disappear on pressure cycling of the monolayer. (For example, striping was observed in one experiment at ∼12 mN/m under nominally the same conditions as the first entry in Table 1.)
The joint presence of the α- and β-regions at the lower pressures implies the presence of complexes at the lower pressures, but does not provide evidence they are present at higher pressures. However, other data at higher pressures, such as the chemical activity of cholesterol, average area per molecule, and, in one case, the γ-field, all indicate the presence of complexes at the higher pressures (McConnell and Radhakrishnan, 2003).
Despite efforts, we have not been able to find the putative two-phase field below the a-b-c triple point line in Fig. 8.
Electrostatics of contrast inversion
Pressure-mediated contrast inversion is an interesting effect. It is useful to discuss this in terms of the chemical potentials of the probe in the cholesterol-rich and phospholipid-rich phases, μr and μp, respectively. If we assume the probe can be described by an ideal solution, then the chemical potential of the probe in the phospholipid-rich phase is
 |
(1) |
In the phospholipid-rich phase, cp is the concentration of the probe, and Ap is the molecular area of the probe. The monolayer pressure is π. At equilibrium, when μc = μp, the probe has an equilibrium distribution,
 |
(2) |
Here ΔA = Ac − Ap and K0 is the partition equilibrium constant at zero pressure. With increasing pressure, the probe distribution changes from favoring the phospholipid-rich phase to favoring the cholesterol-rich phase. Thus ΔA is negative; the probe molecule contracts on entering the cholesterol-rich phase. To illustrate the orders of magnitude, a 15 Å2 change in molecular area, together with a 20-mN/m change in pressure, changes this equilibrium constant by a factor of e = 2.7. Equation 2 is thus reasonable, in that it describes the right order of magnitude of a pressure dependence of the probe distribution. The inferred sign for ΔA is negative for the neutral probes, and is presumed to be negative also for the charged probes. (The double contrast inversion observed for diIC18 could arise from a pressure dependence of ΔA or λ, the electrostatic screening parameter discussed in the Appendix.)
Equation 2 is at variance with the experimental results since it describes a ratio, cc/cp, that should be constant in a two-phase field at a given pressure. We suggest that the slope of the contrast inversion line is related to the experimental method and the kinetics of the probe redistribution. Note that the probe redistribution is relatively slow except near phase boundaries. The flux of a probe molecule, ji, is related to the gradient of the chemical potential, Ji = (Θ/kT)ci∇μi, where Θ is the diffusion coefficient of the probe. On changing monolayer pressure, there is an immediate and very large chemical potential gradient at the phase boundary, and a corresponding large molecular flux across the boundary. During pressure change, a phase boundary may transiently “disappear” because the concentration of probe is equal on both sides, even though the system is not at global equilibrium. Under these conditions a dependence of the chemical potential on probe concentration can lead to a dependence of the inversion pressure on membrane composition, as discussed below.
Imagine that the probe molecules repel one another. In the presence of a surface electrostatic potential, a chemical potential takes the form of
 |
(3) |
If during the course of compression there is a local equality of the chemical potentials at the phase boundary, then the local partition constant becomes
 |
(4) |
The charge on the probe is qe and Δφ = φc − φp is the difference in surface potentials between the two phases, corresponding to the transfer of the probe from the phospholipid-rich phase to the cholesterol-rich phase. Equation 4 is also at variance with the experimental results if one assumes global equilibrium and uses the Gouy-Chapman theory of surface potentials. That is, with this theory the change in surface potential is zero at the inversion point since, at this point, cp = cc. It is shown in the Appendix that plausible deviations from this theory of surface potentials can lead to a substantial dependence of the ratio cc/cp on the magnitude of these concentrations. These deviations correspond simply to a stronger repulsion between probe molecules in one phase compared to the other phase. Although it is true that the inversion pressures were measured at a fixed average global concentration, it is likely that the inversion pressures measured at the higher cholesterol concentrations entail higher local probe concentrations. That is, the typical experiment starts out at a low pressure where the probe is largely concentrated in phospholipid-rich domains. The pressure is then raised until the domain boundary disappears. At the higher cholesterol concentrations, the relative area of the phospholipid-rich domains is smaller, and thus the initial probe concentration is higher. If the inversion pressure depends on probe concentration, then the inversion pressures can be lower at the higher cholesterol concentrations.
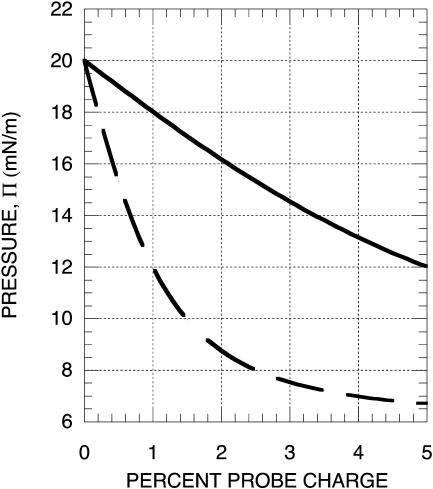
A theoretical relation between inversion pressure and charged probe concentration is given in Fig. 9 and in the Appendix. PBS suppression of probe-probe repulsions increases the contrast inversion pressure, as seen experimentally in Fig. 4 C, and theoretically in Fig. 9. In line with this conjecture, the inversion pressures for the diI probes in Table 1 do show a gradual drift to higher values on pressure cycling, a result consistent with the electrostatic effect described here, and a slow approach to global equilibrium in the monolayer.
FIGURE 9.
Theoretical dependence of inversion pressure on the concentration of charged probe. The percent probe charge is 100 qx, where q is the charge on the probe and x is the mol fraction probe in the membrane. The calculated inversion pressures show a marked decrease with increasing probe concentration, which may account for the observed dependence of the inversion pressure on membrane composition. The calculations also show an increase in the inversion pressure with increasing ionic strength. The calculations use Eq. A4 and the parameters for distilled water (lower curve), λc = 0.5 and λp = 1.0; and for 150 mM saline (upper curve), λc = 0.1 and λp = 0.2. The inversion pressure at 0% probe charge, πI0, is taken to be 20 mN/m.
Charge symmetry
It is clear that probe charge plays a significant role for contrast inversion. The relative effects of pressure and charge on probe distribution can be inferred from Eq. 4. The electrostatic term must be comparable to the pressure-area terms in Eq. 4 for there to be an effect of charge.
Note that Eq. 4 is invariant to reversal of the sign of the charge on the probe, q → −q. This is because the effect we describe is the repulsion between like charges. As seen in Fig. 6, the contrast inversion effect is observed with both positively and negatively charged probes. We do not expect exact equivalence of the results with different probes, however. For example, the potentials in Eq. 4 should include sources other than the probe, such as the well-known dipolar potentials. This destroys the q → −q symmetry in the electrostatic effects (McConnell, 1991). Different probes with different charges also have different properties for other reasons. For example, different probes might have different area changes, ΔA. Accordingly, it is not surprising to see the differences in Fig. 6 for different probes.
Domain-domain attraction
As mentioned earlier, domains in the β-field sometimes appear to attract one another when charged probes are used. This effect can be seen for pairs of large domains as well as small domains (2–3 μm) in the vicinity of large domains (≥10 μm). The attraction is most easily observed below the inversion pressure, and is reversible over a limited pressure range (the domains moving together with increasing pressure, and moving apart with decreasing pressure). Electrostatic attraction can only occur if the domains have different compositions. That is, if the dipole densities in two domains are ρ1 and ρ2, and the background liquid has a dipole density ρ0, then the domains will attract one another electrostatically if (ρ1−ρ0) has a sign that is opposite to that of (ρ2−ρ0). However, this attraction in a two-phase field implies some deviation from composition equilibrium. Our observed close correlation between motion and rate of change of pressure is consistent with transient deviations from composition equilibrium.
It is possible that the important deviation from composition equilibrium is due to the probe itself. That is, there are two comparable contributions to the dipole densities ρ in these monolayers. One arises from the molecular dipoles of the lipids (and possibly water), and the other from the ionic double layer. Both correspond to surface potentials of the order of 100 mV (Benvegnu and McConnell, 1993; Evans and Wennerstrom, 1994). Thus pressure-mediated redistribution of the probe itself might provide electrostatic conditions for domain attraction.
After a monolayer with a β-composition has been cycled through pressure changes from low to high to low a number of times, the domains generally become smaller and domain-domain attraction is not observed. For small domains the electrostatic forces are weaker and the composition equilibration rates are higher. Whatever the explanation of the domain-domain attraction, it remains true that this attraction is never seen in the α-field.
Biological relevance
From the work summarized in Table 1, it is clear that all of the phospholipids studied show strong evidence for the formation of a β-two-phase field as well as an α-two-phase field. The presence of both fields in these lipid mixtures implies a special intermolecular interaction, which has been described elsewhere in terms of condensed complex formation (McConnell and Radhakrishnan, 2003). Judging from the present work, this complex formation is more general than realized previously, and indeed is likely to be universal for all phospholipids that form monolayers with Dchol, or cholesterol.
The possible biological relevance of studies of liquid-liquid immiscibility in monolayers has been reviewed recently (McConnell and Radhakrishnan, 2003). The present work brings out one additional point. It is noteworthy that the distribution of the fluorescent probe in these mixtures is delicately balanced between the various phases. Thus, at the lower pressures, in the α-field, the probe preferentially partitions in the phospholipid-rich phase, relative to the condensed complex phase. In the β-two-phase field, the fluorescent probe preferentially partitions into the condensed complex phase, relative to the Dchol phase. The latter relative preference is reversed at the higher pressures. Thus we may conjecture that in animal cell membranes the distributions of lipids and proteins may be delicately balanced between different molecular environments.
Acknowledgments
We are indebted to Arun Radhakrishnan, Kay Yee Lee, Marija Vrljic, and Stephanie Nishimura for helpful discussions.
Supported by the National Institutes of Health grant 5R01AI13587-27.
APPENDIX: SURFACE POTENTIALS AND PROBE DISTRIBUTION
In some of the experiments the probe is the only charged lipid in the monolayer. In the following calculation it will be seen that the repulsions between the probe molecules are comparable to kT in a distilled water subphase even when the probe is present at a low concentration (1 mol %). The partitioning of the probe between co-existing liquid phases can therefore be affected by these electrostatic repulsions. The following calculation relates the probe distribution between two phases to the average probe concentration in the monolayer, electrostatic energies, and monolayer pressure.
The surface charge density in phase p or c is related to the surface probe concentration, σp = qecp. The surface charge density and surface potential can be related to one another by the Gouy-Chapman equation,
 |
(A1) |
Here D is the dielectric constant of the aqueous solution, and κ is the inverse Debye screening length (Evans and Wennerstrom, 1994). The use of more than one screening distance  ,
,  is discussed later.
The term in the chemical potential (Eq. 3) involving the surface potential is significant, comparable to kT even for singly charged probes with concentrations of the order of 1% mol. For example, at this concentration, the parameter s in Eq. A1 is of order 1 when the molecular area is 40 Å2, D = 80, and  (This screening distance is at least a factor-of-10 less than the Debye screening distance in distilled water in the absence of a membrane surface.) The flexible, zwitterionic headgroups of the phospholipids are concentrated at the membrane surface in close proximity to the probe charges, and doubtless significantly screen their repulsions. A screening distance of
  is roughly equivalent to that of a 1-mM salt solution.
Strictly speaking, the pressure in Eq. 3 is not the applied monolayer pressure, but rather the difference between the applied monolayer pressure and an electrostatic pressure, πe (Evans and Wennerstrom, 1994). An upper limit on the electrostatic pressure-area term, πe Ap, is 2qXkT, where X is the mole fraction of probe. Thus the electrostatic pressure term is neglected in the following discussion. With increasing probe concentration above 1 mol %, the electrostatic pressure term grows more rapidly than the surface potential term. However, between 1 and 10 mol % the surface potential term is larger, so we shall neglect the electrostatic pressure term in this discussion.
We use Eq. 4 to obtain a relation between the pressures for contrast inversion, πI , πI0 in the presence and absence of electrostatic effects,
 |
(A2) |
According to the standard Gouy-Chapman theory, equal probe concentrations implies equal charge densities, and thus equal surface potentials (Δφ = 0 in Eq. A2). This in turn implies that there is no effect of probe charge on the contrast inversion pressure. However, this conclusion must not be quantitatively accurate since the electrostatic and dielectric energies of the probes in the two membrane environments cannot possibly be exactly equal to one another. We model this complicated energetic problem ad hoc by using two screening lengths  and
and  For example we assume
  for the phospholipid-rich phase, and
  for the cholesterol-rich phase, all with a distilled water subphase. That is, the charge repulsions are larger at the phospholipid-rich surface (condensed complex phase).
Equations A1 and A2 can be combined to yield
 |
(A3) |
The coefficient of the log term in this equation is significant, of the order of −30 mN/m for an area change of −20 Å2. From Eq. A3 it is clear that the inversion pressure does not depend on probe concentration when the s-values are small compared to 1. By recalling that s is ∼1 for singly charged probes at 1% mol, and D = 80, it will be seen that the above equation can be written in a convenient, rough form in terms of the percent probe in the membrane,
 |
(A4) |
Here  and
and  , where
  is the reference screening length when distilled water is the subphase; x is the mol % probe (x = 100X).
Fig. 9 shows plots of calculated inversion pressures versus percent probe charge in the monolayer, qx. The lower plot refers to a distilled water subphase, and the upper plot to a 150-mM saline solution subphase. It will be seen that increasing probe concentration leads to a decrease in the inversion pressure, since the probe repulsions are larger in the phospholipid-rich phase. The screening distances are taken to be 10 and 20 Å for the cholesterol and phospholipid phases in the saline solution.
To summarize, the experimentally observed lipid composition dependence of the inversion pressure has suggested to us that electrostatic repulsions between the charged probe molecules affect the measured inversion pressures. Here these electrostatic repulsions are modeled using Gouy-Chapman theory. This involves a parameter, the product κD of a reciprocal Debye length and a dielectric constant (Eq. A1). Since the charges on the probes are in close proximity to a concentrated layer of flexible dipoles, this product cannot be equal to that appropriate to distilled water. In this connection we make two ad hoc assumptions; 1), when the subphase is distilled water, the screening distances for the cholesterol and phospholipid phases are different,  ; and 2), these distances are assumed to be of the order of magnitude of 100 Å (the reference distance
  ), and D = 80. For our illustrative calculation we have taken
  when the subphase is distilled water. In PBS these distances are reduced by a factor of 10, yielding values close to Debye lengths for a 150-mM salt solution.
References
- Benvegnu, D. J., and H. M. McConnell. 1993. Surface dipole densities in lipid monolayers. J. Phys. Chem. 97:6686–6691. [Google Scholar]
- Corrales, L. R., and J. C. Wheeler. 1989. Chemical reaction-driven phase transitions and critical points. J. Chem. Phys. 91:7097–7112. [Google Scholar]
- Evans, D. F., and H. Wennerstrom. 1994. The Colloid Domain. VCH Publishers, New York.
- Hagen, J. P., and H. M. McConnell. 1997. Liquid-liquid immiscibility in lipid monolayers. Biochim. Biophys. Acta. 1329:7–11. [DOI] [PubMed] [Google Scholar]
- Hirshfeld, C. L., and M. Seul. 1990. Critical mixing in monomolecular films: pressure-composition phase diagram of a two-dimensional binary mixture. J. Phys. Fr. 51:1537–1552. [Google Scholar]
- Huang, J., and G. W. Feigensen. 1999. A microscopic interaction model of maximum solubility of cholesterol in lipid bilayers. Biophys. J. 76:2142–2157. [DOI] [PMC free article] [PubMed] [Google Scholar]
- Keller, S. L., A. Radhakrishnan, and H. M. McConnell. 2000. Saturated phospholipids with high melting temperature for complexes with cholesterol in monolayers. J. Phys. Chem. B. 104:7522–7527. [Google Scholar]
- Keller, S. L., and H. M. McConnell. 1999. Stripe phases in lipid monolayers near a miscibility critical point. Phys. Rev. Lett. 82:1602–1605. [Google Scholar]
- McConnell, H. M. 1991. Structures and transitions in lipid monolayers at the air-water interface. Annu. Rev. Phys. Chem. 42:171–195. [Google Scholar]
- McConnell, H. M., and A. Radhakrishnan. 2003. Condensed complexes of cholesterol and phospholipids. Biochim. Biophys. Acta. Biomembr. 1610:159–173. [DOI] [PubMed] [Google Scholar]
- Prausnitz, J. M., R. M. Lichtenthaler, and E. M. de Azevedo. 1999. Molecular Thermodynamics of Fluid-Phase Equilibria. Prentice Hall, Upper Saddle River, NJ.
- Radhakrishnan, A., and H. M. McConnell. 1999a. Cholesterol-phospholipid complexes in membranes. J. Am. Chem. Soc. 121:486–487. [Google Scholar]
- Radhakrishnan, A., and H. M. McConnell. 1999b. Condensed complexes of cholesterol and phospholipids. Biophys. J. 77:1507–1517. [DOI] [PMC free article] [PubMed] [Google Scholar]
- Radhakrishnan, A., and H. M. McConnell. 2002. Critical points in charged membranes containing cholesterol. Proc. Natl. Acad. Sci. USA. 99:13391–13396. [DOI] [PMC free article] [PubMed] [Google Scholar]
- Subramaniam, S., and H. M. McConnell. 1987. Critical mixing in monolayer mixtures of phospholipid and cholesterol. J. Phys. Chem. 91:1715–1718. [Google Scholar]
- Veatch, S. L., and S. L. Keller. 2002. Organization in lipid membranes containing cholesterol. Phys. Rev. Lett. 89:268101. [DOI] [PubMed] [Google Scholar]


