

Abstract
A mathematical model of the lac operon which includes all of the known regulatory mechanisms, including external-glucose-dependent catabolite repression and inducer exclusion, as well as the time delays inherent to transcription and translation, is presented. With this model we investigate the influence of external glucose, by means of catabolite repression and the regulation of lactose uptake, on the bistable behavior of this system.
INTRODUCTION
Given their intrinsic nonlinearity, simple biochemical systems regulated at the level of gene expression are capable of complex dynamic behavior. Among the various patterns of behavior emerging from the regulation associated with nonlinear kinetics, bistability is extremely interesting. Bistability allows a true discontinuous switching between alternate steady states that can convert graded inputs into switch-like responses. Another important feature associated with bistability is hysteresis: if, in order for the system state to switch from one steady value to another, the input signal must surpass a given threshold. To switch back to the original state value, the input signal must be decreased below another (smaller) threshold. This permits a discontinuous evolution of the system along different possible pathways, which can be either reversible or irreversible, and may provide the system with an epigenetic (nongenetic) memory. The evolutionary significance of bistability, as well as its possible role in explaining some basic processes of life, like cell differentiation or the maintenance of phenotypic differences in the absence of genetic and environmental differences, has recently been discussed elsewhere (Laurent and Kellershohn, 1999; Casadesús and D'Ari, 2002; Ferrell, 2002).
Although it was not realized at the time, the lactose operon in Escherichia coli was one of the first molecular systems in which the bistability was experimentally demonstrated (Novick and Wiener, 1957). See Laurent and Kellershohn (1999) for a detailed discussion on this issue. Laurent and Kellershohn (1999) proposed a simple model of the lactose operon that, with a proper choice of the parameter values, was able show a bistable behavior. More recently, Yildirim and Mackey (2003) developed a more detailed mathematical model, in which the parameters were all estimated from reported experimental data, and showed that, indeed, there is bistability in the lactose operon dynamics for realistic extracellular lactose concentration values.
The model of Yildirim and Mackey does not consider the regulatory mechanisms at the transcriptional level in detail. Instead, it assumes that all of them can be lumped into a single Hill-type equation despite the fact that the available experimental data allow a more detailed modeling approach. Furthermore, the Yildirim and Mackey model fails to include two important regulatory mechanisms that depend on the extracellular glucose concentration: catabolite repression and inducer exclusion. These mechanisms are essential to understand the lactose operon performance when the bacterial culture grows in a glucose-rich medium. Thus, it is important to investigate their influence on the dynamic system behavior.
In this study, we develop a more detailed mathematical model of the lactose operon that takes into account all of its known regulatory mechanisms, including catabolite repression and inducer exclusion, as well as the time delays inherent to transcription and translation. All of the model parameters are estimated from the existing experimental literature. The model equations are numerically solved to investigate the influence of the glucose-dependent regulatory mechanisms (catabolite repression and lactose uptake) on the system bistable behavior. Our results show that bistability is maintained for a large range of realistic extracellular glucose concentrations. It is known that the presence of glucose in the bacterial medium affects the induction of the lactose operon by external lactose. According to our results, this effect is attained in two different ways: first, by increasing the external lactose concentration threshold value at which the system shifts from the uninduced to the induced state, and second by decreasing the activation level of the lactose operon after induction has taken place.
In the next section (The lac Operon) we describe the lactose operon regulatory mechanisms and the way they interact to control operon performance. The mathematical model is developed in Model Development. The Numerical Results section outlines the numerical procedure used to solve the delay-differential equations. The numerical experiments performed to investigate the influence of catabolite repression and inducer exclusion on the lactose operon bistable behavior are also described in Model Development, together with the results they give. Summarizing comments are provided in Concluding Remarks. All of the model parameters are estimated from reported experimental data in the Appendix.
THE lac OPERON
The lac operon comprises the genes whose encoded proteins allow lactose metabolism in bacteria like E. coli. For the lac operon to be activated, two conditions must be fulfilled: 1), an activator (lactose) and 2), cAMP must be present in the intracellular medium. Until the early 1980s the lac operon (see Fig. 1) was thought to consist of one operator (O1), one promoter (P1), and one CAP complex binding site (C1), which control the activation of the lac operon as explained below (Beckwith, 1987).
FIGURE 1.

Regulatory elements of the lac operon. The upper scale identifies the position, in basepair units, of every element in the lac repressor genome. Position +1 signals the first basepair of gene lacZ.
In the absence of extracellular glucose, cAMP molecules are synthesized and they bind to free cAMP receptor proteins (CRP), forming the complex CAP. This complex binds to site C1, enhancing the binding affinity of the promoter P1 for mRNA polymerase (mRNAP) molecules. After binding to P1, some mRNAP start transcription of genes lacZ, lacY, and lacA. The product of gene lacZ is a monomer of the enzyme β-galactosidase, whereas the product of gene lacY is the protein lac permease. The protein of gene lacA does not play a role in the regulation of the lac operon, and it will not be considered further. In the presence of extracellular glucose, the production of cAMP is inhibited, and, therefore, the complex CAP cannot be formed.
If there is lactose in the extracellular medium and it is transported into the bacterium by permease proteins present in the cell membrane, some of the lactose is transformed into allolactose by β-galactosidase. Allolactose molecules in turn bind to lac repressor molecules, inactivating them and preventing their binding to the operator O1 and their further repression of the production of efficient mRNAs by mRNA polymerase molecules bound to P1. In short, there must be lactose inside the cell and no glucose in the extracellular medium to activate the lactose operon. The failure to fulfill either of these two requirements prevents the full activation of the operon.
There is a positive feedback loop in this regulatory pathway. The more permease molecules there are in the cell membrane, the higher the lactose uptake rate and the higher the intracellular lactose concentration. The higher the internal lactose concentration, the higher the intracellular allolactose concentration, the higher the operon activation level, and the faster the rate of β-galactosidase and lac permease production. This positive feedback loop may ultimately lead to system bistability.
Until the early 1980s, this was believed to be a complete picture of the lac operon functioning. However, thanks to a series of ingenious experiments, almost all of them performed by the group of Reznikoff (see Reznikoff, 1992, and references therein), our understanding of the situation has changed dramatically. We now know that the lac operon regulatory machinery is much more complex than described above.
In addition to O1, there are two other operators (denoted O2 and O3) in the lac operon (see Fig. 1). Active repressor molecules can also bind to O2 and O3, although with a smaller affinity than that of O1. The DNA can also fold in such a way that a single repressor molecule can bind to two different operators, as shown in Fig. 2. This has the effect of stabilizing the repressor-DNA complex.
FIGURE 2.

DNA folds in such a way that a single repressor molecule (which consists of four monomeric units) can simultaneously bind to two different operators as shown in the figure. (A) The repressor is bound to O1 and O2; (B) The repressor is bound to O1 and O3; and (C) the repressor is bound to O2 and O3.
There is also duplicity in the CAP binding sites. Two of them, denoted C1 and C2, are found in the lac operon; their position is shown in Fig. 1. The CAP complex can bind both of them, but its affinity for C2 is smaller than its affinity for C1.
Given their position, a repressor bound to O1 blocks the ability of C2 to be bound by one CAP complex, and vice versa. Although they do not intersect, it is known that a repressor bound to O3 bends the DNA chain in the same direction as a CAP complex bound to C1 does (Vossen et al., 1996). From this, we assume that once a repressor is bound to O3, C1 cannot be bound by a CAP, and once C1 is bound by a CAP, O3 cannot be bound by a repressor.
The lac operon also has more than one promoter. In Fig. 1 we show the main promoter (P1), together with a secondary promoter (P2). There are at least three more promoters in the lac operon. One of them is upstream from the lacZ gene starting point, and two more are downstream. Of all of them, only P2 has been characterized. In vitro studies (Peterson and Reznikoff, 1985) revealed that the affinity of promoter P2 for mRNAP is higher than that of promoter P1. In the absence of cAMP, mRNAP prefers to bind promoter P2. This situation changes when cAMP is added. In such case, most C1 sites are bound by CAP complexes preventing the binding of mRNAPs to P2 (as seen in Fig. 1, C1 and P2 overlap), and, thus, the fraction of P1s bound by an mRNA polymerase is much higher than the corresponding P2 fraction. This suggests that P2 plays an indirect role in the activation of P1 by cAMP. More recent experimental in vivo studies (Donnelly and Reznikoff, 1987) show that mutations that abolish the activity of promoter P2, without affecting the C1 binding site, fail to activate P1. Moreover, CAP mutants that repress P2 and P3 but do not activate P1 have also been isolated (Eschenlauer and Reznikoff, 1991). The conclusion from these experiments is that P2 (and thus P3) is unlikely to make a major contribution to P1 activation (Reznikoff, 1992). Reznikoff (1992) speculates that one possible explanation for this promoter clustering is the tendency of mRNA polymerase to concentrate near the active promoter P1.
MODEL DEVELOPMENT
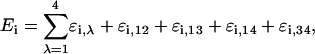
For the purposes of this model, we consider the lactose operon to consist of four different binding sites. Let us label them as sites 1, 2, 3, and 4. Site 1 comprises O3 and C1, and so its possible binding states are empty (e), bound by a repressor (r), or bound by a CAP complex (c). Site 2 consists only of P1, and so its possible binding states are empty (e) or bound by a mRNAP (p). Site 3 is made up of O1 and C2; its possible binding states are the same as those of site 1. Finally, site 4 comprises O2 only, and its binding states are e or c. If there is a repressor molecule simultaneously bound to sites 1 (O3) and 3 (O1), their binding states shall be denoted as r and 1, respectively. Similarly, if a repressor is simultaneously bound to sites 1 and 4, their states will, respectively, be denoted as r and 1. If the repressor is bound to sites 3 and 4 (O2), the states of these binding sites will, respectively, be denoted as r and 3. Notice that we ignore promoter P2 (and all of the other additional promoters). We have done so because, as discussed in the previous section (The lac Operon), these promoters seem to not play a role in the regulation of the lac operon in vivo.
With the introduction of this notation, all of the possible binding states of the lac operon can be represented by a four-character string. A simple counting reveals that there are 50 of these binding states. In this enumeration, it must be taken into account that if a repressor is bound to O1 (site 3) and O3 (site 1) there is no room for a mRNAP to bind P1 (site 2); see Oehler et al. (l994). The list of all of these 50 lac operon binding states is tabulated in Table 1.
TABLE 1.
The 50 possible binding states of the lac operon
| eeee | reee | ceee | ree1 |
| eeer | reer | ceer | rer1 |
| eere | rere | cere | rec1 |
| eerr | rerr | cerr | rpe1 |
| eece | rece | cece | rpr1 |
| eecr | recr | cecr | rpc1 |
| epee | rpee | cpee | eer3 |
| eper | rper | cper | epr3 |
| epre | rpre | cpre | rer3 |
| eprr | rprr | cprr | rpr3 |
| epce | rpce | cpce | cer3 |
| epcr | rpcr | cpcr | cpr3 |
| re1e | |||
| re1r |
Under the quasi-steady-state assumption that the lac repressor, mRNAP, and cAMP binding reactions are sufficiently rapid, relative to the transcription and translation rates, the probability of every one of the 50 lac operon binding states can be calculated as (Ackers et al., l982)
 |
(1) |
where the partition function is given by
 |
(2) |
In Eqs. 1 and 2, Pi and Ei represent the probability and energy of the ith binding state; αi, βi, and γi are, respectively, the number of mRNAP, CAP, and lac repressor molecules bound to the lac operon in that particular state; [mRNAP] is the concentration of mRNAP; [CAP] is the concentration of CAP; and [R] is the concentration of lac repressor molecules.
Of all the 50 binding states of the lac operon, only 14 of them, those in which a mRNAP is bound to site 2 while site 3 is either empty or bound by a CAP complex, are able to start transcription and produce efficient mRNA chains. These 14 states are: epee, eper, rpee, rper, cpee, cper, rpe1, epce, epcr, rpce, rpcr, cpce, cpcr, and rpc1. From these considerations, the transcription initiation rate of the lac operon genes can be modeled as
 |
(3) |
where [P1] is the concentration of promoter P1, and km is the rate of transcription initiation at such promoter.
The lac operon encodes three genes: lacZ, lacY, and lacA. The product of gene lacZ is a monomer of enzyme β-galactosidase (B); the product of gene lacY is protein lactose permease (P); and the product of lacA is thiogalactoside transacetylase, which is thought not to play a role in the regulation pathway of the lac operon (Beckwith, 1987) and will not be considered further.
The transcription of the lac operon produces a mRNA with three ribosome binding sites, one for each of the encoded genes. We are concerned with the concentration of ribosome binding sites corresponding to lacZ ([MB]) and lacY ([MP]). From the considerations in the previous paragraphs, the dynamics of these quantities can be modeled as
 |
(4) |
and
 |
(5) |
where the symbol ψτ denotes the variable ψ delayed in time by an amount τ. τB and τP are, respectively, the delays between the initiation of transcription and the appearance of the ribosome binding sites corresponding to lacZ and lacY; ξM is the mRNA degradation rate; and μ is the bacterial growth rate.
The dynamic equations for the β-galactosidase and lac permease concentrations are, respectively, given by
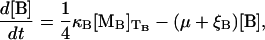 |
(6) |
and
 |
(7) |
with κB and κP the respective translation initiation rates at the lacZ and lacY ribosome binding sites, TB the time it takes to translate the lacZ mRNA, TP the time it takes to translate the lacY mRNA, and ξB and ξP the β-galactosidase and lac permease degradation rates, respectively. The factor  in Eq. 6 accounts for the fact that the active form of β-galactosidase is a tetramer.
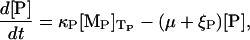
Lactose is cotransported into the cell with a hydrogen ion by lac permease. Transport of lactose by the permease is inhibited by external glucose, a phenomenon known as inducer exclusion. It has been reported that glucose affects the transport rate constant  , rather than the corresponding saturation constant
  . Following Wong et al. (l997), we assume that the lactose transport rate can be modeled as
 |
(8) |
where  is the lactose transport constant for inhibition by glucose, [LE] is the lactose concentration in the external medium, [LT] is the total intracellular lactose concentration (lactose plus allolactose, see below), and [GE] is the external glucose concentration. Since lactose transport is reversible, a term was included to account for lactose efflux dependent on the internal lactose concentration [LT]. It is known that the lactose efflux does not depend on the external glucose concentration (Wong et al., 1997).
Once inside the cell, a fraction of the lactose is transformed by β-galactosidase to allolactose and the remainder is hydrolyzed to glucose and galactose. Allolactose is an excellent substrate of β-galactosidase and is also hydrolyzed to glucose and galactose by this enzyme. According to Martínez-Bilbao et al. (l991), the total lactose hydrolysis rate can be modeled as
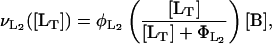 |
(9) |
where  is the rate constant for lactose hydrolysis, and
  is the corresponding saturation constant.
Following Dean (1989), we assume that the conversion of lactose into allolactose and the further hydrolysis of allolactose take place in a quasi-steady state. Based on the quasi-steady-state assumption and the fact that 50% of the incoming lactose is converted into allolactose (Dean, 1989), the total allolactose [AT] concentration is related to [LT] by
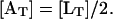 |
(10) |
From Eqs. 8–10, the equation governing the total allolactose concentration dynamics is
 |
(11) |
where ξA is the allolactose degradation rate.
The synthesis of carbohydrates other than glucose is inhibited when glucose is plentiful. This phenomenon is known as catabolite repression. The primary signal molecule for catabolite repression is cAMP. In the absence of extracellular glucose, the production rate and consequently the intracellular concentration of cAMP increase. The exact mechanism controlling cAMP synthesis has not been elucidated. However, according to Wong et al. (l997), the cAMP production rate can be modeled as
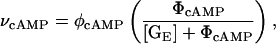 |
(12) |
where φcAMP is the cAMP synthesis rate constant, ΦcAMP is the inhibition constant for the effect of glucose on cAMP, and [GE] is the extracellular glucose concentration. From Eq. 12 and assuming that cAMP removal through degradation or transport out of the cell follows first-order kinetics, the equation governing the dynamics of the concentration of cAMP is
 |
(13) |
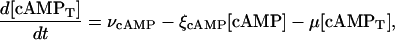
where ξcAMP is the cAMP removal rate, [cAMP] is the concentration of free cAMP, and [cAMPT] is the total (free plus bound) cAMP concentration.
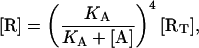
One or two cAMP molecules can bind to a cAMP receptor protein (CRP) to, respectively, form the complexes CAP and CAP2. Of these, only CAP has high affinity for specific DNA binding sites (Pyles and Lee, 1996). The reactions leading to complexes CAP and CAP2 can be written as
 |
(14) |
The equilibrium equations for the reactions in Eq. 14 are
 |
(15) |
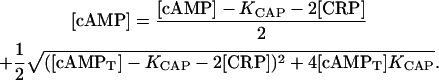
where [cAMP] denotes the concentration of free cAMP and KCAP = k−/k+ is the reaction dissociation constant.
Given that the production of CRP is regulated by an operon in the bacterium different from the lac operon, we assume a constant concentration [CRP]. cAMP participates in the regulation of many genes. For the purpose of this study, we assume that the concentration of cAMP bound to molecules involved in the regulation on genes other than the lac operon ones is constant. Thus, it can be stated that the total cAMP concentration is given by
 |
(16) |
Eqs. 15 and 16 constitute a complete set of algebraic equations for variables [cAMP], [CAP], and [CAP2]. By solving it, considering that [CAP] and [cAMP] must be zero when [cAMPT] = 0, we obtain the following formulas to calculate [CAP] and [cAMP] in terms of KCAP, [CRP], and [cAMPT]:
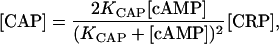 |
(17) |
and
 |
(18) |
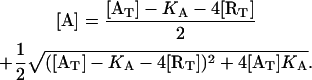
The lac repressor is a tetramer made up of the product of gene lacI. It has a high affinity for its specific DNA binding sites (operators). If there is allolactose present in the cell, it binds the repressor tetramer, decreasing its affinity for the operator sites. Up to four allolactose molecules can bind one repressor molecule according to the following sequential reactions:
 |
(19) |
where KA is the equilibrium dissociation constant of the allolactose-repressor binding reaction.
The equilibrium conditions for the chemical reactions of Eq. 19 are
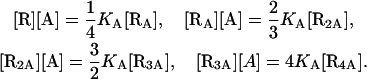 |
(20) |
The total concentrations of allolactose and lac repressor are, respectively, given by
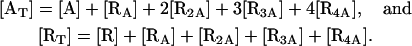 |
(21) |
By solving Eqs. 20 and 21 for [A] and [R], and taking into consideration that when [AT] = 0, [A] must be zero and [R] must be equal to [RT], we obtain the following expressions, which permit us calculate [A] and [R] in terms of [RT], [AT], and KA:
 |
(22) |
and
 |
(23) |
NUMERICAL RESULTS
Equations 4–7 and 13 constitute a complete set of delay-differential equations, which govern the dynamics of variables [MB], [MP], [B], [P], [AT], and [cAMPT]. All of the parameters in these equations are estimated from published experimental data in the Appendix. To numerically solve these equations, a fourth-order Runge-Kutta algorithm, adapted to deal with time delays, was implemented in Fortran.
To test the feasibility of the model presented here, an experiment by Knorre (1968) is simulated. In this experiment, Knorre let a bacterial culture grow, for a long time, in a glucose-rich and lactose-free medium, so the lactose operon is uninduced. Then, the bacteria were washed and transferred to a lactose-rich and glucose-free medium so induction of the lactose operon would take place. The temporal evolution of the operon induction, after the medium change, was determined by periodically measuring the β-galactosidase activity.
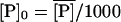
The Knorre (1968) experiment was simulated as follows. First, we set the external lactose and glucose concentration values as [LE] = 1.0 mM and [GE] = 0.0 mM. This situation corresponds to the lactose-rich and glucose-free medium and is enough to fully induce the lactose operon. With these conditions, the model equations were integrated over a long enough time interval such that the system reached the induced steady state. Let  ,
,  ,
,  and
and  denote the fully induced steady-state values of the corresponding variables. Since, in the uninduced state, the lactose operon activity is one thousandth that of the induced state (Savageau, 1999), we select the following initial conditions to account for the bacterial culture growing in the glucose-rich and lactose-free medium:
 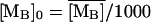 ,
,  ,
, 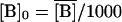 ,
,  . To complete the initial condition set we considered [AT]0 = 0 and [cAMPT]0 = 0, given that the absence of external lactose avoids the accumulation of internal allolactose, whereas the external glucose inhibits the synthesis of cAMP. Finally, with these initial conditions and external lactose and glucose concentration values of [LE] = 1.0 mM and [GE] = 0.0 mM (corresponding to the lactose-rich and glucose-free environment), the model time-delay-differential equations were numerically solved for 200 min. The result of our simulation is compared against the experimental data of Knorre (1968) in Fig. 3, where it can be seen that there is good agreement between the model predictions and the experimental data. Note in particular that we have not adjusted parameters to fit the data, but rather have been able to use the model in conjunction with our parameter estimation to predict the time course shown in Fig. 3.
FIGURE 3.

Time evolution of the β-galactosidase activity after an E. coli bacterial culture is changed from a glucose to a lactose growth situation. Comparison of the Knorre (1968) experimental data (diamonds) with the numeric simulation described in the text (solid line).
Now, we turn to a numerical investigation of the system bistable behavior. We start with a simulation of an experiment in which a bacterial culture grows in a medium with a constant concentration of glucose, and the lactose concentration is slowly increased (starting from zero), letting the bacterial culture lactose operon relax to equilibrium after every incremental step, until the lactose operon is fully induced. Afterward, the medium lactose concentration is decreased back to zero in the same quasi-static way. To simulate this experiment, we started by setting the external lactose concentration ([LE]) and all the model variable initial conditions to 0.0 μM. Then, we numerically solved the model equations until a steady state was reached. After this, [LE] was incremented in steps of 0.25 μM and the model equations were solved again, with the previous steady-state values as initial conditions, until the system reaches a new steady state. This procedure was repeated until [LE] = 100.0 μM. Afterward, [LE] was decreased in steps of 0.25 μM, and the whole process was repeated until [LE] = 0.0 μM. In every step, we recorded the values of [LE] and the corresponding β-galactosidase steady-state concentration. The experiment was repeated for different values of the external glucose concentration [GE].
The results of our simulations are presented in Fig. 4. It is clear that, in agreement with the results of Yildirim and Mackey (2003), the expanded model of the lactose operon of E. coli presented here also shows bistable behavior for realistic values of external glucose and lactose concentrations. The two main characteristics of bistability are shown in these plots. First, the steady-state β-galactosidase concentration has a discontinuous transition, from the uninduced to the induced steady state, when the external lactose concentration surpasses a threshold value; and second, in order for the system to switch back to the uninduced state, the external lactose concentration must be decreased below a second (smaller) threshold level.
FIGURE 4.

Plots of steady-state β-galactosidase concentration versus external lactose concentration for various values of external glucose concentration ([GE]): (A) [GE] = 0.0 μM; (B) [GE] = 140.0 μM; and (C) [GE] = 280.0 μM. The black and gray lines correspond to the increasing and decreasing external lactose concentration pathways, respectively.
Yildirim and Mackey (2003), with a model that considered neither catabolite repression nor inducer exclusion, found that the transition from the uninduced to the induced state took place around LE ≈ 60 μM. As seen in Fig. 4, there is a qualitative agreement between our results, which account for both glucose-dependent mechanisms, and those of Yildirim and Mackey. It is known that the presence of glucose in the external medium affects the induction of the lactose operon, making it more difficult. There are two different ways in which the external glucose could influence the system induction: by increasing the induction threshold and by decreasing the activation level of the already induced operon. From Fig. 4 we can observe that both phenomena occur.
Extracellular glucose affects the lactose operon activation by inhibiting the production of cAMP (catabolite repression) and by reducing the efficiency of lactose permease to transport lactose molecules into the cell (inducer exclusion). Both mechanisms are taken into account in this model, and, thus, the results in Fig. 4 reflect both effects. To figure out what the separate effects of catabolite repression and inducer exclusion are, we repeated the same numerical experiments with two hypothetical mutant strains of E. coli. In one of them (let us call it nlac), catabolite repression works as in the wild strain, but inducer exclusion is absent, and thus the efficiency of glucose transport by lactose permease is independent of the extracellular glucose concentration. In the second hypothetical mutant strain (ncat), inducer exclusion is normal, but catabolite repression has been shut down so the cAMP synthesis rate is independent of the extracellular glucose concentration.
In Fig. 5, the results of the numerical experiments with strain nlac are shown. There, we see that catabolite repression is capable, on its own, of increasing the external lactose concentration induction threshold, although not as efficiently as when it is combined with inducer exclusion. Two other interesting features of the plots in Fig. 5 are that the external lactose concentration uninduction threshold is almost independent of the extracellular glucose concentration, and that the effect of glucose on the activation level (the steady-state β-galactosidase concentration) of the induced operon is not as pronounced as we observed in Fig. 4.
FIGURE 5.

Plots of steady-state β-galactosidase concentration versus external lactose concentration for various values of external glucose concentration ([GE]): (A) [GE] = 0.0 μM; (B) [GE] = 140.0 μM; and (C) [GE] = 280.0 μM. The black and gray lines correspond to the increasing and decreasing external lactose concentration pathways, respectively. The experiments were carried out with the hypothetical mutant strain nlac, in which inducer exclusion is absent so the efficiency of glucose transport by lactose permease is independent of extracellular glucose.
The results of the numerical simulations with strain ncat are plotted in Fig. 6. In this case, we see that inducer exclusion affects the lac operon inductions by increasing the extracellular lactose concentration induction threshold and decreasing the activation level of the induced operons. The uninduction threshold is also affected, although not as strongly as are the two other features.
FIGURE 6.

Plots of steady-state β-galactosidase concentration versus external lactose concentration for various values of external glucose concentration ([GE]): (A) [GE] = 0.0 μM; (B) [GE] = 140.0 μM; and (C) [GE] = 280.0 μM. The black and gray lines correspond to the increasing and decreasing external lactose concentration pathways, respectively. The experiments were carried out with the hypothetical mutant strain ncat, in which the cAMP synthesis rate is independent of the extracellular glucose concentration.
After comparing the results in Figs. 4–6, we observe that neither the effects of catabolite repression nor inducer exclusion are dominant in the range of external glucose concentration we explored. Neither is capable of accounting for the intensity of the global effect. On the other hand, the saturation constant of catabolite repression is 40.0 μM, whereas that of inducer exclusion is 271.0 μM. This means that catabolite repression is more sensitive at external glucose concentrations ∼50 μM, whereas the sensitivity of inducer exclusion is optimized at ∼300 μM of external glucose. This can be seen by comparing Figs. 5 and 6. The effects of catabolite repression are not very different between external glucose concentrations of 140 μM and 280 μM, whereas the effects of inducer exclusion are significantly enhanced in this range. Thus, catabolite repression and inducer exclusion seem to be complementary mechanisms. The above assertion follows from the facts that the bacterial response to the external glucose is, somehow, the sum of the catabolite repression and the inducer exclusion individual responses, and that the glucose sensitivities of both mechanisms are such that they enhance the bacterial glucose sensitivity range.
CONCLUDING REMARKS
The mathematical and computational modeling of biological systems is a subject of increasingly intense interest. The accelerating growth of biological knowledge, in concert with a growing appreciation of the spatial and temporal complexity of such systems, threatens to overwhelm our capacity to integrate, understand, and reason about biology and biological function. The construction, analysis, and simulation of formal mathematical models is a useful way to manage such problems. Genetic regulation is an area in which this approach is particularly promising. The galactose, tryptophan, and lactose operons in E. coli, as well as the lysis/lysogeny switch of phage lambda, are examples of molecular systems in which the extant amount of experimental data concerning their functioning permit one to construct detailed mathematical models, capable of making precise dynamic predictions.
Experimental evidence of bistability in the lac operon was first found by Novick and Wiener (1957). Previous mathematical models of the lactose operon have demonstrated the possibility of bistable behavior with a proper choice of the model parameters (Laurent and Kellershohn, 1999), and that this behavior is indeed predicted by the models with realistic parameter values (Yildirim and Mackey, 2003). However, none of these models has taken into account two glucose-dependent mechanisms that play an important role in the regulation of the lactose operon regulatory pathway: catabolite repression and inducer exclusion.
In this paper, we developed a mathematical model of the lactose operon which considers both catabolite repression and inducer exclusion, as well as all other known regulatory mechanisms and the time delays inherent to transcription and translation. We have paid special attention to the estimation of all of the model parameters from published experimental data. The accuracy of the model was tested by simulating an experiment of Knorre (1968). In this experiment, a bacterial culture feeding on glucose, and thus having the lactose operon uninduced, was suddenly switched to a lactose-rich medium. Then, the β-galactosidase activity was periodically measured for >3 h, until the lactose operon was fully activated. The results of our simulation (the details are given in Numerical Results) are compared with the experimental data of Knorre in Fig. 3. From that comparison, we see that there is good agreement between the simulation predictions and the experimental data. Thus, we conclude that the model is reliable enough to numerically analyze the system bistable behavior and explore the individual effects of catabolite repression and inducer exclusion.
It is known that the presence of glucose in the extracellular medium makes induction of the lactose operon more difficult in a given E. coli culture. This could happen in two different ways: by increasing the threshold value the external lactose concentration must surpass to make the system switch from the uninduced to the induced state, and by decreasing the activation level of the already induced operon. Our results indicate that both phenomena take place. When the individual responses of catabolite repression and inducer exclusion are separately studied, both mechanisms are complementary in the sense that their individual responses add up to account for the system global response to external glucose, and their combined effect enlarges the system external glucose sensitivity range. In conclusion, our modeling approach helps us to understand the dynamic response, via the mechanisms of catabolite repression and induced exclusion, of the lactose operon to extracellular glucose, and provides quantitative predictions as well. These predictions may, in principle, be tested experimentally.
Acknowledgments
This work was supported by Comisión de operación y fomento de actividades académicas del Instituto Politécnico Nacional (México), Programa de Estímulos al Desempeño de los Investigadores del Instituto Politécnico Nacional (México), CONACyT (México), Mathematics of Information Technology and Complex Systems (Canada), the Natural Sciences and Engineering Research Council (NSERC grant OGP-0036920, Canada), and Le Fonds pour la Formation de Chercheurs et l'Aide à la Recherche (FCAR grant 98ER1057, Québec).
APPENDIX: PARAMETER ESTIMATION
Energy of the lac operon 50 possible binding states
The binding energy of any one of the 50 binding states of the lac operon can be calculated from
 |
(24) |
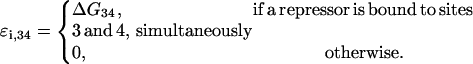
where ɛi,λ is the binding energy of site λ in the ith state, and ɛi,12, ɛi,13, ɛi,14, and ɛi,34 are cooperativity energies, due to the interaction between a CAP complex and a mRNAP simultaneously bound to C1 and P1 and to a repressor simultaneously binding two different operators. If sites ν and κ (ν < κ) are bound by the same repressor molecule, only the individual binding energy ɛi,ν is considered in the sum of Eq. 24. The additional energy due to the repressor also binding site κ is accounted for as the cooperativity energy ɛi,λκ.
For a given i, the value of ɛi,λ is defined as
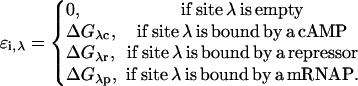 |
(25) |
The energies ΔGλc, ΔGλr, and ΔGλp are estimated below. The cooperativity energies can be calculated as
 |
(26) |
 |
(27) |
 |
(28) |
and
 |
(29) |
Energies ΔG13, ΔG14, and ΔG34 are estimated below, as well.
Cooperativity and individual binding energies
In this section, the following relation between the binding energy (ΔG) and the association constant (KB) of a given chemical reaction is used:
 |
Here, we take T = 37°C, which corresponds to
 |
ΔG2p and ΔGcp
Malan et al. (1984) measured the association constant of mRNA polymerase binding to P1 in the absence and in the presence of cAMP. They report the following values, respectively:  and
and  From this, ΔG2p and ΔGcp can be calculated as
 |
and
 |
ΔG1c
Pyles and Lee (1996) report the following value for the CAP-C1 binding association constant: 4.1 × 10⁷ M−1. Baker et al. (2001) found 2.5 × 10⁷ M−1. Here, we take the mean value (3.3 × 10⁷ M−1), from which
 |
ΔG3c
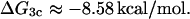
According to Hudson and Fried (1991), the affinity of CAP for site C2 is ∼1/30 that for site C1, i. e., the corresponding association constant is of the order of 1.1 × 10⁶ M−1. The binding energy calculated from this association constant is
 |
ΔG3r
Falcon and Matthews (2000) report for the association constant of the repressor-O1 binding reaction a value of 1.0 × 10¹¹ M−1. This association constant corresponds to the following binding energy:
 |
ΔG1r and ΔG4r
According to Oehler et al. (l994), the affinities of O2 and O3 for the repressor are 1/10 and 1/300 that of O1, respectively. This means that the corresponding association constants are 1.0 × 10¹⁰ M−1 and 3.33 × 10⁸ M−1. Therefore, the binding energies are
 |
and
 |
ΔG34
From Oehler et al. (1994), when a repressor molecule is simultaneously bound to O1 (site 3) and O2 (site 4), the affinity of the complex is 5 times that of the repressor-O1 complex. From this
 |
ΔG13
Oehler et al. (1994) also report that when a repressor is bound to O1 (site 3) and O3 (site 1), the affinity is 100 times that of the repressor-O1 complex. This further implies that
 |
ΔG14
Finally, Oehler et al. (l994) assert that when a repressor is simultaneously bound to O2 (site 4) and O3 (site 1), the affinity is 2000 times that of the repressor-O2 complex. This means that
 |
The energies of the 50 binding states calculated from the above estimated values and Eqs. 24–29 are tabulated in Table 2.
TABLE 2.
Energies of the 50 lac operon possible binding states
| Eeeee ≈ 0.0 | Ereee ≈ −12.11 | Eceee ≈ −10.68 | Eree1 ≈ −18.90 |
| Eeeer ≈ −14.21 | Ereer ≈ −26.32 | Eceer ≈ −24.89 | Erer1 ≈ −35.87 |
| Eeere ≈ −16.97 | Erere ≈ −29.08 | Ecere ≈ −27.65 | Erec1 ≈ −27.48 |
| Eeerr ≈ −31.18 | Ererr ≈ −43.29 | Ecerr ≈ −41.86 | Erpe1 ≈ −29.10 |
| Eeece ≈ −8.58 | Erece ≈ −20.69 | Ecece ≈ −19.26 | Erpr1 ≈ −46.07 |
| Eeecr ≈ −22.79 | Erecr ≈ −34.90 | Ececr ≈ −33.47 | Erpc1 ≈ −37.68 |
| Eepee ≈ −10.20 | Erpee ≈ −22.31 | Ecpee ≈ −22.47 | Eeer3 ≈ −17.97 |
| Eeper ≈ −24.41 | Erper ≈ −36.52 | Ecper ≈ −36.68 | Eepr3 ≈ −28.17 |
| Eepre ≈ −27.17 | Erpre ≈ −39.28 | Ecpre ≈ −39.44 | Erer3 ≈ −30.08 |
| Eeprr ≈ −41.38 | Erprr ≈ −53.49 | Ecprr ≈ −53.65 | Erpr3 ≈ −40.28 |
| Eepce ≈ −18.78 | Erpce ≈ −30.89 | Ecpce ≈ −31.05 | Ecer3 ≈ −28.65 |
| Eepcr ≈ −32.99 | Erpcr ≈ −45.10 | Ecpcr ≈ −45.26 | Ecpr3 ≈ −40.44 |
| Ere1e ≈ −19.81 | |||
| Ere1r ≈ −34.02 |
All of these energies are expressed in units of kcal/mol.
Transcription and translation parameters
E. coli volume
E. coli are rod-like bacteria 3–5 μm long and 0.5 μm in diameter, so they have a volume in the range from 6.0 × 10⁻¹⁶ L to 9.8 × 10⁻¹⁶ L. We take a mean volume of 8.0 × 10⁻¹⁶ L.
Growth rate, μ
The growth rate of a bacterial culture depends strongly on the growth medium conditions. Typically, the mass doubling time varies from 20 to >40 min (Bremer and Dennis, 1996). For the purpose of this study, we consider a doubling time of 30 min, which corresponds to the following growth rate:
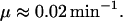 |
mRNA polymerase concentration, [mRNAP]
According to Bremer and Dennis (1996), there are ∼1500 active RNA polymerase molecules per cell in E. coli bacterial cultures growing at the rate μ estimated above. This leads to a concentration
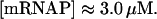 |
Promoter concentration, [P1]
According to Bremer and Dennis (1996), there are ∼2.5 genome equivalents per average E. coli cell at the growth rate determined by μ. Assuming one promoter P1 per genome equivalent, the right promoter concentration can be estimated as
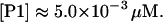 |
CRP concentration, [CRP]
According to Anderson et al. (1971), there are ∼1300 molecules of cAMP receptor protein concentration per E. coli cell. This corresponds to
 |
Total repressor concentration, [RT]
From Yagil and Yagil (1971), the product of the total repressor concentration and the repressor-operator reaction association constant has an average value of 2.9 × 10³. On the other hand, Falcon and Matthews (2000) report for the association constant of the repressor-O1 binding reaction a value of 1.0 × 10¹¹ M−1. Therefore, we can estimate the total repressor concentration as
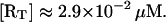 |
This value agrees with the experimental results of Gilbert and Müller-Hill (1966), who estimated that ∼10–20 copies of the lac repressor are present per cell. This corresponds to a concentration between 2.0 × 10⁻² μM and 4.0 × 10⁻² μM.
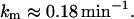
Transcription initiation rate, km
Malan et al. (1984) measured the transcription initiation rate at P1 and report the following value:
 |
mRNA degradation rate, ξM
Kennell and Riezman (1977), measured a lacZ mRNA half-life of 1.5 min. From this
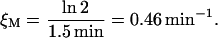 |
lacZ mRNA translation initiation rate, κB
From Kennell and Riezman (1977), translation starts every 3.2 s at the lacZ mRNA. This leads to the following translation initiation rate:
 |
lacY mRNA translation initiation rate, κP
According to Beckwith (1987), the production rate of lac permease is smaller than that of β-galactosidase monomers even though, as Kennell and Riezman (1977) report, there are similar levels of both mRNA species. This suggests that lacY mRNAs are translated at a lower rate. Nevertheless, to our knowledge, there are no reported measurements of the lacY mRNA translation initiation rate. Thus, we assume it is equal to that of lacZ:
 |
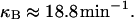
β-galactosidase degradation rate, ξB
The breakdown rate of β-galactosidase was measured by Mandelstam (1957), who found it to be 0.05 per hour. This corresponds to
 |
lac permease degradation rate, ξP
According to Kennell and Riezman (1977), the degradation rate of this protein is
 |
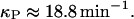
Equilibrium dissociation constant between CRP and cAMP, KCAP
From the experimental results of Baker et al. (2001)
 |
Time delay between transcription initiation and appearance of a lacZ ribosome binding site, τB
Once a RNA polymerase has transcribed a mRNA chain long enough for a lacZ ribosome to bind to it, translation can start. According to Draper (1996), efficient mRNAs can initiate translation every 3 s. From this and the fact that the mRNA chain elongation rate is of the order of 50 nucleotide/s (Bremer and Dennis, 1996), <150 nucleotides are required for a ribosome to bind a mRNA and start translation. Furthermore, the DNA chain elongation rate is at least 490 nucleotide/s (Bremer and Dennis, 1996). Thus it takes <0.31 s after transcription initiation to have a lacZ ribosome binding site, i.e.,
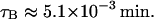 |
Time delay between transcription initiation and appearance of a lacY ribosome binding site, τP
Since gene lacZ precedes gene lacY, the former one has to be completely transcribed before we have a lacY ribosome binding site. Since gene lacZ is 2994 basepairs long and the DNA chain elongation rate is at least 490 nucleotide/s (Bremer and Dennis, 1996), we can estimate
 |
Time delay due to translation of genes lacZ (TB) and lacY (TP)
The monomers of β-galactosidase (the product of gene lacZ) and lac permease (the product of gene lacY) are, respectively, 998 and 417 amino acids long. This means that gene lacZ is 2994 basepairs long, whereas lacY is 1251 basepairs long. From this and taking into account that, according to Bremer and Dennis (1996), the mRNA chain elongation rate is ∼50 nucleotide/s, the times it takes for genes lacZ and lacY to be translated are
 |
and
 |
Lactose and allolactose dynamics parameters
Lactose transport rate and saturation constants,  and
and 
From Lolkema et al. (1991), these constants can be estimated as
 |
and
 |
Lactose hydrolysis rate and saturation constants,  and
and 
We estimate these parameters from the data reported in Martínez-Bilbao et al. (1991) as
 |
and
 |
Lactose transport constant for inhibition by glucose, 
This parameter can be estimated from the data reported by Winkler and Wilson (1967):
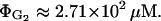 |
Allolactose degradation rate constant, ξA
Following Wong et al. (1997) we consider this parameter to be negligible:
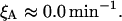 |
Catabolite repression and operon induction parameters
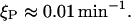
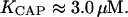
cAMP synthesis rate constant, φcAMP
This parameter was estimated from the data reported by Epstein et al. (1975):
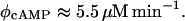 |
cAMP synthesis saturation constant, ΦcAMP
From Notley and Ferenci (1995), the saturation constant for cAMP synthesis can be estimated as
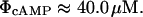 |
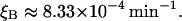
cAMP excretion and degradation rate, ξcAMP
The compound excretion and degradation rate for cAMP was measured by Epstein et al. (1975):
 |
Repressor-allolactose dissociation constant, KA
From the data in Jobe and Bourgeois (1972) and von Hippel et al. (1974), KA was estimated as
 |
References
- Ackers, G. K., A. D. Johnson, and M. A. Sea. 1982. Quantitative model for gene regulation by λ phage repressor. Proc. Natl. Acad. Sci. USA. 79:1129–1133. [DOI] [PMC free article] [PubMed] [Google Scholar]
- Anderson, W. B., A. B. Schneider, M. Emmer, R. L. Perlman, and I. Pastan. 1971. Purification of and properties of the cyclic adenosine 3′,5′-monophosphate receptor protein which mediates 3′,5′-monophosphate dependent gene transcription in Escherichia coli. J. Biol. Chem. 246:5929–5937. [Google Scholar]
- Baker, C. H., S. R. Tomlinson, A. E. García, and J. G. Harman. 2001. Amino acid substitution at position 99 affects the rate of CRP subunit exchange. Biochemistry. 40:12329–12338. [DOI] [PubMed] [Google Scholar]
- Beckwith, J. 1987. The lactose operon. In Escherichia coli and Salmonella thyphymurium: Cellular and Molecular Biology, Vol. 2. F. C. Neidhart, J. L. Ingraham, K. B. Low, B. Magasanik, and H. E. Umbarger, editors. American Society for Microbiology, Washington, DC. 1439–1443.
- Bremer, H., and P. P. Dennis. 1996. Modulation of chemical composition and other parameters of the cell by growth rate. In Escherichia coli and Salmonella thyphymurium: Cellular and Molecular Biology, Vol. 2. F. C. Neidhart, R. Curtis, J. L. Ingraham, E. C. C. Lin, K. B. Low, B. Magasanik, W. S. Reznikoff, M. Riley, M. Schaechter, and H. E. Umbarger, editors. American Society for Microbiology, Washington, DC. 1553–1569.
- Casadesús, J., and R. D'Ari. 2002. Memory in bacteria and phage. Bioessays. 24:512–518. [DOI] [PubMed] [Google Scholar]
- Dean, A. M. 1989. Selection and neutrality in lactose operons of Escherichia coli lactose promoter. Genetics. 123:441–454. [DOI] [PMC free article] [PubMed] [Google Scholar]
- Donnelly, C. E., and W. S. Reznikoff. 1987. Mutations in the lac P2 promoter. J. Bacteriol. 169:1812–1817. [DOI] [PMC free article] [PubMed] [Google Scholar]
- Draper, D. E. 1996. Translational initiation. In Escherichia coli and Salmonella thyphymurium: Cellular and Molecular Biology, Vol. 1. F. C. Neidhart, R. Curtis, J. L. Ingraham, E. C. C. Lin, K. B. Low, B. Magasanik, W. S. Reznikoff, M. Riley, M. Schaechter, and H. E. Umbarger, editors. American Society for Microbiology, Washington, DC. 902–908.
- Epstein, W., L. B. Rothman-Denes, and J. Hesse. 1975. Adenosine 3′:5′-cyclic monophosphate as mediator of catabolite repression in Escherichia coli. Proc. Natl. Acad. Sci. USA. 72:2300–2304. [DOI] [PMC free article] [PubMed] [Google Scholar]
- Eschenlauer, A. C., and W. S. Reznikoff. 1991. Escherichia coli catabolite gene activator protein mutants defective in positive control of lac operon transcription. J. Bacteriol. 173:5024–5029. [DOI] [PMC free article] [PubMed] [Google Scholar]
- Falcon, C. M., and K. S. Matthews. 2000. Operator DNA sequence variation enhances high affinity binding by hinge helix mutants of lactose repressor protein. Biochemistry. 39:11074–11083. [DOI] [PubMed] [Google Scholar]
- Ferrell, J. E. 2002. Self-perpetuating states in signal transduction: positive feedback, double-negative feedback, and bistability. Curr. Opin. Chem. Biol. 6:140–148. [DOI] [PubMed] [Google Scholar]
- Gilbert, W., and B. Müller-Hill. 1966. Isolation of the lac repressor. Proc. Natl. Acad. Sci. USA. 56:1891–1898. [DOI] [PMC free article] [PubMed] [Google Scholar]
- Hudson, J. M., and M. G. Fried. 1991. The binding of cyclic AMP receptor protein to two lactose promoter sites is not cooperative in vitro. J. Bacteriol. 173:59–66. [DOI] [PMC free article] [PubMed] [Google Scholar]
- Jobe, A., and S. Bourgeois. 1972. lac repressor-operator interaction. VI. The natural inducer of the lac operon. J. Mol. Biol. 69:397–408. [DOI] [PubMed] [Google Scholar]
- Kennell, D., and H. Riezman. 1977. Transcription and translation initiation frequencies of the Escherichia coli lac operon. J. Mol. Biol. 114:1–21. [DOI] [PubMed] [Google Scholar]
- Knorre, W. A. 1968. Oscillation of the rate of synthesis of β-galactosidase in Escherichia coli ML 30 and ML 308. Biochem. Biophys. Res. Commun. 30:1248–1290. [DOI] [PubMed] [Google Scholar]
- Laurent, M., and N. Kellershohn. 1999. Multistability: a major means of differentiation and evolution in biological systems. Trends Biochem. Sci. 24:418–422. [DOI] [PubMed] [Google Scholar]
- Lolkema, J., N. Carrasco, and H. Kaback. 1991. Kinetic analysis of lactose exchange in proteoliposomes reconstituted with purified lac permease. Biochemistry. 30:1284–1290. [DOI] [PubMed] [Google Scholar]
- Malan, T. P., A. Kolb, H. Buc, and W. R. McClure. 1984. Mechanism of CRP-cAMP activation of lac operon transcription initiation activation of the P1 promoter. J. Mol. Biol. 180:881–909. [DOI] [PubMed] [Google Scholar]
- Mandelstam, J. 1957. Turnover of protein in starved bacteria and its relationship to the induced synthesis of enzyme. Nature. 179:1179–1181. [DOI] [PubMed] [Google Scholar]
- Martínez-Bilbao, M., R. E. Holdsworth, R. A. Edwards, and R. E. Huber. 1991. A highly reactive β-galactosidase (Escherichia coli) resulting from a substitution of an aspartic acid for Gly-794. J. Biol. Chem. 266:4979–4986. [PubMed] [Google Scholar]
- Notley, L., and T. Ferenci. 1995. Differential expression of mal genes under cAMP and endogenous inducer control in nutrient-stressed Escherichia coli. Mol. Microbiol. 16:121–129. [DOI] [PubMed] [Google Scholar]
- Novick, A., and M. Wiener. 1957. Enzyme induction as an all-or-none phenomenon. Proc. Natl. Acad. Sci. USA. 43:553–566. [DOI] [PMC free article] [PubMed] [Google Scholar]
- Oehler, S., M. Amouyal, P. Kolkhof, B. von Wilcken-Bergmann, and B. Müller-Hill. 1994. Quality and position of the three lac operators of E. coli define efficiency of repression. EMBO J. 13:3348–3355. [DOI] [PMC free article] [PubMed] [Google Scholar]
- Peterson, M. L., and W. S. Reznikoff. 1985. Properties of lac P2 in vivo and in vitro. An overlapping RNA polymerase binding site within the lactose promoter. J. Mol. Biol. 185:535–543. [DOI] [PubMed] [Google Scholar]
- Pyles, E. A., and J. C. Lee. 1996. Mode of selectivity in cyclic AMP receptor protein-dependent promoters in Escherichia coli. Biochemistry. 35:1162–1172. [DOI] [PubMed] [Google Scholar]
- Reznikoff, W. S. 1992. The lactose operon-controlling elements: a complex paradigm. Mol. Microbiol. 6:2419–2422. [DOI] [PubMed] [Google Scholar]
- Savageau, M. A. 1999. Design of gene circuitry by natural selection: analysis of the lactose catabolic system in Escherichia coli. Biochem. Soc. Trans. 27:264–270. [DOI] [PubMed] [Google Scholar]
- von Hippel, P. H., A. Revzin, C. A. Gross, and A. C. Wang. 1974. Non-specific DNA binding of genome regulating proteins as a biological control mechanism: I. The lac operon: equilibrium aspects. Proc. Natl. Acad. Sci. USA. 71:4808–4812. [DOI] [PMC free article] [PubMed] [Google Scholar]
- Vossen, K. M., D. F. Stickle, and M. G. Fried. 1996. The mechanisms of CAP-lac repressor binding cooperativity at the E. coli lactose promoter. J. Mol. Biol. 255:44–54. [DOI] [PubMed] [Google Scholar]
- Winkler, H., and T. Wilson. 1967. Inhibition of β-galactosidase transport by substrates of the glucose transport system in Escherichia coli. Biochim. Biophys. Acta. 135:1030–1051. [DOI] [PubMed] [Google Scholar]
- Wong, P., S. Gladney, and J. D. Keasling. 1997. Mathematical model of the lac operon: inducer exclusion, catabolite repression, and diauxic growth on glucose and lactose. Biotechnol. Prog. 13:132–143. [DOI] [PubMed] [Google Scholar]
- Yagil, G., and E. Yagil. 1971. On the relation between effector concentration and the rate of induced enzyme synthesis. Biophys. J. 11:11–27. [DOI] [PMC free article] [PubMed] [Google Scholar]
- Yildirim, N., and M. C. Mackey. 2003. Feedback regulation in the lactose operon: a mathematical modeling study and comparison with experimental data. Biophys. J. 84:2841–2851. [DOI] [PMC free article] [PubMed] [Google Scholar]