Abstract
The low-frequency torsional modes, index of refraction, and absorption of a tryptophan film and pressed powders from 0.2 to 2.0 THz (6.6–66 cm−1) were measured by terahertz time-domain spectroscopy at room temperature. It was found that there were two dominated torsional vibrational modes at around 1.435 and 1.842 THz. The associated relaxation lifetimes (∼1 ps) for these modes of the tryptophan molecule were measured. Using a density-functional calculation, the origins of the observed torsional vibrations were assigned to the chain and ring of the tryptophan molecule.
INTRODUCTION
There is an increasing interest in understanding the molecular dynamics associated with the vibrational, rotational, and torsional modes of biomolecules during photodynamical and structural changes. The dynamics of molecular components of proteins involves low-frequency collective modes of particular subunits. Molecules excited up the vibrational ladder can cross transitional energy barriers (Austin et al., 1991; Woolard et al., 2002). The dynamics of the collective modes generally occur via anharmonic interactions with other normal molecular modes, leading to energy exchange. It is believed that the low-frequency collective modes are responsible for the directed flow of conformational energy for a variety of biological processes, ranging from primary photoisomerization events of vision to enzyme action (Beratan et al., 1992; Austin et al., 1989; Moritugu et al., 2000; Xie et al., 2002). The motions of molecular subunits within proteins are associated with different functions. Photoinduced isomerization in the primary stages and absorption changes during structural changes in different stages of the photocycles of some proteins are associated with collective motion. These processes involve well-defined torsional modes along one of the C=C bonds of the polyene chain. Knowledge of the relaxation lifetimes of these modes is important to improve these processes as well as to obtain a better understanding of the theory. Tryptophan, an essential amino acid found in proteins and present in foods, affects our daily life. Tryptophan is one of the key biological photoactive fingerprint molecules used in cancer and bacteria detection using fluorescence spectroscopy.
Far-infrared (FIR) studies of materials have been limited due to the weak sources and low signal/noise ratios, especially below 100 cm−1. Recently, pulsed terahertz time-domain spectroscopy (THz-TDS) has been used to overcome these difficulties and have become a versatile tool for spectroscopy on a wide variety of samples in the FIR (Kindt and Schmuttenmaer, 1996; Taday et al., 2003). Most recently, the THz technique has been applied to examine DNA and some other biomolecules (Markelz et al., 2000; Brucherseifer et al., 2000; Walther et al., 2000, 2002). THz-TDS relies on coherent generation and detection of an ultrashort pulse with a large signal/noise ratio of ∼8000–10,000 over a large bandwidth.
In this study, the THz absorption, index of refraction, and dispersion of a tryptophan film and pressed powders were measured and analyzed to determine the main torsional modes and representations of the subunits in the frequency range 0.2–2.0 THz (6.6–66 cm−1).
EXPERIMENTAL CONFIGURATION
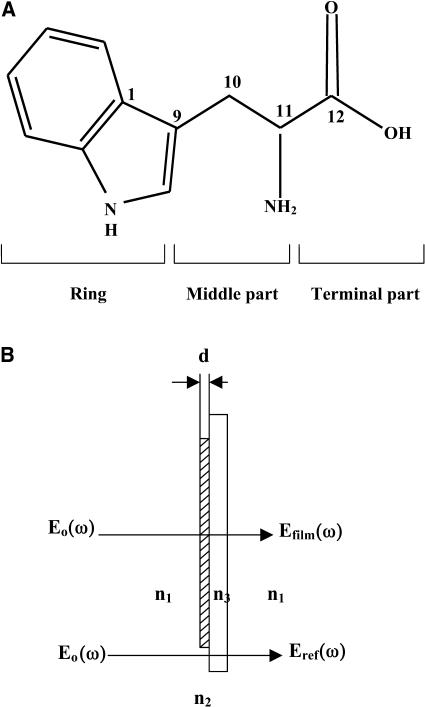
Tryptophan films were prepared by mixing tryptophan powders with methyl alcohol. Tryptophan powders were purchased from Sigma-Aldrich (St. Louis, MO; No. T-8941), used without further purification, and stored in the dark below 5°C. The molecular structure, subunits, and the diagram of a tryptophan sample are shown in Fig. 1. Films from 0.2 to 1.2 mm thickness were prepared by applying an approximate pressure of ∼100 kg cm−1 to the mixture on a polyethylene substrate with thicknesses of 2.0 and 4.0 mm. The thicknesses of 2.0 and 4.0 mm for polyethylene windows were chosen to eliminate etalon spectral oscillations from the substrate. The thickness of the film was measured using a micrometer (Accuaro Gold, Phillipsburg, NJ) with an accuracy of ±0.01 mm. Pressed powders were also used as samples with different window thicknesses.
FIGURE 1.
(A) Structure and subunits of the tryptophan molecule and (B) diagram of the tryptophan sample. n1, n2, and n3 are the refractive indices of air, the tryptophan film, and the polyethylene substrate, respectively.
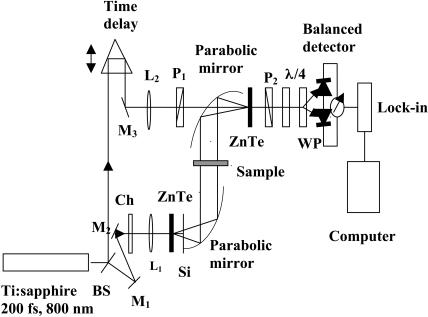
The THz-TDS system used (Grischkowsky et al., 1990; Kindt and Schmuttenmaer, 1996) to perform the measurements is shown in Fig. 2. Details are given in Yu and Alfano (2003). A mode-locked Ti:sapphire amplifier system provided 200-fs pulses at a wavelength of 800 nm with a repetition rate of 250 kHz. THz radiation was produced by optical rectification in a nonlinear medium, namely, a ZnTe crystal via χ(2) that was pioneered by Zhang and co-workers (Wu et al., 1996). The electric field of the THz pulses, after passing through the sample, was detected in a second ZnTe crystal via electro-optic sampling (Wu et al., 1996). The sample was positioned between the emitter and detector. All measurements were made at room temperature. The THz spectroscopy system was enclosed in dry-nitrogen-purged boxes to diminish FIR absorption due to ambient humidity.
FIGURE 2.
Schematic diagram of the THz time-domain spectrometer.
RESULTS AND DISCUSSION
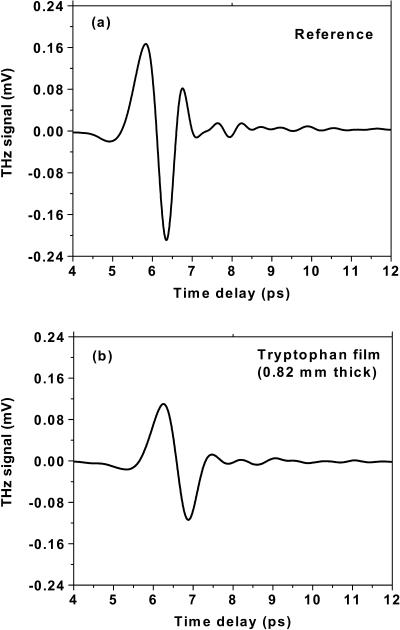
The THz temporal profiles after transmission through a pure polyethylene substrate alone (reference) and a tryptophan film (thickness 0.82 mm) with substrate are shown in Fig. 3. The analysis of the absorption and index of refraction of the tryptophan film are performed by alternating measurements of the transmission three times at normal incidence through the tryptophan film with substrate, and through only the pure polyethylene substrate as a reference. To avoid complications from multiple reflections from the substrate, the maximal recorded delay was limited to 12 ps by the translation stage. A distinct temporal shift of about Δt = 492 fs can be seen between the peaks of Fig. 3, a and b, which is related to the thickness of the sample d and its group index ng. Using the relationship of group delay Δt = (ng − 1) d/c, where c is the velocity of light in free space, ng = 1.18 is obtained (d = 0.82 mm).
FIGURE 3.
Measured THz temporal profiles for (a) the polyethylene substrate alone and (b) the tryptophan film with a thickness of 0.82 mm on a 4-mm-thick polyethylene substrate.
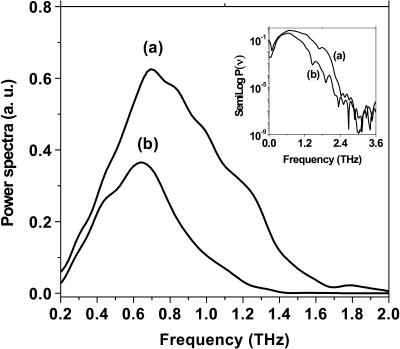
A fast Fourier transform of the temporal profiles (Fig. 3) was performed, and the resultant power is shown in Fig. 4 for both the substrate and the film on the substrate. The power spectrum signal-to-noise ratio was better than 104:1 on semilog P(ν) plots (inset Fig. 4). The absolute frequency scale is calibrated using the known positions of water vapor absorption lines. Weak, discrete absorption lines due to water vapor are visible as dips in the frequency spectrum (Fig. 4) and small oscillations after the main pulse in the time-domain spectrum (Fig. 3). Different THz waveforms in shape and magnitude shown in Fig. 4 indicate some absorption in the tryptophan film. From the Fourier transforms (power spectra and phase shifts), we can determine the frequency-dependent absorption and index of refraction for the film.
FIGURE 4.
Power spectra of (a) the polyethylene substrate alone and (b) the tryptophan film covered on the polyethylene substrate. The logarithm dependence of the power spectra on frequency (ν) is shown in the inset.
For our experimental situation with a relatively small total absorption and a thin sample, multiple reflections of the THz pulse occur between the two surfaces of the sample (tryptophan film). When we consider the effects of the multiple reflections (the Fabry-Perot effect) and the reflection losses from the interfaces of air/film and film/substrate (Fig. 1 b), the field Efilm(ω) after the film has the form (Born and Wolf, 1987; Duvillaret et al., 1996)
 |
(1) |
The reference field Eref(ω) without the sample is given by
 |
(2) |
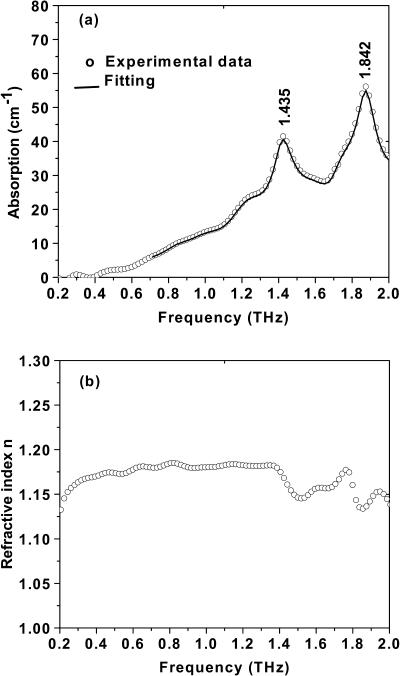
where E0(ω) is the incident field, and Eref(ω) and Efilm(ω) are the reference (without the film) and signal (with the film) field, respectively. All of the reflection, transmission, and propagation coefficients in media 1 and 3 are included in the term η(ω), in which the echoes of the terahertz wave created in media 1 and 3 are negligible or occur on a timescale different from that corresponding to the signal of interest. The t12 and r12 are the complex Fresnel transmission and reflection coefficients from air into the sample of thickness d; t23 and r23 are the transmission and reflection coefficients from the sample into the substrate; and t13 is the transmission coefficient from the air into the substrate. The complex refractive index is  where κ = cα/2ω. With THz-TDS we can measure the magnitude and phase difference of the complex transmission amplitude. The complex spectrum (Eref(ω)) of the reference THz pulse is related to the complex spectrum (Efilm(ω)) of the output THz pulse by the equation Efilm(ω)/Eref(ω) = |t(ω)|exp[−iΔϕ(ω)], where the term Δϕ(ω) is the phase shift between Efilm(ω) and Eref(ω). Using the Fabry-Perot analysis (Duvillaret et al., 1996) of Eq. 1 and the measured ratio of Efilm(ω)/Eref(ω), we numerically remove the multiple reflection effects from our measured data and determine the power (P(ν) = E2(ν)) absorption coefficient α(ν) and the refractive index n (ν) as shown in Figs. 5 a and b, respectively. Two dominated modes occur at 1.435 THz and 1.842 THz. Under the same measurement conditions, we measured the absorption and refractive index for two additional samples with the thicknesses of 0.4 and 1.2 mm. Similar absorption coefficient and peaks were obtained. The results indicate the origin of the absorption peaks that we observed comes from the tryptophan molecules (see Table 1).
FIGURE 5.
(a) Absorbance of the tryptophan film versus frequency (ν). A good fit between 0.7 and 2.0 THz (solid line) was achieved using the parameters given in Table 1. (b) Refractive index of the tryptophan film versus frequency (ν).
TABLE 1.
Molecular parameters extracted from the fit of the absorption data based on Eq. 3 and mode assignments in the frequency range of 0.2–2.0 THz
| Tryptophan | Calculated by DFT | Mode assignment | |
|---|---|---|---|
| ν1 | 1.435 THz (47.4 cm−1) | 1.492 THz | C11-C12 |
| Γ1 | 0.2060 | Chain, terminal part | |
| S1 | 0.0170 | ||
| τ1 | 0.9709 ps | ||
| ν2 | 1.842 THz (60.8 cm−1) | 1.80 THz | C1-C9 |
| Γ2 | 0.1820 THz | Ring | |
| S2 | 0.0123 | ||
| τ2 | 1.0989 ps |
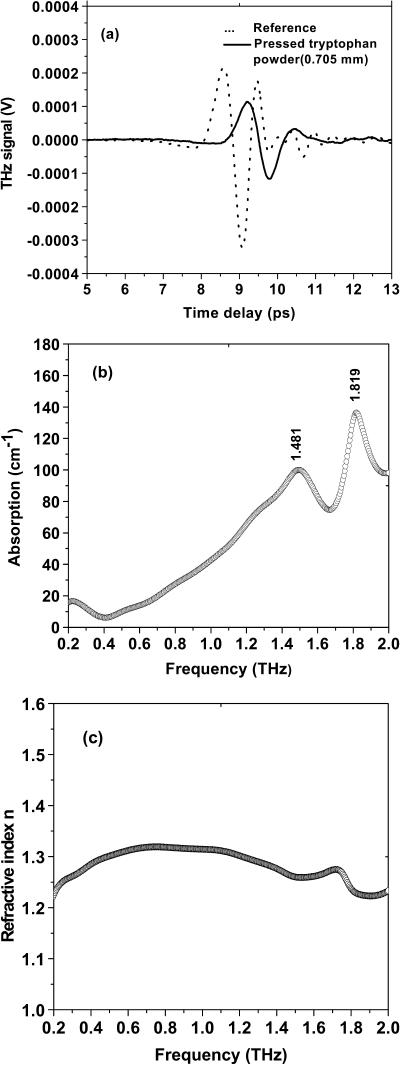
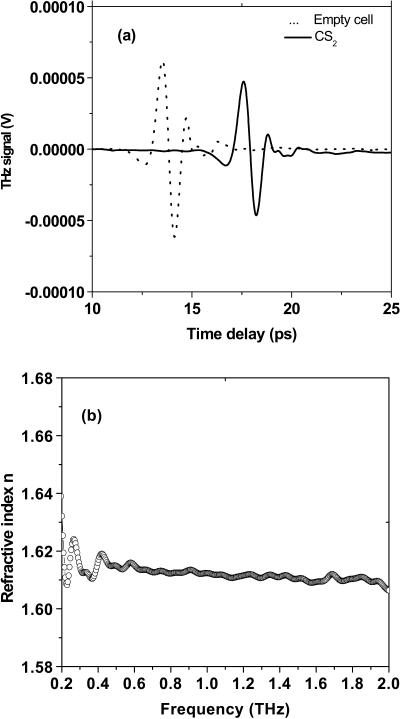
To clarify and support the above results on the films, pure powders of tryptophan were pressed between two polyethylene windows instead of onto just one window. Two dominated absorption peaks at around 1.481 and 1.819 THz were still observed. The peak delay of 0.63 ps for the powder sample with a thickness of 0.705 mm was obtained which leads a group refractive index of 1.27 (see Fig. 6). The refractive index of pressed powders is larger than that of the tryptophan film (∼1.18). Liquid CS2 sealed in a 2-mm-thick quartz cell was used as reference sample. A 4.1-ps shift in the time domain was obtained, leading the group index of refraction of ng = 1.62, which agrees well with the previous report (Yu and Alfano, 2003) (see Fig. 7).
FIGURE 6.
(a) Time profile of THz pulse transmitted through the empty windows and the tryptophan powders (0.705 mm). One window thickness is 2.0 mm. (b) Absorbance of tryptophan powders pressed into two polyethylene windows. (c) Refractive index of the tryptophan powders.
FIGURE 7.
(a) Time profile of THz pulse transmitted through the empty cell and liquid CS2 sample. (b) Refractive index of CS2 versus frequency (ν).
Using the standard expression for Lorentzian oscillators, it is possible to extract the center frequencies νj, the linewidths Γj and the oscillator strengths Sj of the several different modes for film samples which have small inhomogeneous broadening. For the sample of pressed powder, the inhomogeneous broadening cannot be ruled out, and therefore Lorentzian oscillators cannot be used to describe the mode profiles directly. The relaxation lifetime (τ) of the mode can also be extracted for Lorentzian using the relationship of τΓ ≈ 0.2 (Xie et al., 2002). The Lorentzian oscillator model offers a simple description of the complex refractive index across the band profile. It is of crucial importance for the accuracy of the fitting procedure that our method permits simultaneous determination of both absorption and refractive index data. The frequency-dependent complex dielectric function used is (Walther et al., 2000; Moeller and Rothschild, 1971)
 |
(3) |
where the sum is taken over the different oscillators. The high-frequency contribution to the dielectric function is denoted by ɛ∞. The absorption coefficient and refractive index from 0.2 to 2.0 THz were fitted to two oscillators. The center frequencies, linewidths, oscillator strengths, and mode lifetimes were extracted from the fits. The results are listed in Table 1.
The vibrational frequencies of the tryptophan modes are distributed from 3700 cm−1 (O-H stretching) to a few cm−1 (collective modes of the entire protein) in the mid- to FIR regions. Strong force constants and small masses result in high vibrational frequencies, such as for O-H, N-H, and C-H stretching. The concerted motions of a large number of atoms in these low frequencies appear to be mainly from bending, deformation, and torsional motions involving changes in bond angles.
To back up the conclusions above, the low-frequency motions of the modes were calculated using density functional theory (DFT) with software package Gaussian 98 using B3LYP theory and the 6–13G basis set (Frisch et al., 1995). The absorption spectrum and refractive index were calculated by assuming that each resonance mode can be described as a damped oscillator, resulting in a characteristic absorption and refractive index profile described by Eq. 3. The results are shown in Table 1. The major observed modes for the film sample agree fairly well with the calculated results. In addition, in accordance with the analysis for the low-frequency torsional modes for all-trans-retinal reported by Walther et al. (2000) and Gervasio et al. (1998), the modes at 1.435 THz are assigned to C11-C12 torsional motions and the mode at 1.842 THz is localized at the ring C1-C9 (Fig. 1).
The curve in Fig. 5 a shows two broad bands of THz absorbance for the film sample centered at 1.435 THz (47.4 cm−1) and 1.842 THz (60.8 cm−1). The full-width half maximums (FWHM) of these bands are 0.2060 and 0.1820, respectively. The refractive index as a function of frequency is shown in Fig. 5 b, where n(ν) ∼1.14 to 1.2 is obtained over the 0.2–2.0 THz (6.6–66 cm−1) region and is consistent with the calculated value of ng. The oscillation n(ν) is consistent with absorption results.
Since localized twisting motions of nonpolar groups show a weak THz absorption, we estimate that the THz absorbance band of tryptophan is mainly due to many low frequency modes which are collective modes. Because of the dense manifold of torsional states in tryptophan in the THz region and the short relaxation lifetime of these modes, the spectrum appears as a broad continuum of states. The fits to bands are Lorentzian and satisfy the fundamental relationship τΓ ≈ 0.2, which connects the linewidth Γ and the relaxation lifetime τ. The relaxation lifetimes of torsional modes are on the order of picoseconds to subpicoseconds (see Table 1).
CONCLUSION
THz-TDS was used to measure several of the FIR low-frequency torsional vibrational modes and their relaxational times of tryptophan. The dominated modes are at 1.435 THz for C11-C12 torsional motion and 1.842 THz for C1-C9 ring torsional motion. The broadband FIR absorption is due to a large density of low-frequency torsional modes with picosecond to subpicosecond relaxation lifetimes. The refractive index of tryptophan is determined to be n ∼ 1.18 for film and 1.27 for powders in the 0.2–2.0 THz region. This work has important implications for biomolecular dynamics in the fundamental physics of biomolecular low-frequency vibrations.
Acknowledgments
We thank referee Prof. C. Schmuttenmaer of Yale University for comments on our manuscript.
The authors gratefully acknowledge useful discussions with Prof. S. Gayen, Dr. W. Wang, and Dr. K. Sutkus, and financial support from the New York State Office of Science, Technology and Academic Research; the National Aeronautics and Space Administration; and the City University of New York Organized Research Program.
References
- Austin, R. H., M. K. Hong, C. Moser, and J. Plombon. 1991. Far-infrared perturbation of electron tunneling in reaction centers. Chem. Phys. 158:473–486. [Google Scholar]
- Austin, R., M. Roberson, and P. Mansky. 1989. Far-infrared perturbation of reaction rates in myoglobin at low temperature. Phys. Rev. Lett. 62:1912–1915. [DOI] [PubMed] [Google Scholar]
- Beratan, D. N., J. N. Betts, and J. N. Onuchic. 1992. Tunneling pathway and redox-state-dependent electronic couplings at nearly fixed distance in electron-transfer proteins. J. Phys. Chem. 96:2852–2855. [Google Scholar]
- Born, M., and E. Wolf. 1987. Principles of Optics. Pergamon, Oxford.
- Brucherseifer, M., M. Nagel, P. Haring, H. Kurz, A. Bosserhoff, and R. Buttner. 2000. Label-free probing of the binding state of DNA by time-domain terahertz sensing. Appl. Phys. Lett. 77:4049–4051. [DOI] [PubMed] [Google Scholar]
- Duvillaret, L., F. Garet, and J. L. Coutaz. 1996. A reliable method for extraction of material parameters in terahertz time-domain spectroscopy. IEEE J. Selected Topics in Quantum Electronics 2:739–746. [Google Scholar]
- Frisch, M. J., G. W. Trucks, H. B. Schlegel, P. M. Gill, G. Johnson, M. A. Robb, J. R. Cheeseman, T. Keith, G. A. Petersson, J. A. Montgomery, K. Raghavachari, M. A. Al-Laham, V. G. Zakrzewski, J. V. Ortiz, J. B. Foresman, C. Y. Peng, P. Y. Ayala, W. Chen, M. W. Wong, J. L. Andres, E. S. Replogle, R. Gomperts, R. L. Martin, D. J. Fox, J. S. Binkley, D. J. Defrees, J. Baker, J. P. Stewart, M. Head-Gordon, C. Gonzalesz, and J. A. Pople. 1995. Gaussian 94, Revision B.2. Gaussian, Inc., Pittsburgh, PA.
- Gervasio, F., G. Cardini, P. Salvi, and V. Schettino. 1998. Low-frequency vibrations of all-trans-retinal: far-infrared and Raman spectra and density functional calculations. J. Phys. Chem. A. 102:2131–2136. [Google Scholar]
- Grischkowsky, D., S. Keiding, M. Exter, and C. Fattinger. 1990. Far-infrared time-domain spectroscopy with terahertz beams of dielectrics and semiconductors. J. Opt. Soc. Am. B. 7:2006–2015. [Google Scholar]
- Kindt, J. T., and C. A. Schmuttenmaer. 1996. Far-infrared dielectric properties of polar liquids probed by femtosecomd terahertz pulse spectroscopy. J. Phys. Chem. 100:10373–10379. [Google Scholar]
- Markelz, A. G., A. Roitberg, and E. J. Heilweil. 2000. Pulsed terahertz spectroscopy of DNA, bovine serum albumin and collagen between 0.1 and 2.0 THz. Chem. Phys. Lett. 320:42–48. [Google Scholar]
- Moeller, K., and W. G. Rothschild. 1971. Far-Infrared Spectroscopy. Wiley, New York. 557–591.
- Moritugu, K., O. Miyashita, and A. Kidera. 2000. Vibrational energy transfer in a protein molecule. Phys. Rev. Lett. 85:3970–3973. [DOI] [PubMed] [Google Scholar]
- Taday, P. F., I. V. Bradley, D. D. Arnone, and M. Pepper. 2003. Using terahertz pulse spectroscopy to study the crystalline structure of a drug: a case study of the polymorphs of ranitidine hydrochloride. J. Pharm. Sci. 92:831–838. [DOI] [PubMed] [Google Scholar]
- Walther, M., B. Fischer, M. Schall, H. Helm, and P. Jepsen. 2000. Far-infrared vibrational spectra of all-trans, 9-cis and 13-cis retinal measured by THz time-domain spectroscopy. Chem. Phys. Lett. 332:389–395. [Google Scholar]
- Walther, M., P. Plochocka, B. Fischer, H. Helm, and P. Jepsen. 2002. Collective vibrational modes in biological molecules investigated by terahertz time-domain spectroscopy. Biopolymers. 67:310–313. Phys Rev E [DOI] [PubMed] [Google Scholar]
- Woolard, D. L., T. R. Globus, B. L. Gelmont, M. Bykhovskaia, A. C. Samuels, D. Cookmeyer, J. L. Hesler, T. W. Growe, J. O. Jensen, and W. R. Loerop. 2002. Submillimeter-wave phonon modes in DNA macromolecules. Phys. Rev. E. Stat. Nonlin. Soft Matter Phys. 65:051903. [DOI] [PubMed] [Google Scholar]
- Wu, Q., M. Litz, and X. C. Zhang. 1996. Broadband detection capability of ZnTe electro-optic field detectors. Appl. Phys. Lett. 68:2924–2926. [Google Scholar]
- Xie, A., A. F. van der Meer, and R. H. Austin. 2002. Excited-state lifetimes of far-infrared collective modes in proteins. Phys. Rev. Lett. 88:018102–018104. [DOI] [PubMed] [Google Scholar]
- Yu, B. L., and R. R. Alfano. 2003. Probing dielectric relaxation properties of liquid CS2 with terahertz spectroscopy. Appl. Phys. Lett. 82:4633–4635. [Google Scholar]


