Abstract
Simultaneous measurement of multiple signaling molecules is essential to investigate their relations and interactions in living cells. Although a wide variety of fluorescent probes are currently available, the number of probes that can be applied simultaneously is often limited by the overlaps among their fluorescence spectra. We developed the experimental system to measure and analyze many overlapping fluorescent components in single cells. It is based on the recording of two-dimensional single-cell fluorescence spectra and on the blind spectral decomposition of fluorescence data by method of parallel factor analysis. Because this method does not require any preknowledge about the shapes of individual component spectra, it can be applied to the specimens that contain fluorescent components with unknown spectra. By examining the performance using the mixture solutions of fluorescent indicators, it was confirmed that >10 largely overlapping spectral components could be easily separated. The effectiveness in the physiological experiments was proven in the applications to the temporal analysis of intracellular Ca2+ concentration and pH, as well as the intrinsic fluorescent components, in single mouse oocytes.
INTRODUCTION
Molecular fluorescence is widely used for investigating dynamic biological phenomena in living cells and tissues (Mason, 1993), and many kinds of fluorescent probes for cellular activities and molecules, such as fura-2 for Ca2+ (Grynkiewicz et al., 1985), have been applied to physiological experiments with a variety of cell types. In the past decade, an increasing number of fluorescent probes have been developed, relying mainly on techniques to design molecules with the required characteristics by engineering green fluorescent protein or its variants (Miyawaki et al., 1997; Zaccolo et al., 1999; Sato et al., 2002; Van Roessel and Brand, 2002). Among many benefits of using fluorescent probes is that they have specific fingerprints in wavelength space, i.e., excitation and emission spectra, and therefore signals from individual species or states of probes can be distinguished from each other in the mixtures, by measuring fluorescence at different excitation and/or emission wavelengths. This enables us to monitor multiple species of molecules simultaneously by fluorescence spectro/microscopy, and thus to investigate their relations and interactions in the cells (Zimmermann et al., 2002; Hu and Kerppola, 2003). When the number of coexisting fluorophores increases, however, the overlaps among their fluorescence spectra become significant, and it would be difficult to separate each signal correctly.
Linear spectral decomposition, or unmixing, is a straightforward approach to determine the contributions of each fluorophore in the overall fluorescence data, considering the mixed spectrum as the weighted sum of each component, and is practicable when every component spectrum can be measured separately (Dickinson et al., 2001; Zimmermann et al., 2002). In cases of biological applications, however, it is not easy to obtain pure component spectra to be extracted from cellular fluorescence, because the spectra of fluorophores in the intracellular milieu are almost always different from those measured in the solutions in vitro. Moreover, specimens often have significant intrinsic fluorescent components, i.e., autofluorescence, whose precise spectra are unknown, generating inaccuracies in estimating contributions of each extrinsic probe in the fluorescence data obtained.
In this study, we developed the system to measure and analyze temporal changes of many fluorescent components, either intrinsic or extrinsic, at once in single cells. This system is based on fast recording of wide-range two-dimensional (2D) fluorescence spectra in the excitation-emission wavelength space, and on parallel factor analysis (PARAFAC) as the method to decompose fluorescence data that consist of unknown spectral components. PARAFAC is one of blind decomposition methods for multiway data, which is originating from psychometrics (Carroll and Chang, 1970) and is recently gaining more interest in the field of chemometrics (Geladi, 1989; Leurgans and Ross, 1992; Wu et al., 2001) for several reasons. The most important is the uniqueness of solution in PARAFAC (Kruskal, 1977). It is known that the freedom in the axial rotation inevitably remains in the solution obtained by the methods based on singular value decomposition, such as principal component analysis (Kroonenburg, 1983). This means that, when applied to the spectral decomposition, such methods cannot specify the pure component spectra. In contrast, the PARAFAC modeling of spectral data gives a unique solution that represents the estimates of the actual spectra of components and their relative concentrations, enabling us to interpret the results directly. By examining the performance of the system, it was confirmed that >10 fluorescent components whose spectra heavily overlapped each other were easily separated. Spectral resolution was very high, and components with nearly identical spectra could be discriminated, if data were well conditioned. The system was applied to the temporal analysis of intracellular Ca2+ and pH with conventional fluorescent indicators, as well as autofluorescence as the intrinsic indicator of the intracellular redox state, in single mouse oocytes. The results demonstrated the effectiveness of this approach in simultaneous measurements of multiple molecules and activities in living cells.
MATERIALS AND METHODS
Composition of optics
Optical components for 2D fluorescence microspectroscopy were assembled on the conventional inverted epifluorescence microscope (Axiovert S100, Carl Zeiss, Oberkochen, Germany) (Fig. 1 A). A xenon lamp was used as the light source, and various excitation wavelengths were selected by switching bandpass filters on a wheel with rapid filter changer system (Lambda10-2, Sutter Instruments, Novato, CA). A dichroic mirror, which is designed for ultraviolet excitation (FT395, Carl Zeiss), was used commonly for all excitation wavelengths. With this way, modified from Sawano et al. (2002), we obtained a wide range of excitation wavelengths (Fig. 1 B) without switching dichroic mirrors that would be rate limiting in the time-series measurement. Specimen was illuminated through the objective lens (Fluar 20×, numerical aperture (NA) 0.75, Carl Zeiss), and emitted fluorescence was led to the spectrometer (PMA-11, Hamamatsu Photonics, Hamamatsu, Japan) with the quartz optical fiber, after passing through one of the longpass barrier filters that were set on another filter wheel and switched coordinately with excitation filters. Fluorescence dispersed with the Czerny-Turner monochromator was detected with a 1024-channel linear cooled charge-coupled device (CCD) sensor, covering the wavelength range from 200 to 960 nm.
FIGURE 1.
Overview of the system for fluorescence microspectroscopy. (A) Schematic drawing of the optical setup. 1, xenon lamp; 2, heat-absorption filter; 3, excitation filter wheel; 4, neutral density filter; 5, specimen; 6, objective lens; 7, dichroic mirror; 8, barrier filter wheel; 9, quartz optical fiber; 10, spectrometer; 11–13, Czerny-Turner mount of grating and mirrors; 14, cooled CCD sensor. (B) Spectra of excitation light obtained through various interference filters with a common dichroic mirror (solid lines, numbered as 1–9), and transmittances of longpass barrier filters (dashed lines). Matching colors indicate the combinations of excitation filters with barrier filters. (C and D) An example of emission spectra at nine excitation wavelengths, and its contour presentation. It was obtained by measuring fluorescence from a 0.5-μl drop of mixture of seven calcium indicators supplemented with Texas Red dextran (see text for details). The range of emission wavelength where transmittance was lower than 50% (indicated by shaded area in D) was excluded from data for further analysis.
Fluorescent dyes and coenzymes
Most fluorescent indicators (fura-2, fura-6F, indo-1, BTC, Calcium Green-1, fluo-3, Oregon Green 488 BAPTA-1, 2′,7′-bis-(2-carboxyethyl)-5-(and-6)-carboxyfluorescein (BCECF)), as well as some acetoxymethyl (AM) derivatives (fura-2 AM, BCECF AM) and Texas Red dextran, were purchased from Molecular Probes (Eugene, OR). Rhod-2 was from Dojindo Laboratories (Kumamoto, Japan). Mixtures of Ca2+ indicators were prepared in buffers at various free Ca2+ concentrations, using Calcium Calibration Buffer Kit #1 (Molecular Probes). Reduced forms of nicotinamide adenine dinucleotide (NADH; Oriental Yeast, Tokyo, Japan) and nicotinamide adenine dinucleotide phosphate (NADPH; Oriental Yeast), and flavin adenine dinucleotide (FAD; Wako Pure Chemical Industries, Osaka, Japan) were dissolved in 10 mM HEPES (pH 7.3).
Preparation of biological specimen
Procedures to collect oocytes (∼70 μm in diameter) from female mice (B6D2F1) were described elsewhere (Aida et al., 2001). The composition of the extracellular medium used for oocyte preparation was (in mM) 95 NaCl, 4.8 KCl, 1.7 CaCl2, 1.2 KH2PO4, 1.2 MgSO4, 5.1 NaHCO3, 1.2 sodium lactate, 0.5 sodium pyruvate, 5.6 glucose, and 10 HEPES (pH 7.2), supplemented with 4 mg/ml of bovine serum albumin (BSA). The medium used during the fluorescence measurement was deprived of BSA; otherwise it would cause significant background fluorescence in the record. In some experiments, oocytes were loaded with fluorescent indicators by incubation in the medium containing membrane-permeable AM derivatives of dyes at appropriate concentrations.
Mitochondrial inhibitors and IP3 injection
Carbonylcyanide p-trifluoromethoxyphenylhydrazone (FCCP) was purchased from Sigma-Aldrich (St. Louis, MO). Rotenone (RTN), oligomycin A (OA), and antimycin A (AA) were from ICN Biomedicals (Aurora, OH). Inositol 1,4,5-trisphosphate (IP3; Dojindo Laboratories) was dissolved at a concentration of 50 μM in the intracellular medium (140 mM potassium acetate, 1.5 mM MgCl2, 10 mM HEPES; pH 7.3), and injected into the oocyte iontophoretically through a glass micropipette with a rectangular pulse of negative current (Shirakawa and Miyazaki, 1996).
Recording of 2D fluorescence spectra
A glass-bottomed dish was used as the experimental chamber. To measure the fluorescence of indicators in vitro, small drops of buffers (0.5 μl) containing fluorescent indicator(s) were placed on the glass bottom and covered with paraffin oil to avoid evaporation. Oocytes to be measured were stuck on the bottom of the chamber that contained 0.4 ml extracellular medium (33°C). To compose a 2D fluorescence spectrum, excitation was scanned in the wavelength range from 340 to 490 nm by switching nine filters (Fig. 1 B), and emission signals were accumulated for 200–500 ms at each excitation wavelength. To reduce the error originating from time lag between each excitation, excitation scanning was performed twice, once forward and then backward, and averaged thereafter. This single sequence of acquisition was completed in 4–10 s, and repeated with or without time intervals to record a time series of 2D fluorescence spectra of the specimen.
Transmittances of longpass barrier filters were measured with the same spectrometer, using transmission light from the halogen lamp of the microscope, and were used to correct recorded emission signals, together with the factory-supplied calibration table for sensitivities of sensor channels. Although correction for the excitation intensities is not essential for the present decomposition method in principle (see below), spectra of excitation lights, attenuated by a neutral density filter of optical density (OD) 3.0, were recorded by the same spectrometer, placing the tip of the optical fiber above the bottom of the empty chamber. Integrated values and centroids of each spectrum were used as the intensities and wavelengths of excitations, respectively, in the correction of spectral data and the presentation of the results.
A custom program for data acquisition and coordinated control of filters was written as macro codes of IGOR Pro 4 (WaveMetrics, Lake Oswego, OR) running on a notebook PC (ThinkPad A22m, IBM Japan, Tokyo, Japan).
Blind spectral decomposition by PARAFAC
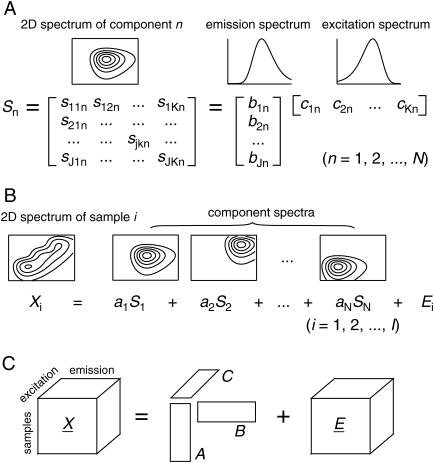
The applicability of PARAFAC to the spectral decomposition of 2D fluorescence data relies on the linear properties of fluorescence (Fig. 2), i.e., 1), excitation and emission spectra of a fluorophore are mutually independent (in other words, the shape of emission (excitation) spectrum is the same at any excitation (emission) wavelengths), and 2), the spectrum of each sample (Xi in Fig. 2 B) can be considered as linear summation of individual spectra of fluorophores contained (Sn in Fig. 2, A and B), as far as their concentrations are low (Lakowicz, 1999). Mathematically, such trilinear structural model of a set of 2D spectral data that contain N components can be expressed as the equation,
 |
(1) |
where xijk (i = 1, 2, … ,I; j = 1, 2, … ,J; k = 1, 2, … ,K) is fluorescence intensity in spectral data of the ith sample at the jth emission wavelength with the kth excitation wavelength, and is expressed as the summation of the products of relative contribution ain (directly related to the amounts of fluorophores, or to the concentrations if the effective volumes of samples are constant), emission spectra bjn, and excitation spectra ckn of each spectral components (n = 1, 2, … ,N). The eijk is the residual term. In matrix notation each spectral data can be written as follows.
 |
(2) |
where Xi (J × K matrix) is the ith 2D spectrum, and B (J × N) and C (K × N) are loading matrices representing emission and excitation spectra of components, respectively. The superscript T stands for transpose. Di (N × N) is a diagonal matrix holding ain in its diagonal, and Ei is a matrix of residuals (Fig. 2 C). PARAFAC modeling is a procedure to determine spectral loading matrices B and C, together with another loading matrix, or a score matrix, A (I × N), which holds ain in its ith row, minimizing the residual iteratively by alternating least-square method (for detailed descriptions of PARAFAC algorithm, see Leurgans and Ross (1992) and Harshman and Lundy (1994)). Element values of A, B, and C in the converged solution can be considered as the relative concentrations and the spectra of components that give the best approximation of the whole data set (I × J × K) with trilinear PARAFAC model (Eq. 1).
FIGURE 2.
Trilinear structure of fluorescence data. (A) Mutual independence of excitation and emission spectra of a single spectral component. Two-dimensional spectrum is represented by a J × K matrix (Sn; n = 1, 2, … ,N), and can be expressed as the outer product of vectors for excitation and emission spectra. (B) Sample spectrum as a weighted sum of component spectra. Two-dimensional spectra of a sample, Xi (i = 1, 2, … ,I), can be expressed as the summation of products of relative concentrations (an) and individual spectra (Sn) for all components contained, plus the residual (Ei). (C) Graphical presentation of trilinear structural model. The whole three-way data array  (I × J × K) can be expressed as the product of two spectral loading matrices B (J × N) and C (K × N), and a sample score matrix A (I × N), plus the residual array
  (I × J × K).
A series of spectral data acquired were first background subtracted, and then corrected for emission filter transmittances. Corrections for any other properties of common optical components, such as the chamber bottom and the objective lens, are not required for subsequent processes of modeling, because they do not affect the trilinear structure of spectral data. Although not essential, spectral data were corrected for sensor sensitivities and excitation intensities, simply to make component spectra more realistic. This was beneficial in assessing the appropriateness and reliability of the modeling results based on the shapes of component spectra obtained as the solution. Corrected data was binned with 5-nm steps along the emission wavelength axis in an appropriate range to reduce data size. In PARAFAC modeling, nonnegativity constraints were applied to all three loadings. The iterations were continued until the relative changes in errors were below a preset threshold. The solution was scaled so as to normalize the peaks in excitation and emission spectra to unity. Model fittings were repeated several times with different sets of orthogonal random values as the initial loadings, unless otherwise specified, and the convergence to nearly identical solutions was confirmed. Preprocessing and modeling were all performed with MATLAB 6.5 software (The MathWorks, Natick, MA) implementing PLS_Toolbox 3.0 (Eigenvector Research, Manson, WA), using a personal computer (PowerMac G4, Apple Computer, Cupertino, CA).
RESULTS AND DISCUSSION
Performance of the system
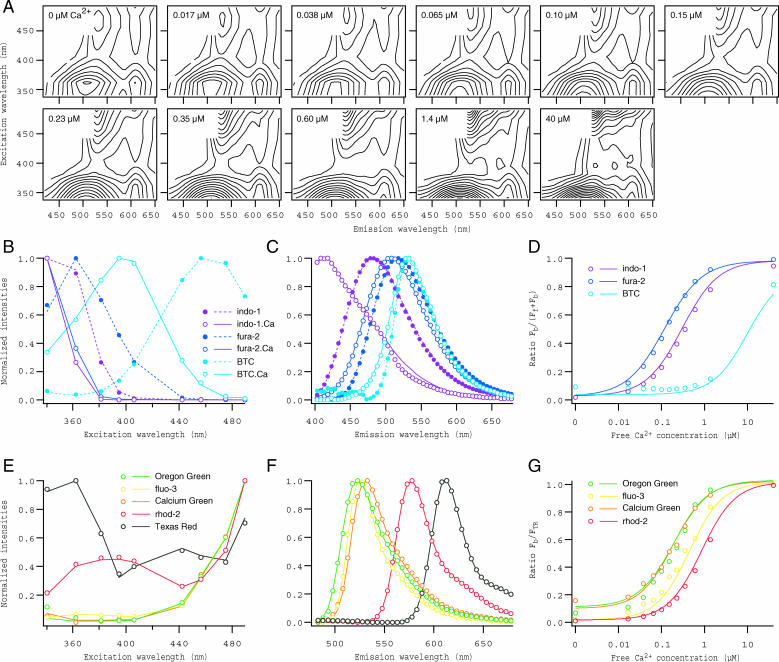
To evaluate the performance of the system, it was first applied to the specimens of mixture solutions of seven commercially available fluorescent Ca2+ indicators whose spectra largely overlap each other. Three of them (fura-2, indo-1, and BTC) are known as ratiometric indicators, exhibiting significant spectral shift between Ca2+-free and-bound forms, whereas the others (Calcium Green-1, fluo-3, Oregon Green 488 BAPTA-1, and rhod-2) are nonratiometric. Fig. 3 A shows a series of 2D spectral data obtained by measuring fluorescence from small drops (0.5 μl) of the mixtures at various free Ca2+ concentrations, placed on the coverslip. The mixtures also contained a constant concentration of Texas Red dextran, as a Ca2+-insensitive reference. Each 2D spectrum was constructed from fluorescence in the emission wavelength 400–670 nm at 5-nm steps, excited at nine different wavelengths (Fig. 1 C). Results obtained from the decomposition of these data by PARAFAC modeling are shown in Fig. 3, B–G. It was concluded that all of 11 spectral components were successfully separated, because the emission and excitation spectra (circles in Fig. 3, B, C, E, and F), as well as the Ca2+ dependence of all seven indicators (circles in Fig. 3, D and G), matched exactly with those obtained from solutions containing single indicators only (lines in Fig. 3, B–G). The spectral resolution was fairly high, indicated by successful separation of very similar spectral components such as Calcium Green-1, fluo-3, and Oregon Green 488 BAPTA-1.
FIGURE 3.
Spectral decomposition of fluorescence from mixture solutions of fluorescent Ca2+ indicators. (A) Contour presentations of 2D spectra obtained from drops of 8-dye mixtures (seven Ca2+ indicators plus Texas Red dextran) at 11 different free Ca2+ concentrations. All drops contained (in μM) 3 fura-2, 2 indo-1, 10 BTC, 0.2 Calcium Green-1, 1 fluo-3, 0.2 Oregon Green 488 BAPTA-1, 3 rhod-2, and 10 Texas Red dextran. (B–G) Results of decomposition by PARAFAC modeling. The results obtained by modeling with 11 spectral components for 8-dye mixture data are shown by circles, separately for ratiometric (B–D) and nonratiometric indicators (E–G), and those obtained from solutions containing single Ca2+ indicators (supplemented with Texas Red dextran, in cases of nonratiometric dyes) are indicated by lines. Loadings for excitation (B and E) and emission spectra (C and F) are shown for all spectral components identified. Ratios of the scores for Ca2+-bound forms (Fb) to Ca2+-free forms (Ff) + Fb are plotted against free Ca2+ concentration (D). For nonratiometric dyes, ratios of Fb to the scores for Texas Red dextran (FTR) are plotted (G). Dye species are discriminated by colors (purple, indo-1; blue, fura-2; cyan, BTC; green, Oregon Green 488 BAPTA-1; yellow, fluo-3; orange, Calcium Green-1; red, rhod-2; black, Texas Red dextran); and filled circles/dashed lines and open circles/solid lines in B and C indicate Ca2+-free and -bound forms of ratiometric dyes, respectively.
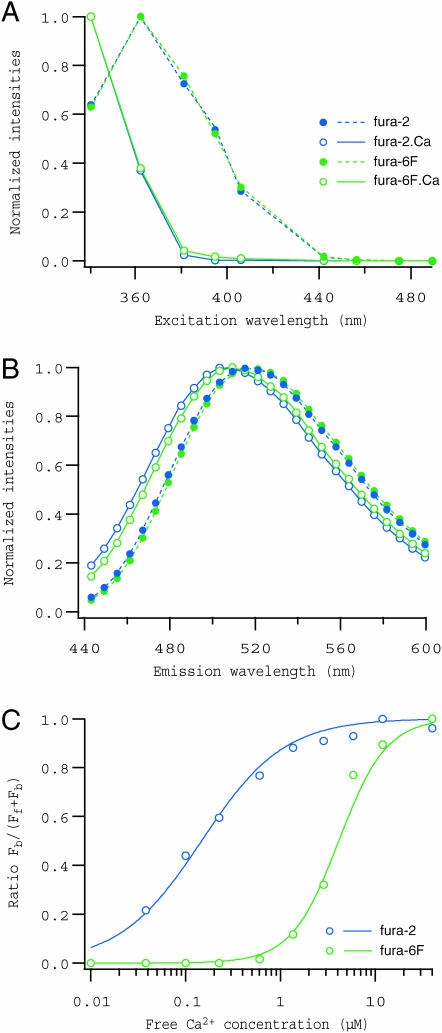
To explore further the resolving power of the system, we next attempted to decompose fluorescence for mixtures of fura-2 and fura-6F. Spectral data were collected from three series of solutions containing either 5 μM fura-2 (F2 series), 5 μM fura-6F (F6F series), or both (F2+F6F series), at 10 different free Ca2+ concentrations. Fluorescence was measured in the same manner as the previous example, and was binned in the emission range of 440–600 nm with a step size of 3 nm. As shown in Fig. 4, spectra of both Ca2+-free and -bound forms of these indicators, obtained by modeling spectral data of F2 and F6F series separately, were nearly identical (lines in Fig. 4, A and B), whereas the dependence on Ca2+ was largely different (lines in Fig. 4 C). Differences in their spectra were so small that we failed to separate these four components in the spectral data of F2+F6F series alone. However, when PARAFAC modeling was performed on a collection of spectral data for F2, F6F and F2+F6F series altogether, holding values of the scores for fura-2 components in F6F series and those for fura-6F components in F2 series to zero (zero constraint), all four components were successfully separated in the data for F2+F6F series, indicated by the correspondence between the Ca2+ dependence of fura-2 and fura-6F calculated from the scores for F2+F6F series (circles in Fig. 4 C) and those obtained by modeling F2 and F6F series separately (lines in Fig. 4 C).
FIGURE 4.
Spectral decomposition of fluorescence from mixtures of fura-2 and fura-6F. Excitation spectra (A), emission spectra (B), and the Ca2+ dependence of ratio Fb/(Ff + Fb) (C) for fura-2 (blue) and fura-6F (green) are shown. A series of spectral data were collected from solutions containing either 5 μM fura-2, 5 μM fura-6F, or both at 10 different free Ca2+ concentrations (0.01, 0.04, 0.10, 0.23, 0.60, 1.4, 2.9, 5.9, 11.9, and 40 μM). Spectra presented by circles in A and B were obtained by PARAFAC modeling performed on all 30 spectral data, and those presented by lines were from data for solutions that contained single indicators only. As in Fig. 3, spectra corresponding to Ca2+-free and -bound forms are represented by filled circles/dashed lines and open circles/solid lines, respectively. Spectral data to be decomposed had a 3-nm bin size, but only every other point in the emission spectra obtained as the solution was plotted in B for clarity. The ratio values plotted against Ca2+ concentration (C) were calculated from the scores for two-indicator solutions (circles) or from those for single indicator solutions (lines).
It was concluded from these results that the system possesses quite high performance in terms of the number of separable spectral components and the spectral resolution, as far as the signal/noise ratio of the measured fluorescence spectra was high and the variance of component concentrations among samples was sufficiently large. Although not examined, the maximum number of separable components may be close to 20 in the conditions of measurements, depending on the appropriate combination of fluorophores. Probably, it can be more if the excitation is scanned over a wider range covering longer wavelength.
Some reasonable constraints in modeling were helpful and improved the ability of decomposition. In addition to nonnegativity assumed for all scores and spectral loadings, zero constraints on the scores for the components that were absent in some samples were useful when modeling difficult-to-fit data set, as the above example of fura-2 and fura-6F. Zero constraint was also effective in modeling spectral data from cells stained with fluorescent indicator(s) and those from unstained cells altogether (see below).
Autofluorescence of mouse oocytes
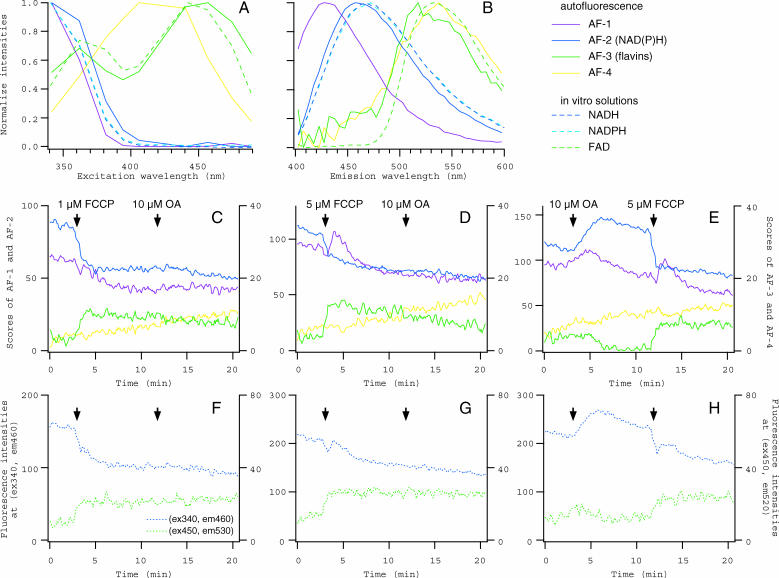
As the first biological application of the system, we analyzed autofluorescence components in mouse oocytes. It is generally believed that major components of cellular autofluorescence originate from reduced pyridine nucleotides (NAD(P)H) and oxidized flavins, and they are conventionally used as the intrinsic indicators of the redox state of the cells (Piston et al, 1995; Andersson et al., 1998; Dellinger et al., 1998). Fig. 5 shows the results of analysis for time series of 2D fluorescence spectra, recorded from single unstained oocytes whose redox states were perturbed with mitochondrial inhibitors. In these cases, the acquisition of each 2D spectrum took 6 s, and repeated for ∼20 min without intervals. Fig. 5, A and B, show the excitation and emission spectra of four autofluorescence components (from AF-1 to AF-4) that were identified by PARAFAC modeling performed on 2460 spectral data from 12 oocytes. In Fig. 5, C–E, time courses of the component scores are shown for three representative oocytes to which a mitochondrial uncoupler, FCCP, and an F0F1-ATPase inhibitor, OA, were successively applied. It is plausible to conclude that AF-2 and AF-3 corresponded to NAD(P)H and oxidized flavins, respectively, according to overall similarities of their excitation and emission spectra to those obtained from measurements of pure solutions (Fig. 5, A and B) and their patterns of changes in the scores (Fig. 5, C–E). A decrease in AF-2 and an increase in AF-3 upon FCCP application indicate intracellular oxidization as a consequence of uncoupling of the oxidative phosphorylation from the electron transport in mitochondria. The application of OA, which blocks mitochondrial ATPase and thus inhibits the overall respiratory chain, caused intracellular reduction as indicated by an increase in AF-2 and a decrease in AF-3 (Fig. 5 E). Once the H+ gradient across the mitochondrial membrane was dissipated by FCCP, the following application of OA did not cause any further changes in the mitochondrial respiration and therefore in the intracellular redox state (Fig. 5, C and D). One of the other components (AF-1) also showed significant changes in its scores upon redox perturbations, but in a more complex manner. The application of OA induced a transient increase (Fig. 5 E), whereas FCCP caused slow and gradual decrease (Fig. 5 C), which occasionally accompanied with fast and transient increase (Fig. 5, D and E). Molecular origin of this component is unknown: it would consist of more than one component whose spectra are too close to be separated by the present system. One of them might be a certain fraction of NAD(P)H molecules that are, for example, bound to enzyme proteins. The other spectral component (AF-4) of unidentified origin artifactually increased during the recording, not depending on the redox state in the oocytes (Fig. 5, C–E). The overall gradual decreases in AF-1 and AF-2 were probably due to photobleaching.
FIGURE 5.
Spectral decomposition of autofluorescence in mouse oocytes. (A and B) Excitation and emission spectra of four autofluorescence components identified in unstained oocytes (from AF-1 to AF-4, solid lines). Spectra obtained from the solutions of NADH, NADPH, and FAD (dashed lines) are also presented for comparison. (C–E) Time courses of changes in the scores for from AF-1 to AF-4 in the oocytes that were exposed successively to FCCP (1 or 5 μM) and OA (10 μM). Scores for AF-1 (purple) and AF-2 (blue) are plotted on the left axis, and those for AF-3 (green) and AF-4 (yellow) are on the right axis. (F–H) Time courses of changes in fluorescence intensities. Intensities in the spectral data from oocytes in C–E were averaged for 460 ± 5 nm emission at 340 nm excitation (blue, on the left axis) and for 530 ± 5 nm emission at 450 nm excitation (green, on the right axis). Time points when the inhibitor was applied were indicated by arrows in C–H.
A conventional method to monitor changes in the intracellular concentrations of NAD(P)H and oxidized flavins is to measure fluorescence at excitation and emission wavelengths where maximum signal intensities can be obtained (Griffiths et al., 1997; Hajnóczky et al., 1999; Mironov and Richter, 2001). To simulate the results of such measurement, fluorescence intensities in the same spectral data as used for PARAFAC modeling (corresponding to the oocytes in Fig. 5, C–E) were plotted for the wavelengths that are typically used for measurements of NAD(P)H (340/460 nm for excitation/emission) and flavins (450/530 nm) in Fig. 5, F–H. Because, as revealed by the decomposition, spectra of NAD(P)H and flavins are largely overlapping with other components (AF-1 and AF-4), the conventional measurement would result in a misunderstanding about the time course and amplitude of actual changes of these molecules in the oocytes (compare Fig. 5, C–E and F–H).
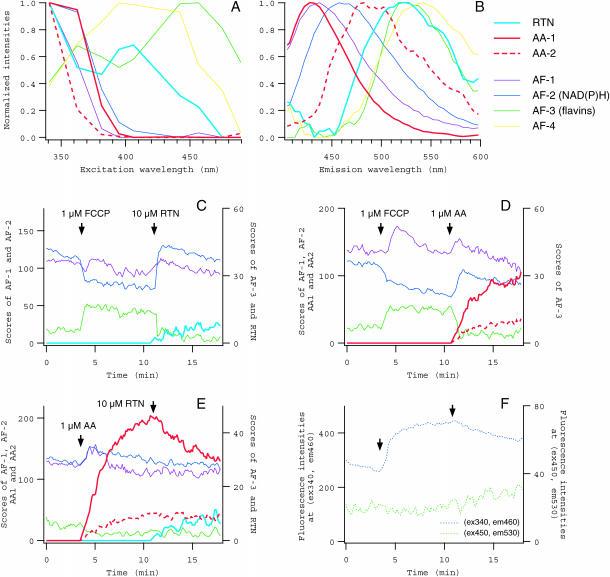
Many reagents useful for biological studies are more or less fluorescent, and therefore their applications would confound the experiments that are based on the conventional measurement of specimen fluorescence, if the spectra of such reagents overlap with those of fluorescence of interest. The system, which does not require preknowledge about the component spectra to be separated, enabled us to effectively eliminate the contamination of annoying fluorescence of reagents applied (Fig. 6). We collected 1440 spectral data from 10 series of measurements, during each of which RTN and/or AA, blockers of the electron transport at Complexes I and III, respectively, were applied to single unstained oocytes in combination with FCCP. Decomposition by PARAFAC modeling, applying appropriate zero constraints, revealed spectral components for RTN and AA, as well as autofluorescence components (Fig. 6, A and B). Fluorescence of AA, which appeared to consist of two spectral components (AA-1 and AA-2), was strong and the spectrum was largely overlapping with NAD(P)H and AF-1, whereas RTN had relatively weak fluorescence with the spectrum overlapping with flavins. Gradual increases in the scores of these components after the application to the medium (Fig. 6,C–E) indicated the accumulation of reagent molecules in the oocytes, because the extracellular medium containing AA or RTN had only negligible fluorescence, when measured after the recording of oocyte (not shown).
FIGURE 6.
Spectral decomposition of fluorescence in oocytes exposed to fluorescent reagents. (A and B) Excitation and emission spectra of autofluorescence components and mitochondrial inhibitors, RTN, and AA. One component for RTN (cyan) and two components for AA (AA-1 and AA-2, red) were identified (thick lines), in addition to four autofluorescence components (from AF-1 to AF-4, thin lines of the same colors as in Fig. 5). (C–E) Changes in the scores of spectral components in the oocytes that were exposed to FCCP (1 μM), RTN (10 μM), and AA (1 μM). Scores for from AF-1 to AF-3 as well as those for RTN, AA-1, and AA-2 are plotted. (F) Fluorescence intensities in the spectral data from the oocyte in E. The averaged ranges of excitation and emission wavelengths were the same as in Fig. 5, F–H.
Changes in autofluorescence components could be measured separately from fluorescence of these reagents, and we could clearly identify the increase in NAD(P)H and the decrease in oxidized flavins, as well as the transient increase of AF-1, upon the application of RTN or AA in the presence of FCCP (Fig. 6, C and D). These changes indicate the intracellular reduction due to the inhibition of the electron transport by RTN or AA. Small increase in NAD(P)H and decrease in flavins were induced by AA even in the absence of FCCP. Once the electron transport was blocked by AA, the following application of RTN did not cause further inhibition and therefore no changes in the redox state were detected (Fig. 6 E). These responses would be indistinguishable in the conventional fluorescence measurement (Fig. 6 F). Thus it is the advantage of the present system that one can monitor changes in the fluorescence signals of interest, in response to the application of any reagent no matter whether it has fluorescence or not.
Because fluorescence signals from single unstained oocytes were 10–100-fold weaker than in vitro samples used in the modeling in the previous section, more spectral data were to be fitted altogether to obtain solutions of satisfactory quality. Otherwise, autofluorescence components with smaller contributions (AF-3 and AF-4) would be dominated by noise, and would not be separated correctly. Four spectral components revealed above were identified invariably in the intrinsic fluorescence of all unstained mouse oocytes examined, and provided the basis for the applications of extrinsic fluorescent indicators in the following section. That is, the identification of all these components in the solution of modeling was considered as a criterion for successful decomposition.
Simultaneous measurement of intracellular Ca2+, pH, and redox state
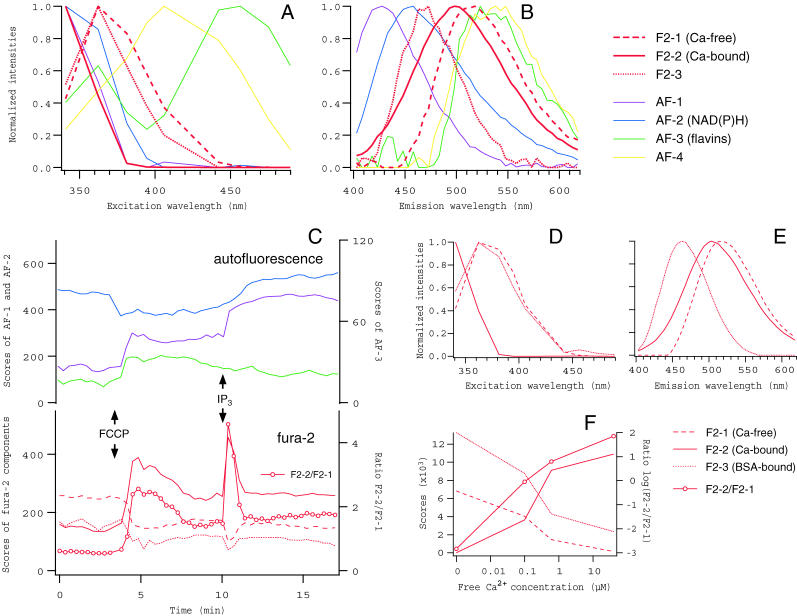
Oocytes were loaded with a Ca2+ indicator, fura-2, and the changes in intracellular Ca2+ were analyzed, simultaneously with the autofluorescence components (Fig. 7). Loading condition (incubation in 0.2 μM fura-2 AM for 10 min at 37°C) was determined to give fluorescence intensity of fura-2 comparable to autofluorescence. Modeling was performed on a collection of 590 spectral data from 12 experiments (four for fura-2-loaded and eight for unstained oocytes). To obtain satisfactory fit to data, we had to assume three spectral components for fura-2, in addition to four autofluorescence components (Fig. 7, A and B). Two of them (F2-1 and F2-2) obviously corresponded to Ca2+-free and -bound forms, indicated by the spectra and the patterns of changes in their scores (Fig. 7, A–C). In response to the application of FCCP, a rise of intracellular Ca2+ concentrations, indicated by the increase in the ratio of the scores of F2-2 to F2-1, was detected, whereas the intracellular oxidization was indicated by changes in autofluorescence components (Fig. 7 C). Because OA did not cause significant Ca2+ changes during the period of measurement (not shown), this Ca2+ rise induced by FCCP would not be a consequence of the reduced activity of Ca2+ ATPase pumps due to the inhibition of ATP synthesis. Rather, it suggests the role of mitochondrial Ca2+ uptake in maintaining cytoplasmic Ca2+ concentration in the oocytes, as in other cell types (Duchen, 2000). A transient increase in Ca2+ was induced by the injection of IP3, which mobilizes Ca2+ from internal stores, in the presence of FCCP and seemed to cause slow and sustained increases in NAD(P)H and AF-1, suggesting the modification of mitochondrial metabolism by Ca2+ released from IP3-sensitive Ca2+ stores.
FIGURE 7.
Spectral decomposition of fluorescence from oocytes loaded with fura-2, and from in vitro solution of fura-2 in the presence of BSA. (A–C) Excitation and emission spectra, and the scores of components obtained from fura-2-loaded oocytes. Three components corresponding to fura-2 molecules in distinct states (from F2-1 to F2-3, red thick lines in A and B) were identified, whereas four autofluorescence components (thin lines of the same colors as in Fig. 5) with essentially the same spectra as in Fig. 5 were separated. Changes in the scores of spectral components (except AF-4) in response to FCCP (1 μM) and the following injection of IP3, together with the ratio of F2-2 (Ca2+-bound form) to F2-1 (Ca2+-free form), are plotted in C. An increase (decrease) in the ratio indicates a rise (fall) of intracellular Ca2+ concentration. (D–F) The spectra and the scores of three components identified in fura-2/BSA solutions. Spectral data were obtained from drops of Ca2+ buffers containing 2 μM fura-2 and 5 mg/ml BSA, at free Ca2+ concentrations of 0, 0.1, 0.6, and 40 μM. The third component (AF-3, dotted lines) was absent in BSA-free fura-2 solutions (see Fig. 2, B and C) and fura-2-free BSA solutions (not shown), and therefore corresponded to BSA-bound fraction of fura-2.
The third component of fura-2 (F2-3), which showed blue-shifted emission spectrum, probably originated from a fraction of molecules that were bound nonspecifically to cellular proteins, because a similar spectral component was identified when fura-2 was dissolved in Ca2+ buffers in vitro together with BSA (Fig. 7, D and E). This component appeared to have negative dependence on Ca2+ concentrations (Fig. 7, C and F), and may partly explain significant deviation of calibration curve for fura-2 in situ obtained by, e.g., using permeabilized cells, from that obtained by solutions in Ca2+ buffers in vitro (Konishi et al., 1988).
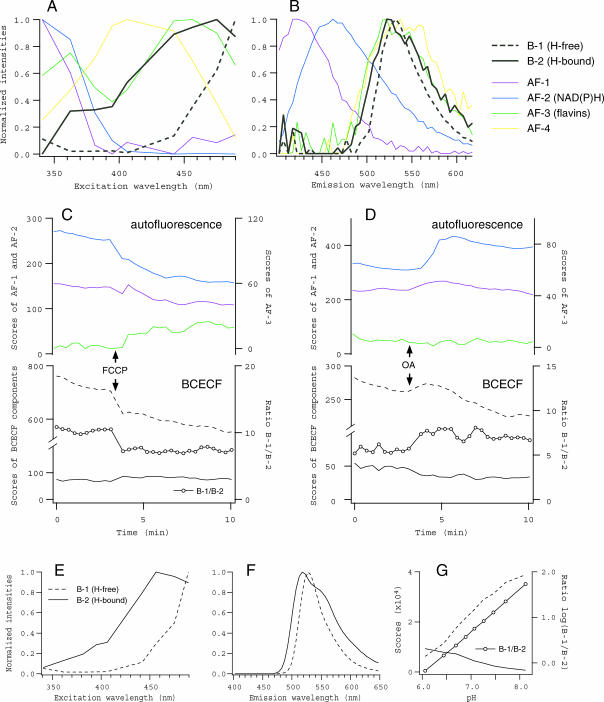
Similarly, intracellular pH could be monitored together with the redox state, by using fluorescent pH indicator, BCECF. Fig. 8 shows the results of PARAFAC modeling performed on 290 spectral data collected from 10 experiments (three for BCECF-loaded and seven for unstained oocytes). In contrast to fura-2, BCECF in the oocytes had only two spectral components (B-1 and B-2), which evidently corresponded to H+-free and -bound forms, indicated by the similarity to the spectra for BCECF dissolved in pH buffers in vitro (Fig. 8, A and B, and E–G). Changes in the ratio of the scores of from B-1 to B-2 indicated that FCCP and OA induced cytoplasmic acidification and alkalization, respectively (Fig. 8, C and D). The reasons for these changes in cytoplasmic pH, although unknown, should be explained in the context of proton transport systems not only across the mitochondrial membrane but also across the plasma membrane.
FIGURE 8.
Spectral decomposition of fluorescence from oocytes loaded with BCECF, and from in vitro solutions of BCECF. (A–D) Excitation and emission spectra, and the scores of components obtained from BCECF-loaded oocytes. Two components corresponding to BCECF (B-1 and B-2, black thick lines in A and B) were identified, whereas four autofluorescence components (thin lines of the same colors as in Fig. 5) with essentially the same spectra as in Fig. 5 were separated. Changes in the scores of spectral components (except AF-4) in response to FCCP (1 μM) and OA (10 μM), together with the ratio of B-1 (H+-free form) to B-2 (H+-bound form), are plotted in C and D, respectively. An increase (decrease) in the ratio indicates the alkalization (acidification) in the oocyte. (E–G) The spectra and the scores of two components identified in BCECF solutions. Spectral data were obtained from drops of pH buffers containing 2 μM BCECF, adjusted at nine different pH.
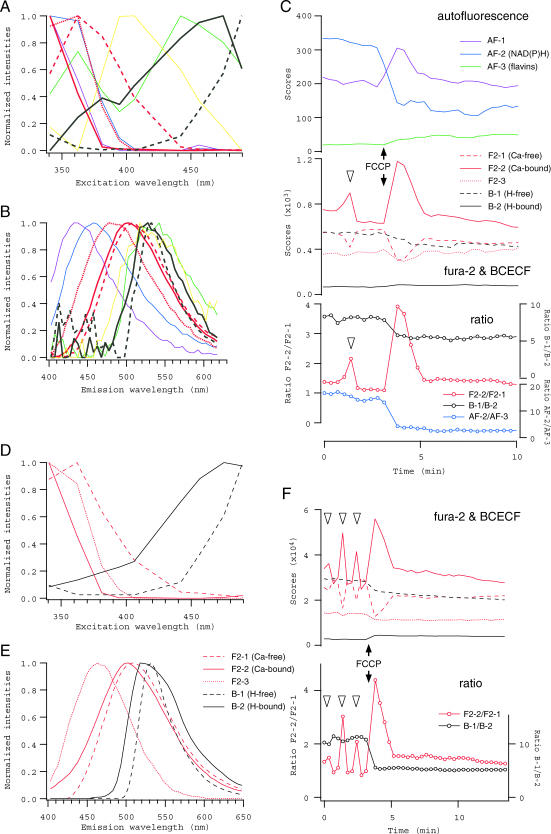
Intracellular Ca2+ and pH could be monitored simultaneously in the oocytes that were stained with both fura-2 and BCECF, either appreciating autofluorescence components as the redox indicator or neglecting them as the background, depending on the concentrations of indicators loaded in the oocytes (Fig. 9). As an example of the former case, spectral data were recorded in eight experiments where FCCP was applied to single oocytes either unstained or loaded mildly with fura-2, BCECF or both by incubation in 0.5 μM fura-2 AM and/or 5 nM BCECF AM for 10 min. Results of PARAFAC modeling performed for a collection of these data with nine spectral components were shown in Fig. 9,A–C. In this case, component spectra that were obtained in advance from the oocytes stained with either fura-2 or BCECF (Fig. 7, A and B, and Fig. 8, A and B) were used as the initial values of loadings for the iterations. The individual component spectra as the final solution (Fig. 9, A and B), as well as time courses of changes in their scores in the oocyte loaded with both indicators (Fig. 9 C), were consistent with the results shown in Figs. 5–8, indicating the decomposition was successful. The redox state seemed not to be perturbed by a small Ca2+ transient observed before FCCP application, which is known to repeat spontaneously in some fraction of isolated oocytes (Carroll and Swann, 1992; see also Fig. 9 F).
FIGURE 9.
Spectral decomposition of fluorescence from oocytes loaded with fura-2 and BCECF. (A–C) Excitation and emission spectra, and the scores of components obtained from the oocytes that were loaded mildly with fura-2 and BCECF. Three fura-2 components (red thick lines in A and B) and two BCECF components (black thick lines) were identified, whereas four autofluorescence components (thin lines of the same colors as in Fig. 5) were distinguished as well. Changes in the scores of each spectral component (except AF-4) in response to FCCP (1 μM), together with the ratios F2-2/F2-1, B-1/B-2, and AF-2/AF-3, are plotted in C. A decrease in the ratio AF-2/AF-3 indicates the oxidization in the oocyte. (D–F) The spectra and the scores of five components identified in the oocytes that were loaded with fura-2 and BCECF at higher concentrations. Triangles in C and F indicate spontaneous Ca2+ transients observed before FCCP application.
When oocytes were loaded with indicators at higher concentrations, extrinsic fluorescence was strong enough and thus autofluorescence components were practically negligible in the modeling. In the example shown in Fig. 9, D–F, spectral data were collected from three experiments, in each of which FCCP was applied to single oocytes loaded with indicators by incubation for 10 min in the medium containing either 10 μM fura-2 AM, 1 μM BCECF AM, or both. Only five spectral components were necessary to obtain a reasonable solution in PARAFAC modeling (Fig. 9, D and E), and changes in their scores for the oocyte loaded with both indicators clearly indicated the elevation in intracellular Ca2+ concentration and the acidification after FCCP application, as well as spontaneous Ca2+ oscillations (Fig. 9 F). No Ca2+ transients were observed in the presence of FCCP, suggesting that mitochondria may participate in the maintenance of Ca2+ oscillations in the oocytes, either directly (by sequestering Ca2+) or indirectly (by regulating the redox state, ATP concentration, and/or pH).
The strategy of the multiprobe application with the present system is summarized as follows. First, one has to identify the intrinsic fluorescent components in the cells or tissues to be used. Next, the number and shapes of spectral components for each extrinsic fluorescent probe should be specified using the cells stained with single probes. The loading conditions can be adjusted to obtain probe fluorescence intensity either comparable to or greatly prevailing over the autofluorescence components, depending on the purpose. Finally, modeling must be performed on a collection of spectral data for single probe-loaded, multiple probe-loaded and, if autofluorescence components are to be measured, unstained cells altogether, using spectral loadings for each probe obtained in the previous step as the initial values and applying appropriate zero constraints to the scores.
CONCLUSION
The system presented in this article is based on microscopic measurement of single cell 2D fluorescence and the spectral decomposition by PARAFAC modeling. Preknowledge about the component spectra is not required in principle for the decomposition procedure. This blindness of the algorithm, together with the uniqueness of the solution, makes PARAFAC invaluable in analyzing multiple spectral components in the fluorescence of biological specimens. In the applications of extrinsic probes, fluorescence signals corresponding to molecular states of many coexisting probes can be unmixed and then analyzed separately. Heavy overlaps among component spectra are acceptable, meaning that the degree of freedom in choosing and combining fluorescent probes is quite large. The system can be used to investigate biological specimens that contain unknown intrinsic fluorescent components as well. Some autofluorescence components indicate the intracellular redox state, as shown in many studies including this one, and others may have pathological significance in certain types of cells and tissues (Richards-Kortum and Sevick-Muraca, 1996; Inaguma and Hashimoto, 1999; Rigacci et al., 2000).
The time resolution of the system is limited by the speed of excitation scanning (∼2 s for nine-excitation measurements), and therefore can be improved by equipping the faster scanning apparatus. The lower fluorescence intensity, which is expected in the measurement of smaller cells as well as in the faster recording, can be partly circumvented by, e.g., increasing dye concentration, using an objective lens with higher N.A., and/or reducing the number of excitation wavelengths, depending on experimental purposes. Furthermore, the decomposition by PARAFAC modeling, which fits the model to data as a whole, will be successful even if spectral data for each are noisy (as in the case of autofluorescence, shown in Figs. 5 and 6), as far as it is performed on a sufficiently large number of data.
Although the system can analyze only temporal changes of cellular fluorescence, the expansion to a multispectral imaging system for spatiotemporal analysis is straightforward. It should be noted that the same decomposition method can be applied to a collection of fluorescence images recorded at various combinations of excitation and emission wavelengths. The algorithm does not discriminate the spatial and temporal axes of data, and therefore all points in a time series of images at the same wavelength coordinate can be serialized into a stream in one dimension. It will be a powerful method not only for the investigation of the spatiotemporal dynamics and the interactions of multiple intracellular signaling molecules in living cells, but also for cell and tissue diagnosis in clinical medicine.
Acknowledgments
We thank Y. Konuma, T. Shikano, and N. Suzuki for technical assistance.
References
- Aida, T., S. Oda, T. Awaji, K. Yoshida, and S. Miyazaki. 2001. Expression of a green fluorescent protein variant in mouse oocytes by injection of RNA with an added long poly(A) tail. Mol. Hum. Reprod. 7:1039–1046. [DOI] [PubMed] [Google Scholar]
- Andersson, H., T. Baechi, M. Hoechl, and C. Richter. 1998. Autofluorescence of living cells. J. Microsc. 191:1–7. [DOI] [PubMed] [Google Scholar]
- Carroll, J. D., and J. Chang. 1970. Analysis of individual differences in multidimensional scaling via an N-way generalization of “Eckart-Young” decomposition. Psycometrika. 45:3–24. [Google Scholar]
- Carroll, J., and K. Swann. 1992. Spontaneous cytosolic calcium oscillations driven by inositol trisphosphate occur during in vitro maturation of mouse oocytes. J. Biol. Chem. 267:11196–11201. [PubMed] [Google Scholar]
- Dellinger, M., M. Geze, R. Santus, E. Kohen, C. Kohen, J. G. Hirschberg, and M. Monti. 1998. Imaging of cells by autofluorescence: a new tool in the probing of biopharmaceutical effects at the intracellular level. Biotechnol. Appl. Biochem. 28:25–32. [PubMed] [Google Scholar]
- Dickinson, M. E., G. Bearman, S. Tille, R. Lansford, and S. E. Fraser. 2001. Multi-spectral imaging and linear unmixing add a whole new dimension to laser scanning fluorescence microscopy. Biotechniques. 31:1272–1277. [DOI] [PubMed] [Google Scholar]
- Duchen, M. R. 2000. Mitochondria and calcium: from cell signalling to cell death. J. Physiol. 529:57–68. [DOI] [PMC free article] [PubMed] [Google Scholar]
- Geladi, P. 1989. Analysis of multi-way (multi-mode) data. Chemom. Intell. Lab. Syst. 7:11–30. [Google Scholar]
- Griffiths, E. J., S.-K. Wei, M. C. P. Haigney, C. J. Ocampo, M. D. Stern, and H. S. Silverman. 1997. Inhibition of mitochondrial calcium efflux by clonazepam in intact single rat cardiomyocytes and effects on NADH production. Cell Calcium. 21:321–329. [DOI] [PubMed] [Google Scholar]
- Grynkiewicz, G., M. Poenie, and R. Y. Tsien. 1985. A new generation of Ca2+ indicators with greatly improved fluorescence properties. J. Biol. Chem. 260:3440–3450. [PubMed] [Google Scholar]
- Hajnóczky, G., R. Hager, and A. P. Thomas. 1999. Mitochondria suppress local feedback activation of inositol 1,4,5-trisphosphate receptors by Ca2+. J. Biol. Chem. 274:14157–14162. [DOI] [PubMed] [Google Scholar]
- Harshman, R. A., and M. E. Lundy. 1994. PARAFAC: parallel factor analysis. Comp. Stat. Data Anal. 18:39–72. [Google Scholar]
- Hu, C.-D., and T. K. Kerppola. 2003. Simultaneous visualization of multiple protein interactions in living cells using multicolor fluorescence complementation analysis. Nat. Biotechnol. 21:539–545. [DOI] [PMC free article] [PubMed] [Google Scholar]
- Inaguma, M., and K. Hashimoto. 1999. Porphyrin-like fluorescence in oral cancer. Cancer. 86:2201–2211. [DOI] [PubMed] [Google Scholar]
- Konishi, M., A. Olson, S. Hollingworth, and S. M. Baylor. 1988. Myoplasmic binding of fura-2 investigated by steady-state fluorescence and absorbance measurements. Biophys. J. 54:1089–1104. [DOI] [PMC free article] [PubMed] [Google Scholar]
- Kroonenburg, P. M. 1983. Three-Mode Principal Component Analysis: Theory and Applications. DSWO Press, Leiden, The Netherlands.
- Kruskal, J. B. 1977. Three-way arrays: rank and uniqueness of trilinear decomposition, with application to arithmetic complexity and statistics. Linear Algebra Appl. 18:95–138. [Google Scholar]
- Lakowicz, J. R. 1999. Principles of Fluorescence Spectroscopy, 2nd ed. Kluwer Academic/Plenum Publishers, New York.
- Leurgans, S., and R. T. Ross. 1992. Multilinear models in spectroscopy. Statist. Sci. 7:289–319. [Google Scholar]
- Mason, W. T. 1993. Fluorescent and Luminescent Probes for Biological Activity: A Practical Guide to Technology for Quantitative Real-Time Analysis. Academic Press, London, UK.
- Mironov, S. L., and D. W. Richter. 2001. Oscillations and hypoxic changes of mitochondrial variables in neurons of the brainstem respiratory centre of mice. J. Physiol. 533:227–236. [DOI] [PMC free article] [PubMed] [Google Scholar]
- Miyawaki, A., J. Llopis, R. Heim, J. M. McCaffery, J. A. Adams, M. Ikura, and R. Y. Tsien. 1997. Fluorescent indicators for Ca2+ based on green fluorescent proteins and calmodulin. Nature. 388:882–887. [DOI] [PubMed] [Google Scholar]
- Piston, D. W., B. R. Masters, and W. W. Webb. 1995. Three-dimensionally resolved NAD(P)H cellular metabolic redox imaging of the in situ cornea with two-photon excitation laser scanning microscopy. J. Microsc. 178:20–27. [DOI] [PubMed] [Google Scholar]
- Richards-Kortum, R., and E. Sevick-Muraca. 1996. Quantitative optical spectroscopy for tissue diagnosis. Annu. Rev. Phys. Chem. 47:555–606. [DOI] [PubMed] [Google Scholar]
- Rigacci, L., R. Alterini, P. A. Bernabei, P. R. Ferrini, G. Agati, F. Fusi, and M. Monici. 2000. Multispectral imaging autofluorescence microscopy for the analysis of lymph-node tissues. Photochem. Photobiol. 71:737–742. [DOI] [PubMed] [Google Scholar]
- Sato, M., T. Ozawa, K. Inukai, T. Asano, and Y. Umezawa. 2002. Fluorescent indicators for imaging protein phosphorylation in single living cells. Nat. Biotech. 20:287–294. [DOI] [PubMed] [Google Scholar]
- Sawano, A., H. Hama, N. Saito, and A. Miyawaki. 2002. Multicolor imaging of Ca2+ and protein kinase C signals using novel epifluorescence microscopy. Biophys. J. 82:1076–1085. [DOI] [PMC free article] [PubMed] [Google Scholar]
- Shirakawa, H., and S. Miyazaki. 1996. Spatiotemporal analysis of calcium dynamics in the nucleus of hamster oocytes. J. Physiol. 494:29–40. [DOI] [PMC free article] [PubMed] [Google Scholar]
- Van Roessel, P., and A. H. Brand. 2002. Imaging into the future: visualizing gene expressions and protein interactions with fluorescent proteins. Nat. Cell Biol. 4:E15–E20. [DOI] [PubMed] [Google Scholar]
- Wu, H.-L., R.-Q. Yu, and K. Ogura. 2001. Trilinear component analysis in modern analytical chemistry. Anal. Sci. 17(Suppl.):i483–i486. [Google Scholar]
- Zaccolo, M., F. De Giorgi, C. Y. Cho, L. Feng, T. Knapp, P. A. Negulescu, S. S. Taylor, R. Y. Tsien, and T. Pozzan. 1999. A genetically encoded, fluorescent indicator for cyclic AMP in living cells. Nat. Cell Biol. 2:25–29. [DOI] [PubMed] [Google Scholar]
- Zimmermann, T., J. Rietdorf, A. Girod, V. Georget, and R. Pepperkok. 2002. Spectral imaging and linear un-mixing enables improved FRET efficiency with a novel GFP2-YFP pair. FEBS Lett. 531:245–249. [DOI] [PubMed] [Google Scholar]


