Abstract
A mixed bilayer of cholesterol and dimyristoylphosphatidylcholine has been formed on a gold-coated block of quartz by fusion of small unilamellar vesicles. The formation of this bilayer lipid membrane on a conductive surface allowed us to study the influence of the support's surface charge on the structure and hydration of the bilayer lipid membrane. We have employed electrochemical measurements and the specular reflection of neutrons to measure the thickness and water content in the bilayer lipid membrane as a function of the charge on the support's surface. When the surface charge density is close to zero, the lipid vesicles fuse directly on the surface to form a bilayer with a small number of defects and hence small water content. When the support's surface is negatively charged the film swells and incorporates water. When the charge density is more negative than −8 μC cm−2, the bilayer starts to detach from the metal surface. However, it remains in a close proximity to the metal electrode, being suspended on a thin cushion of the electrolyte. The field-driven transformations of the bilayer lead to significant changes in the film thicknesses. At charge densities more negative than −20 μC cm−2, the bilayer is ∼37 Å thick and this number is comparable to the thickness determined for hydrated multilayers of dimyristoylphosphatidylcholine from x-ray diffraction experiments. The thickness of the bilayer decreases at smaller charge densities to become equal to ∼26 Å at zero charge. This result indicates that the tilt of the acyl chains with respect to the bilayer normal changes from ∼35° to 59° by moving from high negative charges (and potentials) to zero charge on the metal.
INTRODUCTION
Phospholipid bilayers formed by the fusion of small unilaminar vesicles onto glass or organic film modified surfaces constitute an attractive model of a biological membrane to study membrane processes (Bayerl and Bloom, 1990; Brian and McConnell, 1984; Leonenko et al., 2000; Schmidt et al., 1992; Sackmann, 1996; Williams et al., 1997). Monolayers (e.g., Buoninsegni et al., 1998; Bizzotto and Nelson, 1998; Bizzotto et al., 1999; Guidelli et al., 2001; Miller, 1981; Nelson and Benton, 1986; Nelson and Leermakers, 1990; Nelson and Bizzotto, 1999; Stoodley and Bizzotto, 2003) and bilayers (Stauffer et al., 2001; Horswell et al., 2002; Stoodley and Bizzotto, 2003) of phospholipids have also been deposited or tethered (e.g., Cornell et al., 1997; Buoninsegni et al., 1998; Knoll et al., 2000; Krysinski et al., 2001; Lang et al., 1994; Lingler et al., 1997; Naumann et al., 1995; Peggion et al., 2001; Plant, 1999; Zebrowska et al., 2002) to surfaces of metal electrodes such as mercury or gold. Lipids and proteins in natural biological membranes are frequently exposed to static electric fields on the order of 107–108 V/m (Tsong and Astumian, 1988). A model membrane supported on a conductive substrate may be used to study voltage-gated membrane proteins and lipid-lipid and lipid-protein interactions (Jones, 1998; Olivotto et al., 1996; Terlau and Stuhmer, 1998). In addition, films of phospholipids with incorporated proteins deposited at a metal or metal oxide electrode find application in the development of bioelectrochemical sensors (Sackmann, 1996; Naumann et al., 1999, 2002). Despite quite a broad interest in the properties of model membranes supported on conductive surfaces, little is known about how the electric field applied to the metal surface affects the structure of phospholipid bilayers.
Herein, we demonstrate that a phospholipid bilayer deposited onto a gold electrode surface can be exposed to static electric fields comparable to that acting on a natural biological membrane. The model system studied in this work is a mixed dimyristoylphosphatidylcholine/cholesterol bilayer (70:30 mol % ratio) formed on a gold surface by fusion and spreading of small unilaminar vesicles. The addition of cholesterol to a lipid film leads to a much more fluid bilayer (Oldfield and Chapman, 1972) that spreads more readily on gold surfaces (M. Li, U. Retter, and J. Lipkowski, unpublished material). To further facilitate the fusion and spreading of the vesicles we performed these experiments at 30°C, where the membrane is in the liquid-crystalline state. By combining electrochemistry with neutron reflectivity we investigated the effect of the static electric field on the structure of the bilayer. Neutron reflectometry has been used successfully in the past to reveal the structure of phospholipid bilayers deposited on a quartz or silicon (e.g., Johnson et al., 1991; Koenig et al., 1996; Majewski et al., 1998; Wong et al., 1999) or tethered to a gold (Krueger et al., 2001; Majkrzak et al., 2000; Meuse et al., 1998) surface. The novelty of our approach lies in performing the neutron reflectivity experiments in situ using a gold-coated quartz block assembled in an electrochemical cell (Burgess et al., 2001, 2003; Zamlynny et al., 2000). In this way, the potential applied to the gold surface is controlled during the neutron reflectivity experiment. We also show that the charge density at the gold surface covered by the phospholipid bilayer can be determined. Consequently, by changing the potential applied to the electrode, the charge density on the gold surface and hence the field acting on the membrane can be used as a variable in our experiments. This approach allowed us to quantitatively investigate the effect of the electric field on the stability, thickness, and water content in the membrane.
EXPERIMENTAL PROCEDURES
Preparation of dimyristoylphosphatidylcholine/cholesterol vesicles
Vesicles were prepared by the method described by Barenholz et al. (1977). Solutions of dimyristoylphosphatidylcholine (DMPC, Avanti Polar Lipids, Birmingham, AL) and cholesterol (99+%, Sigma-Aldrich, St. Louis, MO) in chloroform (99.9+%, Sigma-Aldrich) were combined in a test tube to form a 7:3 (DMPC/cholesterol) mole fraction mixture. The solvent was evaporated to dryness by vortexing the mixture under a stream of argon. Complete removal of the chloroform was achieved by placing the test tube in a vacuum desiccator for a minimum of 2 h. The DMPC/cholesterol mixture was stored, under vacuum, in this state until the commencement of the neutron reflectivity (NR) and electrochemical experiments. A sufficient volume of electrolyte solution was then added to the tube to give an ∼1–2 mg/mL solution. Vesicles were formed by sonicating the solution for 120 min at 40°C. All electrochemical and neutron reflectivity measurements were made at a temperature of 30°C.
Electrochemistry
The working electrode used in the ex situ electrochemical experiments was an Au(111) single crystal, prepared in-house as described elsewhere (Richer and Lipkowski, 1985). Before electrochemical measurements, the electrode was flame-annealed, quenched with water and introduced to a glass cell containing de-aerated, supporting electrolyte. 50 mM NaF was chosen because this salt does not lead to any ions that show specific adsorption on gold electrodes. Chloride-containing salts were avoided as chloride strongly adsorbs to gold over a wide range of potentials complicating electrochemical analysis of the DMPC/cholesterol film (Shi and Lipkowski, 1996). A flame-annealed, coiled gold wire served as the counter electrode. Ionic conductivity between the main cell and a second cell containing a saturated calomel reference electrode (SCE) was achieved via a salt bridge. The working electrode was employed in the hanging meniscus configuration to ensure that only the (111) face was in contact with the electrolyte. Cyclic voltammetry was used to measure the cleanliness of the electrochemical cell before the addition of vesicles. A PAR model 173 potentiostat and PAR model 5206 lock-in amplifier (Princeton Applied Research, Oak Ridge, TN) were interfaced with a personal computer via an RC Electronics (Santa Barbara, CA) or National Instruments (Austin, TX) data acquisition board. In-house software was used to collect the differential capacity and chronocoulometric (charge density) data. To record the differential capacity curves, a 25 Hz, 5 mV (root mean square), AC perturbation was superimposed on a 5 mV/s DC voltage sweep.
The following method was used to obtain the charge density data. The gold electrode was held at a base potential, Eb = −850 mV, for 30 s. Then the potential was stepped to a variable potential of interest, Ef, where the electrode was held for a time, tf, which is sufficiently long to establish a state of adsorption equilibrium (tf for the experiments involving DMPC/cholesterol vesicles was 120 s). A potential step to the desorption potential Edes = −1.25 V vs. SCE was than applied. The current transient corresponding to the lifting of the bilayer and recharging of the interface was recorded during 200 ms and the potential was stepped back to Eb. To enhance transport of vesicles to the electrode surface the solution was stirred. The stirring was interrupted 10 s before the potential step from Ef to Edes was applied. The integration of the current transients gives the difference between charge densities at potentials Ef and Edes. Similar experiments were performed at the electrode in a solution without the vesicles. The absolute charge densities were then calculated using the independently determined potential of zero charge (pzc), Epzc = 255 mV vs. SCE. This method has been described in much more detail elsewhere (Richer and Lipkowski 1985; Lipkowski and Stolberg, 1992).
Neutron reflectivity
Neutron reflectivity (NR) experiments were carried out on the NG-7 reflectometer at the National Institute of Standards and Technology in Gaithersburg, Maryland. The working electrodes were derived from polished single-crystal quartz substrate obtained from CrysTec GmbH (Berlin, Germany).
Thin layers of chromium and gold were sequentially sputtered on the substrates using the following procedure. The quartz crystals were placed on a rotating carousel in a two-target (Cr and Au) sputtering chamber. The chamber was evacuated, using a turbomolecular pump to a pressure of 10−6 Torr or less. Once vacuum was achieved, both the Cr and Au targets were presputtered to remove possible surface contaminants. Without quenching the sputtering plasma, the quartz crystal was rotated into the path of the Cr target where it was coated at a rate of 299 Å/min for ∼5 s. The carousel was then rotated such that the chromium-coated quartz was in the path of the gold target's plasma for ∼15 s. The rate of gold deposition was 450 Å/min.
Before cell assembly and neutron reflectivity measurements, the coated crystals were degreased with ethanol, irradiated in an ultraviolet chamber (Jelight, Thief River Falls, MN) for 20 min to oxidize any organic contaminants and then rinsed with Milli-Q (Millipore, Billerica, MA) water (>18 MΩ). The irradiation procedure was repeated until the substrate was uniformly hydrophilic. A stream of purified argon was then used to dry the water from the gold surface.
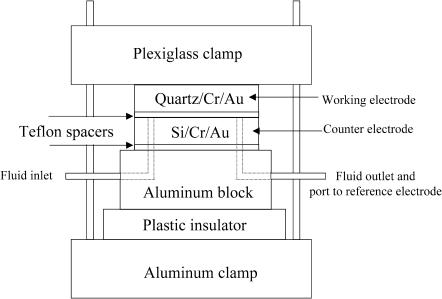
Two types of cells were used in the NR experiments. The work with hydrogenated DMPC was performed in a thin electrolyte-layer cell configuration, schematically shown in Fig. 1, where the counter electrode was a gold-coated silicon wafer of the same approximate dimensions as the working electrode. This substrate was cleaned in the same fashion as the working electrode. After cleaning, the crystals were assembled to form the electrochemical cell with an acid-washed, 500-μm-thick Teflon gasket used as a spacer between the gold faces of the quartz and silicon electrodes. For the experiments involving deuterated DMPC, a large Teflon cell was prepared with a gold foil counter electrode. This larger cell enabled us to more thoroughly remove oxygen from the electrolyte yielding better electrochemistry. A schematic drawing of this cell configuration has been previously published (Zamlynny et al., 2000). Incoherent scattering from the thicker layer of electrolyte did not significantly raise the background levels when the Teflon cell was used.
FIGURE 1.
Schematic of the electrochemical cell configuration used in the neutron reflectivity experiments.
The vesicle solutions were prepared in 50 mM NaF with either D2O at 99.9% (Sigma) or H2O (Milli-Q) serving as the solvent. After introducing the vesicle solution into the cell, the reference electrode (Ag/AgCl, E = −40 mV vs. SCE) was placed in the filling arm leading into the electrochemical cell.
Varying the angle of incidence,θ, allowed reflectivities to be measured in the Qz range of ∼0.0 up to 0.20 Å−1 (Qz = 4π sin θ/λ, where θ is the angle of incidence and λ is the wavelength of the neutrons). A fixed neutron wavelength of 4.75 Å was used. Typical counting times, including background measurements, were 8–10 h. The reflected neutrons were counted using a 3He detector. The data were reduced taking into account the neutron beam transmission through the quartz substrate and corrected for the background. The error points on the data represent the statistical errors in the measurements (standard deviation). A constant instrumental resolution of ΔQz/Qz = 0.043 was used throughout the scan.
To extract structural information from the reflectivity data the reflectivities were analyzed using an iterative, dynamic method (Parratt, 1954). Based on known facts about the system (the thickness of the gold and chromium layers and the anticipated structure of the organic layer at the interface) a model scattering length density (SLD) profile was generated and used to calculate the reflectivity curve. The calculated reflectivities were then compared to the experimental data. A least-squares iterative procedure was then used to vary the parameters of the SLD profile until a good fit between the calculated curve and the experimental data was achieved using the PARRATT 32 fitting algorithm (Braun, 1999) and the MLAYER algorithm developed at the National Institute of Standards and Technology (Ankner and Majkrzak, 1992). The goodness of the fit was evaluated by summing the squares of the difference between the experimental and theoretical R(Qz) curves for every data point. This summation was divided by the total number of data points to give χ2. Uncertainties for the best-fit SLD and thickness values were calculated from the experimental errors using the method described in Press et al. (1992).
Although, the inversion of the reflectivity data is not unique and the SLD profile calculated from the reflectivity curve is not the only mathematical function that fits the reflectivity curve, with the help of additional information about the investigated system, we can usually reconstruct the SLD profile for the interface with a high level of confidence.
To reduce the number of adjustable parameters it is critical to determine a portion of the structural information from an independent experiment. In our case, the thickness, roughness, and the SLD of chromium and gold layers sputtered onto the quartz crystals were determined independently by measuring the x-ray reflectivity of the crystals in air. In addition, the possibility exists that these parameters may be altered by the electrochemistry. To minimize the uncertainty in our data analysis we characterized our substrates using x-ray reflectometry before and after the electrochemical neutron reflectometry experiments.
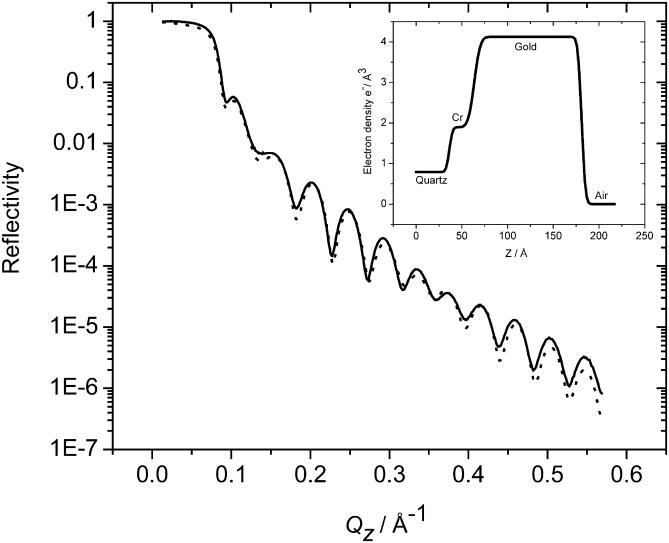
Fig. 2 shows both the experimental and fitted x-ray reflectivity curves for the experiments before the electrochemical experiments. The curve obtained for the crystal after the in situ electrochemical measurements was nearly identical to that shown in Fig. 2, demonstrating that the Cr and Au layers remain essentially unaffected by the electrochemistry. The inset to Fig. 2 shows the electron density (as determined from the real component of the scattering length densities) as a function of the distance normal to the electrode's surface. From these data the parameters for the Cr and Au layers were determined as summarized in Table 1. The electron densities determined from the x-ray data for the chromium and gold layers are very close to the theoretical values for bulk Cr and Au. This shows that the films formed by the sputter deposition technique were almost defect-free. The differences between the fit parameters for the chromium and gold layers determined before and after the experiment were small.
FIGURE 2.
X-ray reflectivity as a function of momentum transfer vector for the Au/Cr-covered quartz block. Curve corresponds to the measurement made before electrochemistry. The curve for the postelectrochemical measurement is essentially identical and is omitted for clarity. The dotted line represents the results of the modeling. The inset shows the electron density profile for the model that best fits the data.
TABLE 1.
Summary of the parameters describing the modified quartz substrate obtained from fitting the measured x-ray reflectivity data shown in Fig. 1
| Quartz
|
Chromium
|
Gold
|
||||||
|---|---|---|---|---|---|---|---|---|
| e− Density* [e− Å−3] | σ† [Å] | e− Density* [e− Å−3] | τ‡ [Å] | σ† [Å] | e− Density* [e− Å−3] | τ‡ [Å] | σ† [Å] | |
| Before | 0.79 (±0.1) | 2.8 | 1.88 (±0.06) | 27.3 (±1.1) | 5.2 | 4.11 (±0.11) | 117.4 (±1.5) | 3.2 |
| After | 0.79 (±0.1) | 3.1 | 2.03 (±0.10) | 26.0 (±2.3) | 5.3 | 4.35 (±0.13) | 119.2 (±1.7) | 3.4 |
The theoretical electron densities of Quartz, Cr, and Au are 0.79, 1.97, and 4.36 respectively.
Electron density.
Roughness of the layer.
Thickness of layer.
Two strategies were used to fit the reflectivity curves for the film-covered electrodes. We initially fit all the measured reflectivity curves by assuming that the SLD, thickness, and roughness of the gold and chromium layers were unaffected by changing the electrode potential and equal to the values determined for the crystals in air. In addition, the roughness of the organic layer was assumed to be equal to the roughness of the gold layer. In this procedure, the only adjustable parameters were the thickness and the SLD of the organic film. In a second approach, the SLD and the thickness of the organic layer determined from the first fitting procedure and the data for the chromium and gold layers determined for the crystals in air were used as initial values in a multiparameter fit in which all parameters were allowed to vary to reach the minimum of the χ2 function. Although the second procedure gave a better fit to the data, the differences between the fit parameters for the organic film obtained by the two procedures were small.
RESULTS AND DISCUSSION
Electrochemistry
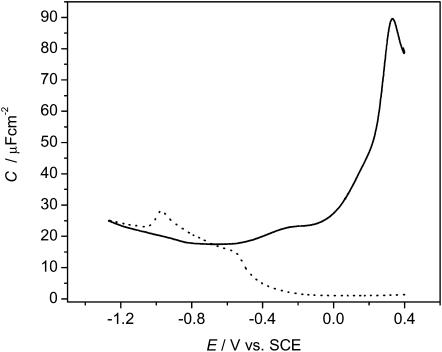
The spreading of vesicles onto the Au(111) electrode surface was initially characterized using electrochemical techniques. Fig. 3 shows the differential capacity curves for electrode potentials between −1250 mV and +400 mV vs. SCE. The positive potential is limited by surface oxidation of gold whereas the onset of hydrogen evolution defines the negative potential maximum. Between these potential extremes, the electrode-solution interface behaves as a capacitor. As shown by the dotted line in Fig. 3, the addition of vesicles to the electrochemical cell significantly decreases the interfacial capacitance, indicating that the vesicles fuse to the gold surface. The capacitance, reaches its lowest value of ∼2 μF cm−2 in a range of potentials between −100 mV < E < 400 mV. The expected capacitance for a defect-free bilayer film is ∼0.8 μF cm−2 (Guidelli et al., 2001). A higher-than-expected value of the capacity indicates that the phospholipid film spread from the vesicles is not defect-free and probably contains an amount of solvent molecules.
FIGURE 3.
Differential capacitance curves obtained for a Au(111) single crystal using an AC perturbation of 5 mV, 25 Hz for 50 mM NaF only (———), and vesicles of a 7:3 mixture of DMPC and cholesterol in 50 mM NaF (- - - -).
In the region of E between −400 mV < E < −100 mV, the capacitance slowly begins to rise when the potential is scanned negatively. Similar behavior was observed by Bizzotto et al. (1999) for insoluble surfactant films spread at the Au(111) solution interface. These studies demonstrated that the gradual increase of capacitance is caused by the electroporation of the film driven by increasing strength of the electric field when the potential is scanned in the negative direction. It is expected that a similar process is operative in the current study.
For potentials more negative than ∼−700 mV the capacitance rises above the supporting electrolyte. The film begins to detach from the electrode surface. The detachment is responsible for the appearance of the maximum on the capacity curve. However, the capacity in the presence of the organic molecules merges with that of the pure electrolyte only at potentials more negative than −1200 mV vs. SCE. This behavior suggests that the film remains in close proximity to the surface until these very negative potentials are reached. We also note that, at the Au(111) electrode, the differential capacity maxima are much smaller than maxima observed for the spreading/detachment of phospholipid films on a mercury electrode (Bizzotto et al., 1999; Stauffer et al., 2001). This behavior indicates that on gold the field-driven phase transitions are quite slow.
The field acting on the membrane deposited at the gold electrode surface may be estimated from knowledge of the surface charge density and the Gauss theorem,
 |
(1) |
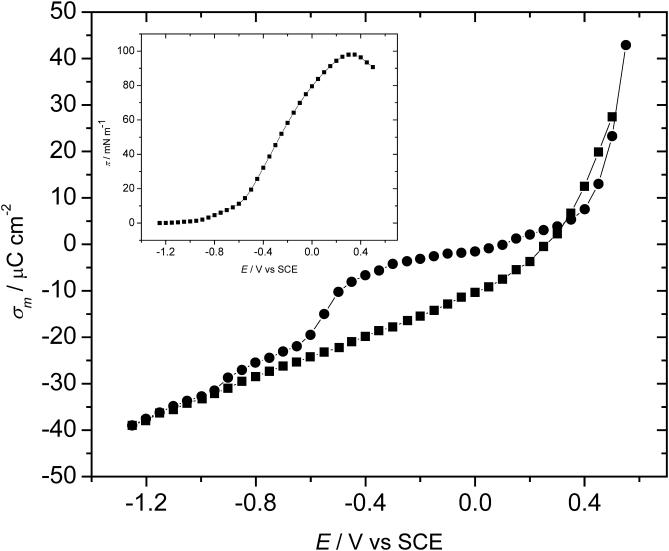
where ɛ is the permittivity. Therefore, chronocoulometric experiments have been performed to determine the charge density. Fig. 4 plots the charge at the Au electrode for the bilayer-free (pure supporting electrolyte) and the bilayer-coated surface as a function of the applied potential. Apparently, the membrane is stable at the electrode when the surface's charge density is in the range of ±8 μC cm−2. Outside of this region, the charge density curve for the membrane-covered electrode abruptly rises or falls to merge with the charge density curve for the film-free surface at high charge densities. This behavior indicates that the membrane becomes detached from the gold surface. Using Eq. 1, one can determine that a charge density of 8 μC cm−2 corresponds to a field of ∼5 × 10⁸ V/m. The membrane is therefore stable when exposed to fields less than this value and is detached from the metal by higher electric fields.
FIGURE 4.
The surface charge density on the gold electrode surface plotted versus the electrode potential for ▪, the background (50 mM NaF supporting electrolyte), and •, the mixed 7:3 DMPC/cholesterol bilayer spread from the vesicle solution. (Inset) The surface pressure versus electrode potential plot as calculated from the charge density data.
To appreciate the significance of these numbers it is instructive to compare the charge on the metal to the charge present at the surface of a natural biological membrane. A natural membrane has between 10 and 20 mol % of anionic phospholipids and this corresponds to one negative charge per 300 Å2 of the membrane surface (Gennis, 1989) or ∼5 μC cm−2. The charge densities on the surface of a natural membrane and the charge acting on a neutral model membrane deposited at the gold electrode surface are therefore comparable. The field applied at the supported membrane closely mimics the inherent electric field existing across a natural membrane. In our experiments, the electrode potential is the operational variable that is controlled by an instrument, while charge is the physical variable that determines the electric field acting on the membrane. As Fig. 4 shows, electrochemistry provides a unique opportunity to apply and quantify static electric fields acting on a model biological membrane.
The area between the charge density curves for the supporting electrolyte and the electrolyte containing DMPC/cholesterol vesicles corresponds to the surface pressure of the bilayer (lowering of the surface energy due to the presence of the membrane) which can be calculated using the equation (Lipkowski and Stolberg, 1992),
 |
(2) |
where γ0 and γ are the surface energies and σM and σM0 are the charge densities in the absence and presence of vesicles in the solution, respectively. The surface pressure curve is shown in the inset to Fig. 4. It quantitatively describes the energetics associated with the spreading of the vesicles into a membrane at the metal-solution interface. The surface pressure plot is bell-shaped with a maximum of ∼98 mN m−1 at E ≈ 300 mV. At potentials close to the potential of zero charge, the surface pressure is large and hence the bilayer is very stable at the electrode surface. However, the surface pressure decreases in a quasiparabolic fashion with potential. This behavior shows that charging the metal leads to a significant decrease in the film pressure and consequently a decrease in the membrane's stability at the interface.
Neutron reflectometry
Herein we describe the first neutron reflectivity studies of a model membrane exposed to high electric fields and we demonstrate the uniqueness of this technique to determine the field-driven changes of membrane structure. Neglecting roughness, the intensity of neutrons reflected from the interface can be described by Als-Neilson and Kjaer (1989), Penfold and Thomas (1990), and Hillman et al. (1998) as
 |
(3) |
in which the first term (proportional to  ) describes Fresnel reflectivity from a single interface and the second term is proportional to the square of the Fourier transform of the scattering-length density (SLD or ρ) profile in the direction normal to the surface. The SLD depends on the number density of the scatterer (nj) according to the formula
 |
(4) |
where bj is the scattering length. Hence the SLD profile maps the density of scatterers in the direction normal to the surface. The SLD for gold, hydrogen, and deuterium are distinctly different and a strong contrast is achieved when a film of hydrogenated phospholipids is deposited at a gold electrode surface from a solution of D2O. In such a case, the thickness of the bilayer and the water content in the bilayer may be determined from SLD curves.
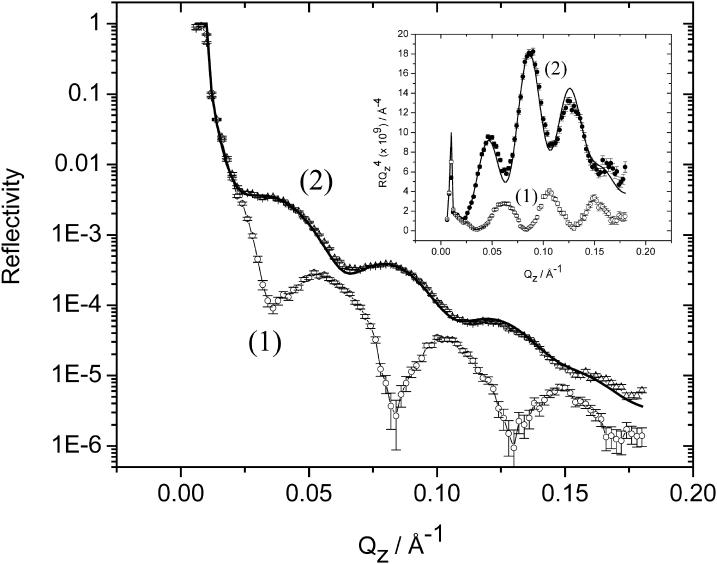
To mimic the charge acting on a natural membrane, the charge density was varied gradually from ∼−1 to −30 μC cm−2. Curve 2 in Fig. 5 shows the reflectivity curve (plot of log R vs. Qz) for the membrane formed by fusing mixed DMPC-cholesterol vesicles at the gold electrode at E = 50 mV and charge density ∼−1 μC cm−2. For comparison, curve 1 shows the reflectivity curve recorded at the gold-coated quartz electrode in D2O in the absence of bilayer. The reflectivity is significantly higher in the presence of vesicles, indicating that vesicles fused and formed a membrane at the gold surface. The data show that reflectivities could be measured with good statistics down to ∼2 × 10⁻⁶ and Qz = 0.18 Å−1.
FIGURE 5.
Experimentally determined reflectivity curves (points with associated error bars) for E = 50 mV in 50 mM NaF in D2O. (Curve 1) The film-free electrode surface. (Curve 2) The electrode covered by a bilayer of the 7:3 mixture of h-DMPC and cholesterol. (Inset) Plot of RQ4 vs. Qz calculated from the data presented in the main section of this figure. Solid line shows the calculated reflectivity curves from the best-fit model whose parameters are given in Tables 2 and 3.
The reflectivity decreases quickly with Qz due to the Fresnelian  term (see Eq. 2). To compensate for this decay it is convenient to multiply the reflectivity by
  . The inset of Fig. 5 plots the
  vs. Qz data. This representation is particularly convenient to show how the square of the Fourier transform of the SLD changes in a given series of experiments. The high frequency fringes (having a period of ∼0.04 Å−1) seen both in curves 1 and 2 are due chiefly to the interference between neutrons reflected from the two sides of the thin film of gold. In the presence of the bilayer, the interference between neutrons reflected from the fronting and backing sides of the membrane can be seen in curve 2 of the inset as a single fringe with a period ∼0.2 Å−1. The low frequency fringe envelops the high frequency oscillations due to the gold film. The amplitude of this fringe depends on the contrast between the SLDs of the bilayer and its neighboring phases (gold on one side and the D2O solution on the other) whereas the period of the fringe depends on the bilayer thickness.
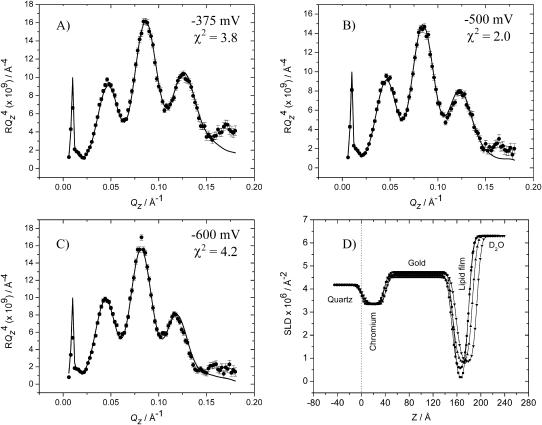
Fig. 6 A shows the  plot for an additional potential within the region of the minimum on the differential capacity curves (for E = −375 mV and σM = −6.1 μC cm−2). In addition Fig. 6 B shows the
  vs. Qz plot for potential E = −500 mV and σM = −10.2 μC cm−2 just when the differential capacity jumps to higher values. Fig. 6 C shows the reflectivity curve for E = −600 mV and σM = −19.5 μC cm−2 just above the minimum on the differential capacity curve. Fig. 6 D shows the SLD profiles determined from the best fit of the model to the reflectivity data. A single layer of hydrogenated molecules deposited directly on the metal surface were assumed in these calculations. This fit requires a limited number of adjustable parameters. However, it averages SLDs for the head and tail regions.
FIGURE 6.
(A–C) RQ4 vs. Qz plots for a bilayer of the 7:3 mixture of h-DMPC and cholesterol in 50 mM NaF in D2O; (A) at E = −375 mV; (B) at E = −500 mV; and (C) at E = −600 mV. Points with associated error bars show the experimental data. Solid lines show the reflectivity calculated from the parameters obtained from the fitting procedure. (D) The SLD profiles for the interface for E = 50 mV (▪); E = −375 mV (•); E = −500 mV (▴); and E = −600 mV (▾). The best-fit model parameters corresponding to the SLD profiles are listed in Tables 2 and 3.
To extract more detailed information concerning the membrane, the same reflectivity data were fit to a three-layer model assuming that the membrane consists of two 8 Å-thick polar head regions and a middle section composed of hydrogenated acyl chains. Although the three-layer model is physically more realistic and statistically gives a slightly better fit to the experimental data, it involves at least four additional adjustable parameters. The contrast for the polar head region and the backing gold or D2O phases is weak. In addition, the resolution of NR experiments at π/Qz,max = 17 Å was insufficient to resolve an 8 Å-thick polar head region in the SLD profile. Finally, the SLD profiles calculated for a single layer film allowing for adjustable roughness of the film were very close to the SLD profiles calculated for the three-layer model of the film. For all these reasons we considered the single layer to be a sufficient approximation. The thickness and the SLD values for the acyl chain region of the membrane, determined from the fit to the single layer model, are compiled in Table 3. The corresponding parameters for the Cr and Au layers are given in Table 2.
TABLE 3.
Best-fit results describing the mixed DMPC-cholesterol bilayer deposited at the electrode surface as a function of the applied potential
| Organic layers
|
||||||||
|---|---|---|---|---|---|---|---|---|
| Water layer
|
Lipid/cholesterol layer
|
|||||||
| System (E vs. SCE) | τ* | SLD† | Vol. % of solvent | σ‡ | τ* | SLD† | Vol. % of solvent | σ‡ |
| h-DMPC + chol (E = 50 mV) | N/A | N/A | N/A | N/A | 25.6 ± 0.9 | 0.03 ± 0.22 | 0.08 | 5.6 |
| h-DMPC + chol (E = −375 mV) | N/A | N/A | N/A | N/A | 29.3 ± 1.0 | 0.51 ± 0.12 | 0.15 | 5.9 |
| h-DMPC + chol (E = −500 mV) | N/A | N/A | N/A | N/A | 32.8 ± 1.0 | 0.82 ± 0.18 | 0.19 | 6.3 |
| h-DMPC + chol (E = −600 mV) | N/A | N/A | N/A | N/A | 35.3 ± 0.7 | 0.85 ± 0.17 | 0.20 | 6.8 |
| h-DMPC + chol (E = −700 mV) | 4.1 ± 0.2 | 5.38 ± 0.40 | 0.86 | 6.1 | 35.8 ± 0.7 | 0.05 ± 0.20 | 0.08 | 5.4 |
| h-DMPC + chol (E = −800 mV) | 6.0 ± 1.4 | 6.33 ± 0.41 | 1.00 | 5.5 | 37.0 ± 0.9 | −0.43 ± 0.32 | 0.01 | 5.6 |
| h-DMPC + chol (E = −950 mV) | 10.1 ± 1.0 | 6.28 ± 0.32 | 1.00 | 5.3 | 36.8 ± 0.8 | −0.51 ± 0.19 | 0.00 | 5.8 |
| d-DMPC + chol (E = −800 mV) | 10.4 ± 1.3 | −0.56 ± 0.21 | 1.00 | 2.1 | 37.2 ± 1.0 | 5.22 ± 0.28 | 0.05 | 4.1 |
TABLE 2.
Shows the parameters describing the chromium and gold layers of the modified quartz substrate as a function of the applied electrode potential
| Chromium
|
Gold
|
|||||
|---|---|---|---|---|---|---|
| System (potential vs. SCE) | τ* | SLD† | σ‡ | τ* | SLD† | σ‡ |
| h-DMPC + chol (E = 50 mV) | 38.2 ± 2.2 | 3.34 ± 0.06 | 3.2 | 115.7 ± 1.4 | 4.73 ± 0.05 | 5.9 |
| h-DMPC + chol (E = −375 mV) | 38.3 ± 2.8 | 3.37 ± 0.07 | 5.6 | 112.7 ± 1.6 | 4.59 ± 0.02 | 4.3 |
| h-DMPC + chol (E = −500 mV) | 39.5 ± 2.5 | 3.34 ± 0.06 | 6.6 | 112.9 ± 1.6 | 4.51 ± 0.02 | 3.7 |
| h-DMPC + chol (E = −600 mV) | 39.1 ± 2.2 | 3.35 ± 0.05 | 6.6 | 116.5 ± 1.5 | 4.66 ± 0.06 | 6.1 |
| h-DMPC + chol (E = −700 mV) | 38.2 ± 1.9 | 3.24 ± 0.06 | 2.7 | 116.8 ± 1.3 | 4.64 ± 0.05 | 5.0 |
| h-DMPC + chol (E = −800 mV) | 38.2 ± 2.4 | 3.24 ± 0.08 | 2.7 | 116.8 ± 1.4 | 4.64 ± 0.07 | 5.0 |
| h-DMPC + chol (E = −950 mV) | 38.4 ± 2.0 | 3.42 ± 0.05 | 2.7 | 114.0 ± 1.5 | 4.70 ± 0.04 | 4.8 |
| d-DMPC + chol (E = −800 mV)§ | 42.4 ± 2.9 | 3.40 ± 0.05 | 6.5 | 194.1 ± 1.7 | 4.40 ± 0.07 | 6.6 |
The parameters were obtained from the best-fit results of the measured neutron reflectivity curves shown in Figs. 5–7.
Thickness of layer in Å.
Scattering length density × 106 Å−2.
Roughness in Å.
The measurements involving deuterated DMPC were not performed on the same gold-coated quartz crystal as the measurements involving the h-DMPC.
The results show that the thickness of the film formed at +50 mV is equal to ∼26 Å. This number is significantly smaller than the thickness of the bilayer, determined by x-ray diffraction for the hydrated liquid crystalline state of DMPC at 30°C to be ∼35.5 Å (Janiak et al., 1979). The smaller thickness for the bilayer supported at the electrode surface suggests that acyl chains of DMPC molecules assume a larger tilt angle with respect to the surface (bilayer) normal.
The scattering length density of the lipid layer was determined to be 0.22 × 10⁻⁶ Å−2. The SLD for the lipid layers is dominated by the cholesterol and lipid tails. The theoretical scattering length densities for cholesterol and the lipid tail can be calculated from the densities and the molecular formulae of the cholesterol and hydrocarbons and give values of 0.28 × 10⁻⁶ Å−2 and −0.5 × 10⁻⁶ Å−2, respectively. X-ray diffraction studies (Franks, 1976) have shown that cholesterol embeds itself in the lipid layer by essentially occupying the same volume as the two tails of one phospholipid molecule. Using this model, one can determine the theoretical scattering length density of the 7:3 mixture of DMPC and cholesterol to be equal to −0.36 × 10⁻⁶ Å−2.
The SLD for the organic layer was then used to determine the occupancy of phospholipid and cholesterol at the electrode surface assuming that the modeled layer contains only the deuterated solvent and the hydrogenated adsorbate. The total SLD of the layer (ρtotal) is, therefore, given by the equation
 |
(5) |
where ρorg and  are the scattering length densities of the organic and solvent material, respectively, and x is the volume fraction of hydrocarbon in the film. The value for
  is known (6.3 × 10⁻⁶ Å−2) and the value for ρorg was estimated above. Using these values, the lipid tail/cholesterol material is calculated to comprise 91% of the layer, implying that the phospholipid film contains some amount of solvent. This result is in good agreement with our electrochemical measurements, which show that the capacitance of the film-covered electrode at +50 mV is equal to ∼2 μF cm−2 and is higher than the capacity of a perfect bilayer estimated to be 0.8 μF cm−2.
The values for the best-fit parameters of the NR data obtained for potentials between +50 mV and −600 mV exhibit an interesting trend. As the potential applied to working electrode becomes increasingly negative the phospholipid/cholesterol layer thickness increases by nearly 28% with a significant concomitant increase in the SLD. This thickening of the phospholipid layer can be attributed to a swelling of the organic layer by ingress of progressively larger amounts of solvent molecules with decreasing electrode potential. The result from the reflectometry experiment is in accordance with the electrochemical observations. Fig. 3 shows that the differential capacitance shows a steady increase as the potential is scanned between +50 mV and −600 mV. Further, most of this change takes place between potentials −500 and −600 mV, where one observes a significant increase of the differential capacity. An increase in the penetration of water molecules into the film is expected to cause an increase of the capacitance consistent with the neutron reflectometry data.
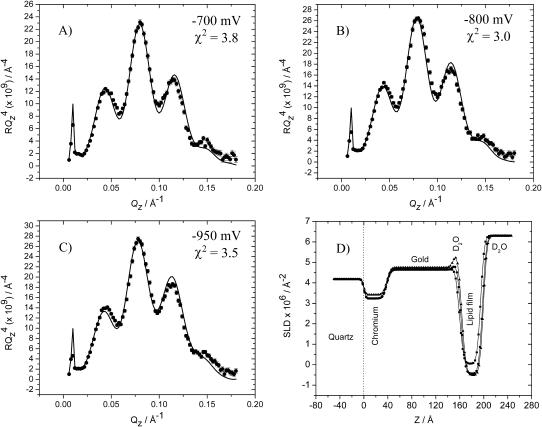
The reflectivity data for E = −600 mV gave quite a surprising result. The electrochemical data suggest that the bilayer is desorbed from the electrode surface at this potential. In contrast, the neutron reflectivity measurements show that the bilayer swells and incorporates more solvent but still remains at the metal surface. To understand this behavior, additional experiments have been performed by applying even more negative potentials. Fig. 7, A–C, plot the  vs. Qz curves for E equal to −700, −800, and −950 mV and the corresponding charge densities −23.1, −25.5, and −31.5 μC cm2, respectively. Clearly, the reflectivity of the electrode surface remains very high indicating that the bilayer remains near the electrode surface even at these negative potentials.
FIGURE 7.
(A–C) RQ4 vs. Qz plots for a bilayer of the 7:3 mixture of h-DMPC and cholesterol in 50 mM NaF in D2O, (A) at E = −700 mV; (B) at E = −800 mV; and (C) at E = −950 mV. Points with associated error bars show the experimental data. Solid lines show the reflectivity calculated from the parameters obtained from the fitting procedure. (D) The SLD profiles for the interface for E = −700 mV (▪); E = −800 mV (•); and E = −950 mV (▴). The best-fit model parameters corresponding to the SLD profiles are listed in Tables 2 and 3.
Fig. 7 D plots the SLD profiles determined from the best fit of a model to the reflectivity curves shown in Fig. 7, A–C. A simple one-box description of the adsorbed layer was inadequate. To achieve a better fit, an additional box was introduced. The parameters for the two-box model fit are listed in Table 2. The result of the fitting reveals that the box directly adjacent to the gold surface consists of a film a few Ångstroms thick having a very high scattering length density. Moving the potential in the negative direction, the thickness of this box increases and its SLD reaches a limiting value very close to that of pure D2O. The second box is much thicker (∼37 Å) and has a much lower SLD. It should be noted that the SLD profiles shown in Fig. 7 D are convoluted by each layer's roughness parameter. The effect of the roughness is to “smear-out” the SLD profiles depicted in Fig. 7 D, which makes the interstitial water layer appear less pronounced, particularly for the curve representing E = −700 mV. Admittedly, the fitting analysis of the reflectivity curves for E = −700 mV and E = −800 mV give water thicknesses that fall below the roughness. This problem is even more acute for E = −600 mV, where electrochemical experiments show that the film is desorbed from the electrode surface although no evidence of a water layer separating the film from the metal surface could be extracted from the NR data. However, the model fitting is only satisfactory with introduction of the thin layer of high SLD between the gold and organic layers, an observation strongly supported by the measurement at E = −900 mV where a thicker layer of water is observed. When the electrode's surface is covered by a thin layer of solvent the phospholipid/cholesterol molecules are now contained in a ∼37 Å-thick layer with a SLD equal to −0.5 ± 0.3 × 10⁻⁶ Å−2, which corresponds to the solvent-free layer. Apparently, the bilayer that is separated from the metal surface by a thin layer of solvent at negative potentials has less solvent than the bilayer in direct contact with the gold surface at E > −600 mV. Further, at these negative potentials, the thickness of the film is comparable to the thickness of the bilayer measured in hydrated multilayers of DMPC by x-ray scattering (Janiak et al., 1979) and with the thickness of a DMPC bilayer supported on quartz determined by neutron reflectivity (Lα-phase, above 24°C, τ = 36.1 Å (Wong et al., 1999).
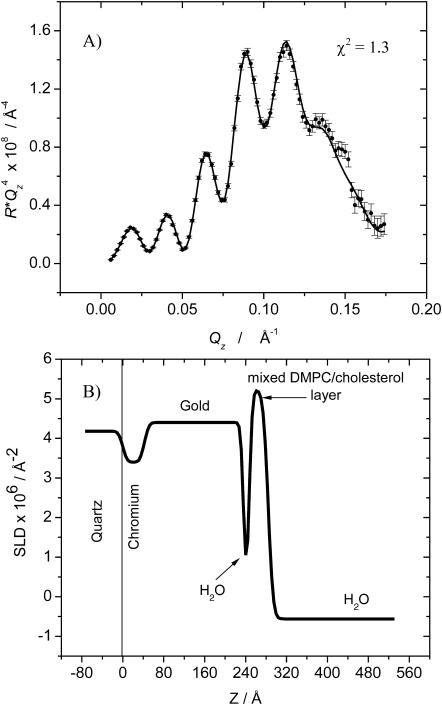
In an effort to further verify the validity of our observation of a solvent cushion layer at negative potentials, we repeated the neutron reflectivity measurements for E = −800 mV using a different isotopic contrast. The bilayer was formed by fusion of vesicles prepared from perdeuterated DMPC mixed with hydrogenated cholesterol (the cost of perdeuterated cholesterol was prohibitive) and the solvent was H2O. Fig. 8 A shows the  vs. Qz curve for this system and Fig. 8 B plots the SLD profile determined from the fit to the data shown as a solid line in Fig. 8 A. The result confirms that the bilayer is separated from the gold surface by ∼10 Å film of water at this negative potential. The bilayer is 38 ± 1 Å thick and the SLD for the bilayer is, within the experimental error, equal to the theoretical value of the SLD calculated for the water-free film estimated to be 5.5 × 10⁻⁶ Å−2. The good agreement between the results of neutron reflectivity experiments performed using hydrogenated and deuterated DMPC gives credibility to the SLD profiles calculated from the reflectivity curves. Unfortunately, due to beam time limitations we were unable to measure reflectivity curves using the deuterated lipid film for all the potentials investigated with the fully hydrogenated system.
FIGURE 8.
(A) RQ4 vs. Qz plot for a bilayer of the 7:3 mixture of d-DMPC and cholesterol in 50 mM NaF in H2O at E = −800 mV. Points with associated error bars show the experimental data. Solid line shows the reflectivity calculated from the SLD profile presented in B. The best-fit model parameters corresponding to the SLD profile are listed in Tables 2 and 3.
SUMMARY AND CONCLUSIONS
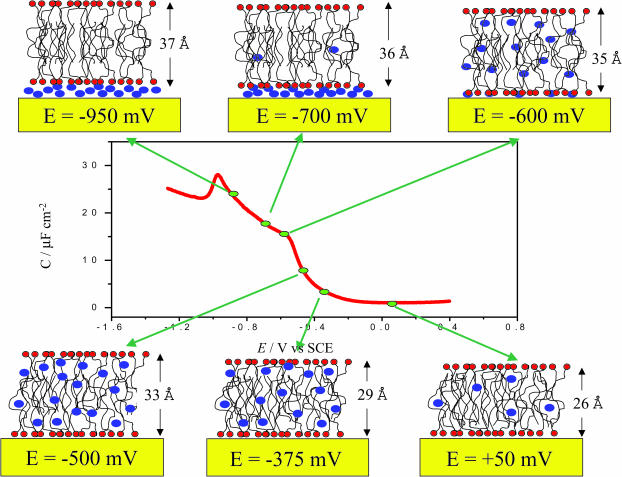
We have provided a detailed description of the effect of the electric field on the structure of a model biological membrane supported at an electrode surface. The main results of this work are summarized pictorially in Fig. 9. We would like to emphasize that Fig. 9 is not a model but rather a cartoon representation of the DMPC/cholesterol film which is consistent with the analysis of the specularly neutron reflectivity data. Our analysis does not provide us with information about the lateral distribution of individual solvent molecules nor does it provide us with sufficient resolution to give details concerning the fine structure of the film in the direction perpendicular to the gold surface due to a limited maximum Qz. The analysis of specularly reflected neutrons provides a compositional profile, in the direction normal to the film, averaged over the transverse coherence length of the incident neutrons, which for the range of momentum transfer vectors accessed in these measurements spans roughly between 10 and 100 μm. As long as the dimension of the lateral inhomogeneities is less than the coherence length of the incident neutrons then the measured reflectivity curve accurately probes the area-averaged interface (Majkrzak et al., 2000). As such, the water molecules shown incorporated in the biological films in Fig. 9 qualitatively represent the volume fraction of water inside the lipid film but they do not represent the precise location or distribution of the solvent molecules. However, when the water exists as a discrete, uniform layer, as is the case for negative electrode potentials, neutron reflectivity analysis can accurately place the slab of water within the overall SLD profile of the entire interface. This is a unique advantage of neutron reflectivity as no other technique can probe buried structures in soft materials.
FIGURE 9.
Pictorial description of the changes in the structure of the mixed DMPC-cholesterol bilayer deposited at the electrode surface as a function of the applied potential. We emphasize that this figure is not intended as a model of the biomimetic film. Note that the bilayer is in equilibrium with vesicles in the solution.
We have demonstrated that a model biological membrane supported at a metal surface is stable when the charge on the metal is <−8 μC cm−2 or the field acting at the membrane is <5 × 10⁸ V/m. At zero charge on the metal the acyl chains are tilted at a large angle with respect to the surface normal. The membrane is thin and contains defects. By charging the metal and increasing the field, the chains become less tilted. The membrane swells, becoming thicker and incorporating more water. When σM < −8 μC cm−2 and the field exceeds 5 × 10⁸ V/m, the membrane starts to detach from the electrode. We have shown for the first time that this membrane remains in close proximity to the metal electrode, being suspended on a thin cushion of the electrolyte. This membrane is essentially defect-free. In fact, at high negative charges, the membrane structure resembles the structure of a DMPC bilayer supported on a quartz surface (Johnson et al., 1991; Wong et al., 1999) where a 10–20 Å thick layer of water also separates the phospholipids from the surface of the solid support. When in contact with an aqueous solution, a quartz surface is negatively charged having a charge density of ∼−20 μC cm−2 when the solution pH is ∼8 (Ong et al., 1992). It is therefore not surprising that the properties of the membrane supported at a negatively charged gold surface are similar to that of a membrane supported on a quartz surface.
The fact that the charge-potential curve for the membrane-coated surface merges with the curve for the membrane-free interface at high negative charges indicates that the capacity of the electrode with the membrane supported on a cushion of the solvent and the membrane-free electrode have comparable magnitude. This behavior indicates that the layer of solvent that separates the membrane from the metal contains ions of the electrolyte, which effectively screen the charge on the metal. Despite the fact that the charge on the metal is high, the field acting on the membrane is greatly attenuated by the electrolyte ions in the thin layer of solvent. In reality, both at charge −1 μC cm−2 and at very negative charges, the field acting on the membrane is weak. The dramatic difference between the membrane structure at σM ∼ −1 and σM = −25 μC cm−2 is due chiefly to the presence or absence of the D2O layer at the gold surface.
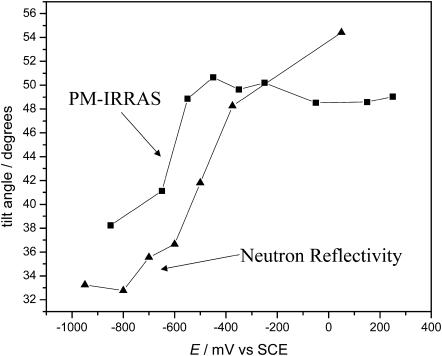
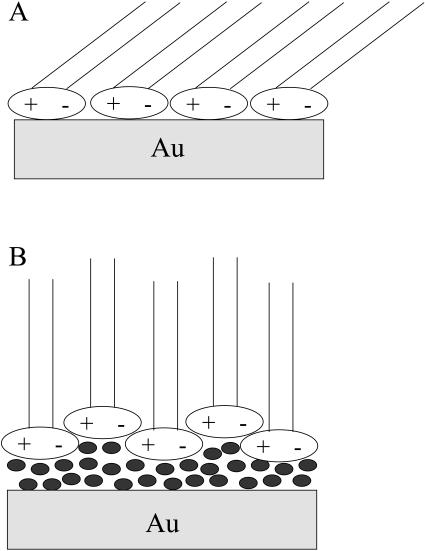
The data in Table 2 show that the thickness of the membrane significantly changes with the charge on the metal. This behavior indicates that the chain tilt changes with charge. Following Janiak et al. (1979) and Tristram-Nagel et al. (2002), the bilayer thickness data can be used to estimate the angle. When the membrane is deposited directly at the metal the chains are tilted 55° with respect to the surface normal. At high negative charges, when the membrane is lifted from the metal and is suspended on a cushion of D2O, the tilt angle decreases to 35°. As shown in Fig. 10, these numbers agree within 5°, which is within the limit of experimental uncertainties of the two methods, with recent IR studies of a DMPC/cholesterol bilayer at a gold surface (X. Bin, I. Zawisza, S. Horswell, and J. Lipkowski, unpublished material). The fact that similar tilt angles can be determined from the measurements of totally different physical properties can be used as a strong argument that, despite limited resolution, NR experiments provide reliable values of the film thickness. A plausible explanation of the significant change of the bilayer thickness with potential may be given in terms of a change in the packing of the polar heads. When the bilayer is separated from the solid surface by a cushion of the solvent, the polar heads are packed in a zig-zag fashion that gives a minimum area per molecules as schematically shown in Fig. 11 A (Hauser et al., 1981). When the bilayer is adsorbed at the metal surface all polar heads tend to interact with the metal. Consequently, the area per molecule increases and as Fig. 11 B shows, the chains are forced to assume a more tilted orientation.
FIGURE 10.
Comparison of the change in hydrocarbon tilt angle as a function of the electrode potential for a mixed DMPC/cholesterol (7:3) film spread on a gold electrode surface from a vesicle solution. The tilt angles were measured in the present work using neutron reflectivity (▴), and independently evaluated (X. Bin, I. Zawisza, S. Horswell, and J. Lipkowski, unpublished material) from IR results (▪).
FIGURE 11.
Schematic representation of packing of the DMPC molecules, (A), at E < −600 mV, where the bilayer is suspended on a cushion of solvent, and (B), at E > −500 mV, where the bilayer is directly adsorbed at the metal surface (adopted from Hauser et al., 1981).
The charge-driven changes in the membrane structure are fully reversible. By turning a knob on a control instrument one can inject or withdraw the charge from the metal surface. The membrane responds to these changes by either lifting up or depositing directly on the metal. The ability to use the electric field to control the membrane structure opens new opportunities for biomimetic research.
Acknowledgments
We express our gratitude to Dr. Zin Tun for many helpful discussions.
This work was funded by a Natural Sciences and Engineering Research Council grant. I.B. also thanks the Natural Sciences and Engineering Research Council for postgraduate funding. J.L. acknowledges the Canadian Foundation for Innovation for a Canadian Research Chair. Los Alamos Neutron Scattering Center at the Los Alamos National Laboratory is funded by the U.S. Department of Energy under contract W-7405-ENG-36.
References
- Als-Neilson, J., and K. Kjaer. 1989. X-ray reflectivity and diffraction studies of liquid surfaces and surfactant monolayers. In Phase Transitions in Soft Condensed Matter. T. Riste and D. Sherrington, editors. Plenum Press, New York. 113–138.
- Ankner, J. F., and C. F. Majkrzak. 1992. Subsurface profile refinement for neutron specular reflectivity. In S.P.I.E. Conference Proceedings, Vol. 1738. C. F. Majkrzak and J. L. Wood, editors. S.P.I.E., Bellingham, WA.
- Barenholz, Y., D. Gibbes, and B. J. Litman. 1977. A simple method for the preparation of homogeneous phospholipids vesicles. Biochemistry. 16:2806–2810. [DOI] [PubMed] [Google Scholar]
- Bayerl, T. M., and M. Bloom. 1990. Physical properties of single phospholipid bilayers adsorbed to micro glass beads. Biophys. J. 58:357–362. [DOI] [PMC free article] [PubMed] [Google Scholar]
- Bizzotto, D., and A. Nelson. 1998. Continuing electrochemical studies of phospholipids monolayers of dioleoyl phosphatidylcholine at the mercury-electrolyte interface. Langmuir. 14:6269–6273. [Google Scholar]
- Bizzotto, D., V. Zamlynny, I. Burgess, C. A. Jeffrey, H. Q. Li, J. Rubinstein, Z. Galus, A. Nelson, B. Pettinger, A. R. Merill, and J. Lipkowski. 1999. Amphiphilic and ionic surfactants at electrode surfaces. In Interfacial Electrochemistry, Theory, Experiment and Applications. A. Wieckowski, editor. Marcel Dekker, New York. 405–426.
- Brian, A. A., and H. M. McConnell. 1984. Allogeneic stimulation of cytotoxic T cells by supported planar membranes. Proc. Natl. Acad. Sci. USA. 81:6159–6163. [DOI] [PMC free article] [PubMed] [Google Scholar]
- Braun, C. 1999. The Reflectivity Tool. Parratt 32. HMI, Berlin, Germany.
- Buoninsegni, F. T., R. Herrero, and M. R. Moncelli. 1998. Alkanethiol monolayers and alkanethiol vertical bar phospholipids bilayers supported by mercury: an electrochemical characterization. J. Electroanal. Chem. 452:33–42. [Google Scholar]
- Burgess, I., V. Zamlynny, G. Szymanski, J. Lipkowski, J. Majewski, G. Smith, S. Satija, and R. Ivkov. 2001. Electrochemical and neutron reflectivity characterization of dodecyl sulfate adsorption and aggregation at the gold-solution interface. Langmuir. 17:3355–3367. [Google Scholar]
- Burgess, I., V. Zamlynny, G. Szymanski, J. Lipkowski, M. Majewski, and S. Satija. 2003. Neutron reflectivity studies of field driven transformations in a monolayer of 4-pentadecyl pyridine at an Au electrode surface. J. Electroanal. Chem. 550:187–199. [Google Scholar]
- Cornell, B. A., V. L. B. Braach-Maksvytis, L. G. King, P. D. Osman, J. Raguse, L. Wieczorek, and R. J. Pace. 1997. A biosensor that uses ion-channel. Nature. 387:580–583. [DOI] [PubMed] [Google Scholar]
- Franks, N. P. 1976. Structural analysis of hydrated egg lecithin and cholesterol bilayers. I. X-ray diffraction. J. Mol. Biol. 100:345–358. [DOI] [PubMed] [Google Scholar]
- Gennis, R. B. 1989. Biomembranes, Molecular Structure and Function. Springer-Verlag, New York. Chapt. 7.
- Guidelli, R., G. Aloisi, L. Becucci, A. Dolfi, M. R. Moncelli, and F. T. Bouninsegni. 2001. Bioelectrochemistry at metal-water interfaces. J. Electroanal. Chem. 504:1–28. [Google Scholar]
- Hauser, H., I. Pascher, R. H. Pearson, and S. Sundell. 1981. Preferred conformation and molecular packing of phosphatidylethanolamine and phosphatidylcholine. Biochim. Biophys. Acta. 650:21–51. [DOI] [PubMed] [Google Scholar]
- Horswell, S. L., V. Zamlynny, H. Q. Li, A. R. Merrill, and J. Lipkowski. 2002. Electrochemical and PM IRRAS studies of potential controlled transformations of phospholipid layers on Au(111) electrodes. Faraday Discuss. 121:405–422. [DOI] [PubMed] [Google Scholar]
- Hillman, A. R., P. M. Saville, A. Glidle, R. M. Richardson, S. J. Roser, M. J. Swann, and J. R. P. Webster. 1998. Neutron reflectivity determination of buried electroactive interface structure: PBT/PPy and PBT/PXV bilayers. J. Am. Chem. Soc. 120:12882–12890. [Google Scholar]
- Janiak, M. J., D. M. Small, and G. G. Shipley. 1979. Temperature and compositional dependence of the structure of hydrated dimyristoyl lecithin. J. Biol. Chem. 254:6068–6078. [PubMed] [Google Scholar]
- Johnson, S. J., T. M. Bayerl, D. C. McDermott, G. W. Adam, A. R. Rennie, R. K. Thomas, and E. Sackmann. 1991. Structure of an adsorbed dimyristoylphosphatidylcholine bilayer measured with specular reflection of neutrons. Biophys. J. 59:289–294. [DOI] [PMC free article] [PubMed] [Google Scholar]
- Jones, S. W. 1998. Overview of voltage-dependent calcium channels. J. Bioenerg. Biomembr. 30:299–312. [DOI] [PubMed] [Google Scholar]
- Knoll, W., C. W. Frank, C. Heibel, R. Naumann, A. Offenhaeuser, J. Ruehe, E. K. Schmidt, W. W. Shen, and A. Sinner. 2000. Functional tethered lipid bilayers. Rev. Mol. Biotechnol. 74:137–146. [DOI] [PubMed] [Google Scholar]
- Koenig, B. W., S. Krueger, W. J. Orts, C. F. Majkrzak, N. F. Berk, J. V. Silverton, and K. Gawrisch. 1996. Neutron reflectivity and atomic force microscopy studies of a lipid bilayer in water adsorbed to the surface of a silicon single crystal. Langmuir. 12:1343–1350. [Google Scholar]
- Krueger, S., C. W. Meuse, C. F. Majkrzak, J. A. Dura, N. F. Berk, M. Tarek, and A. L. Plant. 2001. Investigation of hybrid bilayer membrane with neutron reflectometry: probing the interaction of melittin. Langmuir. 17:511–521. [Google Scholar]
- Krysinski, P., A. Zebrowska, A. Michota, J. Bukowska, L. Becucci, and M. R. Moncelli. 2001. Tethered mono- and bi-layer lipid membranes on Au and Hg. Langmuir. 17:3852–3857. [Google Scholar]
- Lang, H., C. Duschl, and H. Vogel. 1994. A new class of thiolipids for attachment of lipid bilayer on gold. Langmuir. 10:197–210. [Google Scholar]
- Leonenko, Z. V., A. Carnini, and D. T. Cramb. 2000. Supported planar bilayer formation by vesicle fusion: the interaction of phospholipids vesicles with surfaces and the effect of gramicidin on bilayer properties using atomic force microscopy. Biochim. Biophys. Acta. 1509:131–147. [DOI] [PubMed] [Google Scholar]
- Lingler, S., I. Rubinstein, W. Knoll, and A. Offenhausser. 1997. Fusion of small unilamellar lipid vesicles to alkanethiol and thiolipid self-assembled monolayers on gold. Langmuir. 13:7085–7091. [Google Scholar]
- Lipkowski, J., and L. Stolberg. 1992. Molecular adsorption at gold and silver electrodes. In Adsorption of Molecules at Metal Electrodes. J. Lipkowski and P. N. Ross, editors. VCH, New York. 171–238.
- Majewski, J., J. Y. Wong, C. K. Park, M. Seitz, J. N. Israelachvili, and G. S. Smith. 1998. Structural studies of polymer-cushioned lipid bilayers. Biophys. J. 75:2363–2367. [DOI] [PMC free article] [PubMed] [Google Scholar]
- Majkrzak, C. F., N. F. Berk, S. Krueger, J. A. Dura, M. Tarek, D. Tobias, V. Silin, C. W. Meuse, J. Woodward, and A. L. Plant. 2000. First principle determination of hybrid bilayer membrane structure by phase-sensitive neutron reflectometry. Biophys. J. 79:3330–3340. [DOI] [PMC free article] [PubMed] [Google Scholar]
- Meuse, C. W., S. Kruger, C. F. Majkrzak, J. A. Dura, J. Fu, J. T. Connor, and A. L. Plant. 1998. Hybrid bilayer membranes in air and water: infrared spectroscopy and neutron reflectivity studies. Biophys. J. 74:1388–1398. [DOI] [PMC free article] [PubMed] [Google Scholar]
- Miller, I. R. 1981. Structural and energetic aspects of charge transport in lipid layers and in biological membranes. In Topics in Biochemistry and Bioenergetics. G. Milazzo, editor. Wiley, New York.
- Naumann, R., A. Jonczyk, R. Kopp, J. van Esch, H. Ringsdorf, W. Knoll, and P. Graeber. 1995. Incorporation of membrane-proteins in solid supported lipid layers. Angew. Chem. Int. Ed. 34:2056–2058. [Google Scholar]
- Naumann, R., E. K. Schmidt, A. Jonczyk, K. Fendler, B. Kadenbach, T. Liebermann, A. Offenhaeuser, and W. Knoll. 1999. The peptide-tethered lipid membrane as a biomimetic system to incorporate cytochrome c oxidase in a functionally active form. Biosens. Bioelectron. 14:651–662. [Google Scholar]
- Naumann, R., T. Baumgart, P. Graeber, A. Jonczyk, A. Offenhaeusser, and W. Knoll. 2002. Proton transport through a peptide-tethered bilayer lipid membrane by H+-ATP synthase from chloroplasts measured by impedance spectroscopy. Biosens. Bioelectron. 17:25–34. [DOI] [PubMed] [Google Scholar]
- Nelson, A., and A. Benton. 1986. Phospholipid monolayers at the mercury-water interface. J. Electroanal. Chem. 202:253–270. [Google Scholar]
- Nelson, A., and F. A. M. Leermakers. 1990. Substrate-induced structural changes in electrode-adsorbed lipid layers: experimental evidence from the behaviour of phospholipids layers on mercury-water interface. J. Electroanal. Chem. 278:73–83. [Google Scholar]
- Nelson, A., and D. Bizzotto. 1999. Chronoamperometric study of Tl(I) reduction at gramicidin-modified phospholipid-coated mercury electrodes. Langmuir. 15:7031–7039. [Google Scholar]
- Oldfield, E., and D. Chapman. 1972. Dynamics of lipids in membranes: heterogeneity and the role of cholesterol. FEBS Lett. 23:285–297. [DOI] [PubMed] [Google Scholar]
- Olivotto, M., A. Arcangeli, M. Carla, and E. Wanke. 1996. Electric fields at the plasma membrane level: a neglected element in the mechanisms of cell signaling. Bioessays. 18:495–504. [DOI] [PubMed] [Google Scholar]
- Ong, S., X. Zhao, and K. B. Eisenthal. 1992. Polarization of water molecules at a charged interface: second harmonic studies of the silica/water interface. Chem. Phys. Lett. 191:327–335. [Google Scholar]
- Peggion, C., F. Formaggio, C. Toniolo, L. Becucci, M. R. Moncelli, and R. Guidelli. 2001. A peptide-tethered lipid bilayer on mercury as a biomimetic system. Langmuir. 17:6585–6592. [Google Scholar]
- Penfold, J., and R. K. Thomas. 1990. The application of the specular reflection of neutrons to the study of surfaces and interfaces. J. Phys. Condens. Matt. 2:1369–1412. [Google Scholar]
- Plant, A. L. 1999. Supported hybrid bilayer membranes as rugged cell membrane mimics. Langmuir. 15:5128–5135. [Google Scholar]
- Parratt, L. G. 1954. Surface studies of solids by total reflection of x-rays. Phys. Rev. Lett. 952:359–369. [Google Scholar]
- Press, W. H., S. A. Teukolsky, W. T. Vetterling, and B. P. Flannery. 1992. Numerical Recipes in C, Chapt. 15. Cambridge University Press, New York.
- Richer, J., and J. Lipkowski. 1985. Measurement of physical adsorption of organic species at solid electrodes. J. Electrochem. Soc. 133:121–128. [Google Scholar]
- Sackmann, E. 1996. Supported membranes. Scientific and practical applications. Science. 271:43–48. [DOI] [PubMed] [Google Scholar]
- Schmidt, A., J. Spinke, T. Bayerl, E. Sackmann, and W. Knoll. 1992. Streptavidin binding to biotinylated lipid layers on supports. Biophys. J. 63:1385–1390. [DOI] [PMC free article] [PubMed] [Google Scholar]
- Shi, Z., and J. Lipkowski. 1996. Chloride adsorption at the Au(111) electrode surface. J. Electroanal. Chem. 403:225–239. [Google Scholar]
- Stauffer, V., R. Stoodly, J. O. Agak, and D. Bizzotto. 2001. Adsorption of DOPC onto Hg from the G|S interface and from a liposomal suspension. J. Electroanal. Chem. 516:73–78. [Google Scholar]
- Stoodley, R., and D. Bizzotto. 2003. Epi-fluorescence microscopic characterization of potential-induced changes in a Hg drop coated with a DOPC monolayer. Analyst. 128:552–561. [DOI] [PubMed] [Google Scholar]
- Terlau, H., and W. Stuhmer. 1998. Structure and function of voltage-gated ion channels. Naturwissenschaften. 85:437–444. [DOI] [PubMed] [Google Scholar]
- Tristram-Nagel, S., Y. Liu, J. Legleiter, and J. F. Nagel. 2002. Structure of gel phase DMPC determined by x-ray diffraction. Biophys. J. 83:3324–3335. [DOI] [PMC free article] [PubMed] [Google Scholar]
- Tsong, T. Y., and R. D. Astumian. 1988. Electroconformational coupling: how membrane-bound ATPase transduces energy from dynamic electric field. Annu. Rev. Physiol. 50:273–290. [DOI] [PubMed] [Google Scholar]
- Williams, L. M., S. D. Evans, T. M. Flynn, A. Marsh, P. F. Knowles, R. J. Bushby, and N. Boden. 1997. Kinetics of the unrolling of small unilamellar phospholipid vesicles onto self-assembled monolayers. Langmuir. 13:751–757. [Google Scholar]
- Wong, J. Y., J. Majewski, M. Seitz, C. K. Park, J. N. Israelachvili, and G. S. Smith. 1999. Polymer-cushioned bilayers. I. A structural study of various preparation methods using neutron reflectometry. Biophys. J. 77:1445–1457. [DOI] [PMC free article] [PubMed] [Google Scholar]
- Zamlynny, V., I. Burgess, G. Szymanski, J. Lipkowski, J. Majewski, G. Smith, S. Satija, and R. Ivkov. 2000. Electrochemical and neutron reflectivity studies of spontaneously formed amphiphilic surfactant bilayer at the gold-solution interface. Langmuir. 16:9861–9870. [Google Scholar]
- Zebrowska, A., P. Krysinski, and Z. Lotowski. 2002. Electrochemical studies of blocking properties of solid supported tethered lipid membranes on gold. Bioelectrochemistry. 56:179–184. [DOI] [PubMed] [Google Scholar]


