

Abstract
The evolution of water dynamics from dilute to very high concentration solutions of a prototypical hydrophobic amino acid with its polar backbone, N-acetyl-leucine-methylamide (NALMA), is studied by quasi-elastic neutron scattering (QENS) and molecular dynamics (MD) simulation for both the completely deuterated and completely hydrogenated leucine monomer. The NALMA-water system and the QENS data together provide a unique study for characterizing the dynamics of different hydration layers near a prototypical hydrophobic side chain and the backbone of which it is attached. We observe several unexpected features in the dynamics of these biological solutions under ambient conditions. The NALMA dynamics shows evidence of de Gennes narrowing, an indication of coherent long timescale structural relaxation dynamics. The translational and rotational water dynamics at the highest solute concentrations are found to be highly suppressed as characterized by long residential time and slow diffusion coefficients. The analysis of the more dilute concentration solutions models the first hydration shell with the 2.0 M spectra. We find that for outer layer hydration dynamics that the translational diffusion dynamics is still suppressed, although the rotational relaxation time and residential time are converged to bulk-water values. Molecular dynamics analysis of the first hydration shell water dynamics shows spatially heterogeneous water dynamics, with fast water motions near the hydrophobic side chain, and much slower water motions near the hydrophilic backbone. We discuss the hydration dynamics results of this model protein system in the context of protein function and protein-protein recognition.
INTRODUCTION
There is an emerging effort to characterize water and its role as the “twenty-first” amino acid in the broader context of protein folding and function and as mediator for protein-protein interactions (Bellissent-Funel, 2000; Bellissent-Funel et al., 1992; Bizzarri and Cannistraro, 2002; Careri and Peyrard, 2001; Dellerue and Bellissent-Funel, 2000; Denisov and Halle, 1996; Denisov et al., 1999; Halle and Denisov, 1995; Mattos, 2002; Otting, 1997; Tarek and Tobias, 1999, 2000, 2002; Zanotti et al., 1999). In addition to structure and thermodynamics, a wide range of experimental techniques including femtosecond spectroscopy (Pal et al., 2002), x-ray and neutron scattering (Svergun et al., 1998), O17 and H1 NMR dispersion techniques (Denisov and Halle, 1996; Denisov et al., 1999; Halle and Denisov, 1995; Mattos, 2002; Otting, 1997), quasielastic neutron scattering (Bellissent-Funel, 2000; Dellerue and Bellissent-Funel, 2000; Diehl et al., 1997; Marchi et al., 2002; Russo et al., 2003; Zanotti et al., 1997, 1999), and accompanying interpretation and analysis using molecular dynamics (Bizzarri and Cannistraro, 2002; Merzel and Smith, 2002; Tarek and Tobias, 1999, 2000, 2002) have been used to probe hydration dynamics near protein interfaces.
Experimental limitations for studying molecular events in the dynamics of protein water hydration arise from several factors. The highly dilute protein concentrations (required to avoid aggregation) used means that the hydration water dynamics are dominated by bulk water relaxation or diffusion timescales. In other cases the number of hydration waters or other specifics of their hydration sites cannot be directly measured or lack sufficient time resolution. Furthermore, unlike bulk water, or “crystal” waters that reside in specific locations in the protein interior, study of water dynamics near the protein is limited by the highly averaged information obtained over an inhomogeneous protein surface in various protein conformational states. We note that ∼50–60% of a folded protein's surface is hydrophobic (Janin, 1999). Thus, it is difficult to distinguish the contribution, for example, arising from a hydrophobic, hydrophilic, or aromatic site or between regions more or less exposed to the solvent. Russo et al. (2003) have controlled for this protein surface inhomogeneity by characterizing the dynamics of the first interacting water near a homogeneous hydrophobic oligopeptide that adopts a β-sheet conformation.
In this work we propose a complementary experimental quasielastic neutron scattering (QENS) and molecular dynamics simulation study of a greatly simplified protein model system that addresses some of these limitations. We consider the hydration water dynamics near N-acetyl-leucine-methylamide (NALMA), a hydrophobic amino acid side chain attached to a blocked polypeptide backbone, as a function of concentration between 0.5 and 2.0M. In previous work we have primarily focused on the structural organization of these peptide solutions and their connection to protein folding (Hura et al., 1999; Sorenson et al., 1999). Throughout the full concentration range of 0.5–2.0 M studied by x-ray scattering experiments and molecular dynamics simulations, we find that water stabilizes monodispersed and small clusters of amino acids, as opposed to more complete segregation of the hydrophobic monomers into a sequestered hydrophobic core (Hura et al., 1999; Sorenson et al., 1999), which defines the role of water in the later stages of folding. In this work we have performed QENS experiments on both the deuterated and nondeuterated leucine to isolate the hydration water dynamics from the solute motions. Furthermore, two sets of experiments were carried out using different incident neutron wavelengths to give two different time resolutions to separate rotational and translational motion of the hydration dynamics.
The NALMA-water system and the high quality QENS data provide a unique study for characterizing the dynamics of different hydration layers for a homogeneous solution of a hydrophobic side chain attached to its hydrophilic backbone. By analyzing the diffusion timescales at the highest concentration of 2.0 M, where our structural work indicates that NALMA solutes only have enough water to share one water hydration layer, and comparing it to more dilute concentrations of 0.5 M, where each solute has (in principle) enough water for ∼2–3 hydration layers of its own, permits us to cleanly separate inner sphere and outer sphere hydration dynamics, around a purely hydrophobic amino acid hydration site.
We report several unexpected features in the dynamics of these biological solutions under ambient conditions. The NALMA dynamics shows evidence of de Gennes narrowing, an indication of coherent long timescale structural relaxation dynamics that are tracked by the self-diffusion measured with QENS. The translational water dynamics of these biological solutions under ambient conditions are analyzed in a first approximation with a jump diffusion model and their rotation dynamics by diffusion on a sphere (Sears, 1996). At the highest solute concentrations, the hydration water dynamics is significantly suppressed and characterized by long residential time and slow diffusion coefficients, similar to supercooled water at −10°C. The analysis of the more dilute concentration solutions has been performed taking into account the result of the 2.0-M solution as a model of the first hydration shell. Subtracting the first hydration layer based on the 2.0-M spectra, the translational diffusion dynamics is still suppressed, although the rotational relaxation time and residential times are converged to bulk-water values.
The clean separation of rotational and translational timescales allows us to define an experimental “elastic incoherent structure factor” (EISF) from the rotational motion, which can be interpreted as a measure of the fraction of hydrogens whose rotational dynamics is faster or slower than our experimental resolution of 1.0–5.5 ps (Bellissentfunel et al., 1992; Zanotti et al., 1997). The EISF shows significant evolution between 0.5 and 2.0 M; the EISF for the 0.5 M solution measures 37% immobile hydrogen, whereas 17% of the protons are not observed for the 2.0 M concentration. The EISF results are supported by MD simulations, in which the highest concentration has fewer waters with longer rotational relaxation times than that observed for the lowest concentration. The MD results also measure specific first layer water residence times and rotational dynamics near hydrophobic and hydrophilic sites. We see spatially heterogeneous dynamics in that water near the hydrophilic backbone is ∼3–4 times slower than waters that reside near the hydrophobic side chain.
This study of the NALMA water solution, and future work that will analyze dynamics near homogeneous hydrophilic and aromatic amino acid monomers, provides an important dissection of hydration dynamics near inhomogeneous protein surfaces. We discuss the implications of the dynamics measured on our model system and its possible connection to supercooled liquids (Angell, 1995; Ediger et al., 1996; Green et al., 1994), protein function (Barron et al., 1997; Bellissent-Funel, 2000; Bizzarri and Cannistraro, 2002; Bu et al., 2000; Denisov et al., 1999; Tournier et al., 2003), and protein-protein interfaces (Bizzarri and Cannistraro, 2002).
EXPERIMENTAL PROCEDURES
The main contribution to the scattering cross section of the solution is the incoherent scattering from the protons, and therefore we can isolate the dynamics of the water in the presence of a hydrophobic amino acid by using a completely deuterated leucine solute. The incoherent quasielastic CD3 methyl contributions (30.75 barns) will be considered negligible with respect to one molecule of water contribution (160.4 barns), especially given the large atomic fraction difference between solute and water. The completely deuterated N-acetyl(d3)-leucine(d10)-methylamide(d3) (MW 202.25) was purchased from CDN Isotopes (Pointe-Claire, Quebec, Canada). The solution samples were obtained by dissolution of the completely deuterated amino acid powder in pure H2O at the following concentrations: 0.5 M, 1 M, 2.0 M, and 2.3 M. To remove aggregated or nondissolved powder from the solution, each sample was centrifuged (10 min at 10,000 × g) before measurement.
The quasielastic neutron scattering experiment was performed at the National Institute of Standards and Technology Center for Neutron Research, using the disk chopper time-of-flight spectrometer (DCS). To separate the translational and rotational components in the spectra, two sets of experiments were carried out using different incident neutron wavelengths of 7.5 Å and 5.5 Å to give two different time resolutions. The DCS spectrometer operating at the high-resolution range of λ = 7.5 Å with an incident energy of Einc = 1.45 meV, gives a wave vector range of 0.146 Å−1 < Q < 1.574 Å−1 and an energy resolution of 35 μeV at full width half-maximum (FWHM). At the lower resolution, λ = 5.5 Å and Einc = 2.7 meV, with the wave vector range covering 0.199 Å−1 < Q < 2.147 Å−1 with a FWHM of 81 μeV.
The sample containers were two concentric cylinders with radius differing by 0.1 mm for the Leu(D): H2O sample. All the spectra were measured at room temperature, and the data collection lasted for ∼6–10 h depending on the resolution and sample. The spectra were corrected for the sample holder contribution. Detector efficiencies, energy resolution, and normalization are measured with standard vanadium. The resulting data were analyzed with DAVE programs (http://www.ncnr.nist.gov/dave/). The data have been corrected for the buffer contribution, and we neglect the contribution from the structure factor in the analysis of the spectra.
Experimental analysis
The experimental quantity measured during a quasielastic neutron experiment is the differential cross section, defined as the number of neutrons with a transfer energy dE, scattered into a solid angle dΩ (Bee, 1988). The incoherent differential cross section can be experimentally determined as:
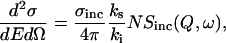 |
(1) |
where σ is the total incoherent cross section, ki and ks are the wave vector of the incident and scattered neutron, Q is the momentum transfer, ω is the frequency, and Sinc(Q,ω) is the incoherent dynamic structure factor. The fit to the experimental data generated at all resolutions used a combination of Lorentzian functions convoluted with the instrumental resolution. The success of the proposed experimental analysis procedure for the hydration dynamics lies in performing two identical experiments corresponding to two different resolutions. The high-resolution spectra better characterizes motion arising from translational water diffusion. In the other set of lower-resolution experiments, both translational and rotational contributions are significant. However, because the width of the sharp Lorentzian due to translation is previously determined with accuracy as a function of Q, it is introduced in the Lorentzian fit, favoring the evaluation of the other (rotational) parameters. The compatibility of the low-resolution fit with the high-resolution spectra is then cross-checked, and found to be consistent in our work. Based on those fits we were able to further interpret the data using the following analytical models traditionally applied to liquids (Bee, 2003).
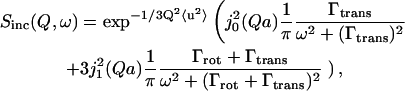
Sinc(Q,ω) can be expressed as a convolution of three terms:
 |
(2) |
each of which corresponds to a different kind of proton motion (Bee, 1988, 2003). The exponential term is the Debye-Waller factor, which represents the vibration in the quasielastic region; the <u2> term is the mean square displacement. The second and third terms are the translational and rotational incoherent dynamic structure factor, respectively.
The translational incoherent dynamic structure factor can be described as:
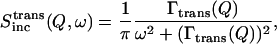 |
(3) |
where Γtrans is the halfwidth at half-maximum of a Lorentzian function (Bee, 1988). The Lorentzian is modeled by a random jump diffusion model, which considers the residence time τ0 for one site in a given network before jumping to another site (Egelstaff, 1992). In this case, the halfwidth at half-maximum of the Lorentzian in Eq. 3, will be described as
 |
(4) |
where the mean jump diffusion length L is defined in this model as  and Dtrans is the translational diffusion coefficient between two sites.
The simplest model of internal rotational motion of a molecule corresponds to a random motion of protons on the surface of a sphere (Sears, 1966). The rotational incoherent dynamic structure factor is:
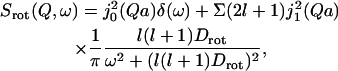 |
(5) |
where j1(Q) is a spherical Bessel function of order l; a is the radius of the sphere; and Drot is the rotational diffusion coefficient. For l = 1, which dominates the second term of Eq. 5, the halfwidth at half-maximum is Γrot = 2Drot, which corresponds to a rotational characteristic time of τRotation = 1/6Drot.
The first term in Eq. 5 corresponds to the form factor of the restricted volume explored by the hydrogen atoms, known as the “elastic incoherent structure factor.” Experimentally, the EISF is defined as Ielast(Q)/[Ielast(Q)+Iquasielast(Q)], where Ielast(Q) and Iquasielast(Q) are the integrated elastic and quasielastic scattering, respectively. This can be seen if we convolute Eq. 3 with Eq. 5 for l = 1 so that Eq. 2 becomes
 |
(6) |
where j02(Qa) is the EISF as defined in Eq. 5. In this particular case, where an elastic peak is not explicitly known, we can experimentally determine the EISF as Itranst(Q)/[Itranst(Q)+Irot+transt(Q)], where Itrans(Q) and Irot+trans(Q) are the experimental integrated intensity of the first and second term, respectively, in Eq. 6 (Russo et al., 2002). Based on the clean separation of rotational and translational motion of the hydration dynamics, we can define an experimental EISF, which is the elastic term of the rotation development (Russo et al., 2003a), and not the traditional form factor of confined diffusion movement more common for protein QENS.
Theoretical procedure
Analysis of the QENS experiments for aqueous NALMA solutions were aided by molecular dynamics simulations. Various representative solute configurations: dispersed, small molecular aggregates, and fully clustered as described in Hura et al. (1999). Solute configurations at all concentrations were prepared as maximally dispersed as described in Hura et al. (1999) and Sorenson et al. (1999). These configurations were equilibrated for 75 ps before any statistics were collected.
The AMBER force field due to Cornell et al. (1995) and the SPCE water models (Berendsen et al., 1987) were used for modeling the NALMA solute and water, respectively. The simulations were carried out at 298 K in the NVT-ensemble using velocity Verlet integration, velocity rescaling, with a time step of 1.5 fs. Each simulation was equilibrated for 0.1 ns and statistics were gathered over the remaining 0.65 ns, sampled every 100 fs. Ewald sums were used for calculation of the long-range Coulomb forces. κ was set to 6.4/L where L is the length of the simulation box and a total of 2 × 292 k-vectors were used (|kmax|2 = 26). Rigid-body dynamics for the water solvent were integrated using RATTLE (Anderson, 1983).
For the analysis of the water dynamics in the NALMA aqueous solutions, we performed simulations of a dispersed solute configuration consistent with our structural analysis (Hura et al., 1999; Sorenson et al., 1999). We used the Einstein relation to derive the translational self-diffusion coefficients from the mean square displacement of water oxygens, and the rotational dynamics using the orientational autocorrelation function:
 |
(7) |
where θ(t) measures the angle between the dipole vector of the water molecule at times t and 0. To analyze the EISF results, we also evaluated an average residence time of water molecules that maintained a distance of 4.0 Å or less from the branching carbon center of the hydrophobic side chain, and within 4.0 Å of one of the backbone carboxyl oxygens of the NALMA molecule. We also calculate the rotational dynamics of that subset of water molecules maintaining twice that residence time using Eq. 6.
RESULTS
NALMA solution structure
Recent x-ray diffraction experiments on aqueous solutions of NALMA performed by our research group (Hura et al., 1999; Sorenson et al., 1999) has shown that as the solute concentration increases the main diffraction peak of pure water shifts to a smaller Q-value and a new diffraction peak appears at Q = 0.8Å−1 (Fig. 1 a). The unaltered Q-value of the new peak position at the higher concentrations suggests that a stable and ordered leucine solute-solute distribution is sustained. Simulations of the spatial distribution of leucine in water at the matched experimental concentrations reproduce the experimental intensity profile (Fig. 1 b), and when analyzed show that water stabilizes maximally dispersed to small molecular aggregates of hydrophobic amino acids, as opposed to complete segregation of the hydrophobic solutes into one large cluster (Hura et al., 1999; Sorenson et al., 1999). This supports our hypothesis that a collapsed but water impregnated core could well be transferable into the context of late stages of folding of polypeptide chains (Sorenson et al., 1999). The observation of water impregnation late in folding, and the requirement of overcoming a desolvation barrier to reach the native state, has been observed in a large number of simulations (Cheung et al., 2002), including the refolding of a β-hairpin fragment of protein G (Pande and Rokhsar, 1999), and all-atom simulations of protein G (Sheinerman and Brooks, 1998), and src-SH3 (Shea et al., 2002).
FIGURE 1.

(a) X-ray scattering intensity curves for pure water and NALMA in water solutions at concentrations of solute to water of 1:25 and 1:50. The data have been scaled to the pure water scattering data of Nishikawa and Kitagawa (1980). (b) Simulated x-ray scattering intensity curves for pure water and NALMA in water at concentrations of solute to water of 1:24 and 1:47, with NALMAs maximally dispersed. The data are calculated on an absolute scale.
Most recently a small-angle neutron scattering experiment covering a Q-range between 0.008 Å−1 and 0.3 Å−1 using the small-angle spectrometer PAXE (Orpheé, France) was performed for NALMA in water over the same range of concentration. The log of the intensity of scattering (absolute units) as a function of the momentum transfer squared Q2 (Guinier plot) for different concentrations are represented in Fig. 2. The Guinier plot shows no appreciable slope at the lower concentrations of 0.5 M and 1.0 M, whereas for concentrations of 1.5 M and 2.0 M the Guinier plot shows a small slope consistent with the small size of a NALMA solute, and excluding the presence of NALMA aggregates formation (J. Teixeira, personal communication). Together the wide-angle and small-angle diffraction measurements provide the structural information complementary to analyze the QENS measurements of hydration and solute dynamics observed over the concentration range studied.
FIGURE 2.

The log of the small-angle intensity of scattering (absolute units) as a function of the momentum transfer squared Q2 (Guinier plot) for NALMA in water solutions at solute concentrations of 0.5 M, 1 M, 1.5 M, and 2.0 M.
Hydration water dynamics
To characterize the perturbation to water dynamics due to the presence of the NALMA solute at various concentrations, the scattering profile of the completely deuterated solute in H2O has been measured at both high and low resolutions, which allows us to separately resolve the rotational and translational dynamics. The compatibility of the fit for the two resolutions has been cross-checked against each other. Fig. 3 shows the dynamics incoherent structure factor spectrum, summed over all mean Q, measured at 35 μeV and at 81 μeV, for 0.5 M and 2.0 M NALMA concentration in H2O. The spectra are normalized to the maximum of the resolution function.
FIGURE 3.

The incoherent structure factor spectrum, summed over all mean Q, for 0.5 M (dotted line) and 2.0 M (dashed line) NALMA concentration in H2O measured at 35 μeV (top) and 81 μeV (bottom). The spectra are normalized to the maximum of the resolution function, which is represented by the bold line.
High-resolution experiment
The fit to the data generated at high resolution, which probes the slower components of hydration dynamics, required two Lorentzians. The narrow Lorentzian function describes the translational motion, whereas the broader Lorentzian describes faster movements that will be analyzed simultaneously with the low-resolution data. The translational dynamics is best described by a jump diffusion model based on the dependence of the narrow Γtrans(Q) with Q2 (Fig. 4) at all solute concentrations. The resulting diffusion coefficient, Dtrans, and residential time τ0 obtained for each concentration are reported in Table 1. It is evident that by increasing the NALMA concentration, the Γtrans(Q) exhibits an increasingly pronounced plateau at high Q-values, which translates to a longer residential time, whereas at the smallest Q-values the marginal slope reflects a smaller diffusion coefficient value. At the higher NALMA concentrations the dynamics are substantially suppressed, approaching values more typical of a supercooled water diffusion coefficient and corresponding long residential time. The corresponding molecular dynamics simulation quantities of Dtrans for water are in qualitative agreement with experimental trend over the entire concentration range studied (Table 1), although the MD evaluated diffusion constants are systematically slower than that derived from analytical fits to the experimental data.
FIGURE 4.

Halfwidth at half-maximum of the Lorentzian function, Γtrans(Q), plotted versus Q2 for the deuterated NALMA in H2O at high resolution for 0.5 M, 1 M, and 2.0 M NALMA concentration and for bulk water. The solid line is the fit based on the random jump model.
TABLE 1.
Experimental and simulation values (in parentheses) for NALMA and water dynamics as a function of NALMA concentration
| [NALMA] | 0.5 M | 1 M | 2.0 M |
|---|---|---|---|
| Dtrans NALMA (10−5 cm2/s) | 0.33 (0.13) | 0.36 | 0.31 (0.1) |
| Dtrans water (10−5 cm2/s) | 1.65 (1.3) | 1.26 | 0.75 (0.80) |
| τrotation (ps) | 1.0 (1.5) | 1.0 | 2.2 (2.25) |
| τo (ps) | 0.94 | 1.9 | 3.6 |
Translational diffusion coefficient, Dtrans for NALMA and water, the rotation time for water, τrotation, and the residence time of water based on the jump diffusion model, τo.
Given the evidence that the solution structural organization does not change over the concentration range of 0.5–2.3 M, a supplementary analysis can be performed for the lower concentration data. Assuming that the dynamics of the first hydration shell of ∼25 waters around the NALMA is completely described by the analysis of the 2.0-M data, it may be possible to characterize the dynamical behavior of the outer hydration sphere separately using the 1-M data. The analysis is comprised of subtracting the data with the 2.0-M translational linewidths as known values, leaving the remaining data to be fit by two free Lorentzian functions. In Fig. 5 a we show the new Γtrans inferred from this analysis in comparison with the 0.5-M and 1-M halfwidth obtained with the standard analysis. The new translational dynamics for 1.0 M is quite similar to the 0.5-M hydration water dynamics, with a translational diffusion coefficient of the same order of magnitude but with a longer residential time. In Fig. 5 b we show the reanalyzed 0.5-M data by taking into account the results of the 2.0-M data, exactly in the manner in which we reanalyzed the 1.0-M data. Together the 0.5-M and 1.0-M data results show that the translational dynamics of the outer sphere hydration layer(s) of water are in themselves perturbed from bulk-like water dynamics.
FIGURE 5.

Halfwidth at half-maximum, Γtrans(Q), of the Lorentzian function plotted versus Q2 for the deuterated NALMA in H2O at high resolution for (a) 1.0 M and (b) 0.5 M NALMA. The analysis is composed of subtracting the 2.0-M translational linewidths from the low-concentration data. By subtracting out the first hydration shell, the new translational dynamics for 1.0 M is quite similar to the 0.5-M hydration water dynamics, with a translational diffusion coefficient of the same order of magnitude but with a longer residential time.
Correlating the linewidth of the broader Lorentzian and its intensity dependence on Q, together with the intensity of the narrow Lorentzian, we attribute the large linewidths as arising from hydrogen rotation. For the 2.0-M data, Γrot is clearly independent of Q and shows small error. The Γrot is 0.1 meV for these highest concentrations, which corresponds to a rotational relaxation time of ∼2.2 ps, longer than that of bulk water and consistent with the suppressed translational dynamics seen for the high-concentration solutions. However, the linewidth of the broader Lorentzian for the 1.0-M and 0.5-M data gives a larger error in the fit to the intensity data, which therefore will be better analyzed with the low-resolution data.
Low-resolution experiment
The data from the low-resolution runs were analyzed by including the narrow translational Lorentzian functions based on the high-resolution experiment as known values. The remaining motion is due to rotation, and we plot the resulting Γrot as a function of concentration in Fig. 6. The characteristic Γrot of the hydration water at 2.0 M and 2.3 M measured at low resolution shows the proper lack of Q-dependence with an average value equal to 0.1 meV, a value that is consistent with the high-resolution analysis (Table 1). In this particular case, the best fit has been obtained by including a third Lorentzian function, the l = 2 term in Eq. 5; only when the data are of high quality can we resolve terms where l > 1.
FIGURE 6.

HWHM of the Lorentzian function, Γrot(Q), plotted versus Q2, for 0.5 M, 1 M, and 2.0 M NALMA concentration, corresponding to the rotational motions of protons, at different solute concentration.
Next we turn to the analysis of the low-concentration data. At 1.0 M and 0.5 M, the data were first analyzed by fitting the spectra with two Lorentzians. However, the inferred Γrot appears to increase for Q2 > 2.0, suggesting that a small translational component is present in the low-resolution data. In this case we introduce a third Lorentzian function, corresponding to the 2.0-M translational water dynamics, as a model of the first hydration shell at more dilute NALMA concentrations. Once the translational dynamics of the first hydration layer is subtracted, the remaining signal gives a broad linewidth that is independent of Q, with a mean value of 0.22 MeV for both the 1.0-M and 0.5-M data, which corresponds to a characteristic rotational relaxation time of 1 ps (Table 1). The intensity modeled in this way correctly gives translation and rotation functions that follow j0(Qa) and j1(Qa) behavior, respectively, whereas the intensity of the third Lorentzian is independent of Q with small amplitude. Again we see that molecular dynamics estimates of rotational dynamics qualitatively support the experimental values obtained over the full concentration range (Table 1).
Fig. 7 presents the hydration water EISF variation as a function of NALMA concentration. It is possible to estimate from the experimental EISF the fraction of hydration atoms that is rotationally “immobile”, i.e. hydrogen motions that are faster or slower than the experimental resolution (Bellissentfunel et al., 1992; Zanotti et al., 1997). In this experiment, the EISF is the elastic term of the rotational motion in Eq. 5, for which we only observe rotational motions on timescales between 1 and 5.5 ps. For the total intensity we do not take into account intensity arising from the translational motion analyzed from the 2.0-M contribution to the 1-M and 0.5-M spectra. The EISF shows a significant evolution between the 0.5-M and the 2.0-M concentrations. The EISF shows a significant evolution between the 0.5 M and the 2.0 M concentrations. At 0.5 M the percentage of immobile hydrogen is 37%, while 17% is observed to be outside the experimental resolution at 2.0 M.
FIGURE 7.

EISF of hydration water plotted versus Q2, for 0.5 M, 1 M, and 2.0 M NALMA concentration.
This seemingly puzzling result was analyzed by molecular dynamics simulation, in which the rotational relaxation times and residence times of water molecules were monitored at two different sites near the NALMA solute (see Methods and Table 2). For both concentrations we find that the residence times are very different between the two sites: ∼3.5–4.0 ps near the hydrophobic side chain, whereas it is ∼10.0–10.5 ps near the hydrophilic site (Table 2). For 0.5 M there were ∼270 water molecules per solute with the average residence time or longer over the length of the 2.15-ns simulation, whereas for 2.0 M there are only ∼55 water molecules per solute with the average residence time (Table 2).
TABLE 2.
Simulation analysis for water dynamics: the residence time, τres, and rotational timescales of water in the first hydration shell near hydrophobic and hydrophilic sites of the NALMA solute
| Site | τres (ps) | Number waters/NALMA with τres | A0 | A1 | A2 | τ1 (ps) | τ2 (ps) |
|---|---|---|---|---|---|---|---|
| 0.5 M | |||||||
| Hydrophilic | 10.0–10.5 | 143 | 0.38 | 0.35 | 0.005 | 4.8 | 1.0 |
| Hydrophobic | 3.5–4.0 | 124 | 0.40 | 0.46 | 0.085 | 2.0 | 1.0 |
| 2.0 M | |||||||
| Hydrophilic | 10.5–11.0 | 44 | 0.49 | 0.0 | 0.076 | 4.8 | 0.0 |
| Hydrophobic | 3.5–4.0 | 10 | 0.56 | 0.0 | 0.033 | 2.0 | 0.0 |
The orientational autocorrelation function for waters with τres is fit to the following functional form: A0exp(−t/τ1) + A1exp(−t/τ2) + A2.
The orientational autocorrelation P2(t) function of water molecules with these average residence times or longer, for each site at the 2.0 M concentration, are shown in Fig. 8. The 2.0-M P2(t) data at each site were best fit with one exponential, with a slow rotational timescale (∼5 ps) near the hydrophilic site, and a faster rotational timescale (∼2 ps) near the hydrophobic site (Table 2). The 0.5 M P2(t) data were fit with two exponentials, but fixing one exponential to that determined from the 2 M data at each of the two sites. The second exponential for the 0.5 M data for both sites corresponds to 1.0 ps (Table 2). A stretched exponential model, exp(−t/τ)β, also provided a good fit to the autocorrelation function of the 2-M data as well as the 0.5-M data, with a β-exponent value between 0.4 and 0.6. This complementary analysis confirms that over the full range of NALMA concentration there is a distribution of rotational timescales.
FIGURE 8.

The orientational autocorrelation function, P2(t), for waters that maintain a distance of 4.0 Å or less from the branching carbon center of the hydrophobic side chain, and within 4.0 Å of one of the backbone carboxyl oxygens of the NALMA molecule for at least τres. The 2.0 M P2(t) data is best fit with one exponential, which arises from slow rotational timescales (∼4–5 ps) near the hydrophilic site, and faster rotational timescales (∼2 ps) near the hydrophobic site. Similar behavior is observed for 0.5 M.
Qualitatively the MD results explain the EISF differences at 0.5 M and 2.0 M as arising from fewer numbers of slow water rotations near the hydrophilic regions for the 2.0 M concentration. We attribute the higher number of localized hydrogens seen at 0.5 M as arising from a better ability to form more idealized hydrogen-bonded networks near the peptide. By contrast the reduced numbers of immobile hydrogens at higher NALMA concentrations is a result of a more strained water network that breaks more easily to permit faster rotational motions.
NALMA (leucine) dynamics
We first analyze the leucine dynamics by fitting the data with one Lorentzian function. The translational linewidth at halfwidth half-maximum, Γ(Q), is represented in Fig. 9 a for all concentrations; its dependence on Q follows to a reasonable approximation the hydrodynamic regime behavior, yielding a diffusion coefficient value that ranges between 3.1 and 3.6 × 10⁻⁶ cm2/s, and therefore roughly constant over the full concentration range (Table 1). In the observed dynamical range of the experiment only the random walk is observed, and to isolate the side-chain movement from the Brownian diffusion another instrumental resolution would be needed. From the diffusion coefficient, measured at the lowest concentration, a value of 6 Å has been extracted for the hydrodynamic radius. Molecular dynamics simulations show quantitative agreement in the evaluated NALMA translational diffusion constants at the lowest concentration but deviates from the experimental 2.0-M data. (Table 1).
FIGURE 9.

(a) Halfwidth at half-maximum, Γ trans(Q), of the Lorentzian as a function of Q2, for the hydrogenated NALMA in D2O at high resolution. (b) Integrated intensities of the Lorentzian functions, plotted versus Q, for 0.5 M, 1 M, and 2.0 M NALMA concentration. The spectra are characteristic of a broad peak at 0.85 Å−1, consistent with the x-ray diffraction data in Hura et al. (1999) and Sorenson et al. (1999), which correspond to a minimum in the HWHM/Q2 , in agreement with “de Gennes narrowing” effect. (c) Halfwidth at half-maximum, HWHM, for analysis with three Lorentzian functions as a function of Q2, for the 2-M hydrogenated NALMA in D2O, without buffer subtraction. The first Lorentzian is fixed to that corresponding to the simulated Dtrans, whereas the remaining two Lorentzians are free. The second Lorentzian represents the water dynamics, and is in excellent agreement with the data presented in Fig. 4. The remaining Lorentzian is a broad component that seems to exhibit the behavior of the coherent contribution.
In Fig. 9 b we plot the integrated intensity over energy as a function of Q and concentration; the integrated intensity exhibits a characteristic broad peak at ∼0.8 Å−1, consistent with the x-ray diffraction data. Because our analysis of the integrated intensity shows that the peak cannot be isolated from an elastic component, it suggests that a collective dynamical component is present. In the same figure, we plot Γ(Q) × Q2 versus Q, in which we observe a deviation from the expected independence of Q, and showing a corresponding weak minimum in Γ(Q) × Q2 at the same wave vector as the maximum in the integrated intensity. Thus the NALMA dynamics are consistent with “de Gennes narrowing” (de Gennes, 1959), which can be narrowly interpreted as NALMA self-diffusion from the incoherent dynamics that tracks the coherent dynamics of the collective motion. An alternative viewpoint is that the observed de Gennes narrowing effect is an indicator of long timescale structural relaxation of water-caged leucine solutes. We will investigate this coherent contribution in future work.
Given the presence of the coherent dynamics contribution to the leucine dynamics spectra, and the simulated self-diffusion coefficient of 1.0 × 10⁻⁶ cm2/s, a different analysis strategy has been used. The analysis has been performed by fitting the data with three Lorentzian functions, without subtracting the aqueous D2O background. We impose the Γtrans(Q) consistent with the molecular dynamics simulation, and we leave the remaining Lorentzians free to fit the remaining buffer contribution and possibly the coherent contribution, presented in Fig. 9 c. The detected buffer dynamics contribution is in excellent accord with our previous hydration water dynamics results for the 2-M deuterated NALMA (Fig. 4), whereas the second free Lorentzian is very broad and presents two minimums at ∼0.8 Å−1 and ∼1.1 Å−1. The HWHM of the second Lorentzian is very broad and too noisy; it is only an alternative analysis, and is the most that we can extrapolate from this data.
An important corollary that emerges from the integrated QENS intensity, which exploits scattering contrast to isolate the NALMA correlations, is further support that the structural organization of the leucines in solution is identical over the full concentration range from 0.5 to 2.0 M, something that was not fully resolvable by diffraction at the lower concentrations. This implies that at 0.5 M and 1.0 M, the NALMA organizes into water-penetrated clusters, and therefore their first hydration layer dynamics can be analyzed in terms of the dynamics of the 2.0-M data.
CONCLUSION
In this work we have considered the hydration water dynamics near a model protein system, N-acetyl-leucine-methylamide, a hydrophobic amino acid side chain attached to a blocked polypeptide backbone, as a function of concentration between 0.5 M and 2.3 M. The study of the NALMA-water solution allows us to unambiguously characterize the inner sphere hydration dynamics using the 2.0 M data, and then to characterize the outer sphere water dynamics by analyzing the 0.5 M and 1.0 M data using the 2.0 M data as a model of the first hydration layer for these more dilute concentrations. The consistent dynamical picture that emerges is the presence of two proton families contributing to the quasielastic signal. One family arises from the slower dynamics represented by the first water layer that shows “supercooled” diffusion behavior and suppressed rotational motion (i.e., values consistent with bulk water at ∼−10°C). The second component arises from outer layer(s) water dynamics, which exhibits bulk water rotational motion times, and faster translational dynamics than the first hydration layer, but which does not fully recover to room temperature “bulk-like” translational diffusion values. We also find evidence of collective motion of the NALMA solutes that is consistent with de Gennes narrowing, with a self-diffusion constant that is almost an order of magnitude slower than accompanying hydration dynamics.
An additional goal of this work is to precisely study water dynamics as a function of its location in a situation better defined and less complex than a protein. We note that a folded protein's surface is roughly equally distributed between hydrophobic and hydrophilic domains, whose length scales are on the order of a few water diameters, and which justify our study of hydration dynamics of the simple NALMA system with both hydrophilic and hydrophobic regions. The systematic study of the NALMA water hydration dynamics provides an important dissection of hydration dynamics near inhomogeneous protein surfaces, with implications for supercooled liquids, protein folding and function, and protein-protein interfaces. Given these caveats of our simplified model protein, we provide comment and contrast to hydration dynamics observed near real proteins surfaces.
Until a critical hydration level is reached, proteins do not function (Rupley and Careri, 1991). This critical level of hydration is analogous to a similar lack of protein function observed for temperatures below a dynamical temperature range of 180–220 K that also is connected to the dynamics of protein surface water (Doster and Settles, 1998; Rupley and Careri, 1991). Restoration of some enzymatic activity is observed in partially hydrated protein powders, sometimes corresponding to less than a single hydration layer on the protein surface, which indicates that the dynamical and structural properties of the surface water is intimately connected to protein stability and function (Bellissent-Funel, 2000; Bizzarri and Cannistraro, 2002; Careri and Peyrard, 2001; Dellerue and Bellissent-Funel, 2000; Denisov and Halle, 1996; Denisov et al., 1999; Halle and Denisov, 1995; Mattos, 2002; Otting, 1997; Tarek and Tobias 1999, 2000, 2002; Zanotti et al., 1999). The molecular mechanism of the solvent motion that is required to instigate the protein structural relaxation above a critical hydration level or transition temperature has yet to be determined.
We focus our QENS and MD results of hydration dynamics near a model protein surface on the issue of how enzymatic activity might be restored once a critical hydration level is reached, and provide a hypothesis for the molecular mechanism of the solvent motion that is required to trigger protein structural relaxation when above the hydration transition. Below the critical hydration level, as measured by 2.0 M water dynamics, we find that the water translational and rotational dynamics are slow. Some hydration waters are tightly bound to the surface, especially near hydrophilic regions, and their slow dynamics suggest a large barrier to rearrangement with other waters, which would primarily be lateral across the peptide or protein surface. At sufficiently high levels of hydration, as measured by the 0.5 M dynamics, we find that the inner sphere water translational and rotational dynamics are still slow (equivalent to 2.0 M), but that the barrier to exchange with other waters is apparently lower, with diffusion timescales between inner and outer sphere regions approaching more bulk-like values. Therefore we might view the catalyzing effect of “sufficient” water on side-chain rearrangement on the protein surface (that is necessary for protein folding or function) as arising from a second hydration layer that lowers the barriers for water solvent rearrangement, i.e., restoration of the plasticity of the water network itself.
There is greater uncertainty in the literature about how much the dynamics of outer hydration layers are perturbed by the protein interface, with some studies supporting the view that the outer layer dynamics have recovered bulk-like water dynamics, whereas other analysis suggest perturbations well into the second or third layer. Recent work has supported the provocative suggestion that outer layer dynamics are up to 50 times slower than inner protein layer dynamics, and might support “slip streams” for ligand or metabolite diffusion to relevant protein active sites. Our results find faster water diffusion in outer hydration layers relative to the first hydration level, but still suppressed with respect to bulk-like values, whereas rotational motions in outer layers are fully recovered to bulk water values. Due to the high density of molecules within the cell, there can on average only be two to three hydration layers between proteins (Mentre, 2001). We do see spatially heterogeneous dynamics at all hydration levels we have examined that might have functional importance in the crowded cell or at a protein-protein interface. Perhaps analysis of hydrophilic and hydrophobic patterns on protein surfaces should be analyzed for “slip streams” into active sites (our results suggesting that one follow hydrophobic tributaries), or for protein-protein molecular recognition events involving arrested water motions to aid docking.
Acknowledgments
The authors acknowledge Dr. John Copley for assisting on the DCS spectrometer and thank Dr. José Teixeira for performing the small-angle neutron experiment on the PAXE spectrometer.
We gratefully acknowledge the support of the National Institutes of Health (GM65239-01). This work utilized facilities supported in part by the National Science Foundation (under agreement number DMR-0086210). We acknowledge the support of the National Institute of Standards and Technology, U. S. Department of Commerce, in providing the neutron research facilities used in this work.
References
- Anderson, H. C. 1983. Rattle: a “velocity” version of the shake algorithm for molecular dynamics calculations. J. Comp. Phys. 52:24–34. [Google Scholar]
- Angell, C. A. 1995. Formation of glasses from liquids and biopolymers. Science. 267:1924–1935. (Review). [DOI] [PubMed] [Google Scholar]
- Barron, L. D., L. Hecht, and G. Wilson. 1997. The lubricant of life—a proposal that solvent water promotes extremely fast conformational fluctuations in mobile heteropolypeptide structure. Biochemistry. 36:13143–13147. [DOI] [PubMed] [Google Scholar]
- Bee, M. 1988. Quasi-Elastic Neutron Scattering. Adam Hilger, Philadelphia, PA.
- Bee, M. 2003. Localized and long-range diffusion in condensed matter: state of the art of QENS studies and future prospects. Chem. Phys. 292:121–141. [Google Scholar]
- Bellissent-Funel, M. C. 2000. Hydration in protein dynamics and function. Journal of Molecular Liquids. 84:39–52. [Google Scholar]
- Bellissent-Funel, M. C., J. Teixeira, K. F. Bradley, and S. H. Chen. 1992. Dynamics of hydration water in protein. Journal de Physique I. 2:995–1001. [Google Scholar]
- Berendsen, H. J., J. R. Grigera, and T. P. Straatsma. 1987. The missing term in effective pair potentials. J. Phys. Chem. 91:6269–6271. [Google Scholar]
- Bizzarri, A. R., and S. Cannistraro. 2002. Molecular dynamics of water at the protein-solvent interface. J. Phys. Chem. B. 106:6617–6633. (Review). [Google Scholar]
- Bu, Z. M., D. A. Neumann, S. H. Lee, C. M. Brown, D. M. Engelman, and C. C. Han. 2000. A view of dynamics changes in the molten globule-native folding step by quasielastic neutron scattering. J. Mol. Biol. 301:525–536. [DOI] [PubMed] [Google Scholar]
- Careri, G., and M. Peyrard. 2001. Physical aspects of the weakly hydrated protein surface. Cell. Mol. Biol. 47:745–756 (Review). [PubMed] [Google Scholar]
- Cheung, M. S., A. E. Garcia, and J. N. Onuchic. 2002. Protein folding mediated by solvation: water expulsion and formation of the hydrophobic core occur after the structural collapse. Proc. Natl. Acad. Sci. USA. 99:685–690. [DOI] [PMC free article] [PubMed] [Google Scholar]
- Cornell, W. D., P. Cieplak, C. I. Bayly, I. R. Gould, K. M. Merz, D. M. Ferguson, D. C. Spellmeyer, T. Fox, J. W. Caldwell, and P. A. Kollman. 1995. A second generation force field for the simulation of proteins, nucleic acids, and organic molecules. J. Am. Chem. Soc. 117:5179–5197. [Google Scholar]
- de Gennes, P. G. 1959. Liquid dynamics and inelastic scattering of neutrons. Physica. 25:825–839. [Google Scholar]
- Dellerue, S., and M. C. Bellissent-Funel. 2000. Relaxational dynamics of water molecules at protein surface. Chem. Phys. 258:315–325. [Google Scholar]
- Denisov, V. P., and B. Halle. 1996. Protein hydration dynamics in aqueous solution. Faraday Discuss. 103:227–244. [DOI] [PubMed] [Google Scholar]
- Denisov, V. P., B. H. Jonsson, and B. Halle. 1999. Hydration of denatured and molten globule proteins. Nat. Struct. Biol. 6:253–260. [DOI] [PubMed] [Google Scholar]
- Diehl, M., W. Doster, W. Petry, and H. Schober. 1997. Water-coupled low-frequency modes of myoglobin and lysozyme observed by inelastic neutron scattering. Biophys. J. 73:2726–2732. [DOI] [PMC free article] [PubMed] [Google Scholar]
- Doster, W., and M. Settles. 1998. The dynamical transition: the role of hydrogen bonds. In Hydration Processes in Biology; Les Houches Lectures. M. C. Bellissent-Funel and J. Teixeira, editors. IOS Press, Burke, VA.
- Ediger, M. D., C. A. Angell, and S. R. Nagel. 1996. Supercooled liquids and glasses. J. Phys. Chem. 100:13200–13212. (Review). [Google Scholar]
- Egelstaff, P. A. 1992. An Introduction to the Liquid State. Clarendon, Oxford, UK.
- Green, J. L., J. Fan, and C. A. Angell. 1994. The protein-class analogy: some insights from homopeptide comparisons. J. Phys. Chem. 98:13780–13790. (Review). [Google Scholar]
- Halle, B., and V. P. Denisov. 1995. A new view of water dynamics in immobilized proteins. Biophys. J. 69:242–249. [DOI] [PMC free article] [PubMed] [Google Scholar]
- Hura, G., J. M. Sorenson, R. M. Glaeser, and T. Head-Gordon. 1999. Solution x-ray scattering as a probe of hydration-dependent structuring of aqueous solutions. Perspectives in Drug Discovery & Design. 17:97–118. (Review). [Google Scholar]
- Janin, J. 1999. Wet and dry interfaces: the role of solvent in protein-protein and protein-DNA recognition. Struct. Fold. Des. 7:R277–R279. (Review). [DOI] [PubMed] [Google Scholar]
- Marchi, M., F. Sterpone, and M. Ceccarelli. 2002. Water rotational relaxation and diffusion in hydrated lysozyme. J. Am. Chem. Soc. 124:6787–6791. [DOI] [PubMed] [Google Scholar]
- Mattos, C. 2002. Protein-water interactions in a dynamic world. Trends Biochem. Sci. 27:203–208. (Review). [DOI] [PubMed] [Google Scholar]
- Mentre, P. 2001. An introduction to water in the cell: tamed hydra? Cellular & Molecular Biology. 47:709–715. [PubMed] [Google Scholar]
- Merzel, F., and J. C. Smith. 2002. Is the first hydration shell of lysozyme of higher density than bulk water? Proc. Natl. Acad. Sci. USA. 99:5378–5383. [DOI] [PMC free article] [PubMed] [Google Scholar]
- Nishikawa, K., and N. Kitagawa. 1980. X-ray-diffraction study of liquid water. Bulletin of the Chemical Society of Japan. 53:2804–2808. [Google Scholar]
- Otting, G. 1997. NMR studies of water bound to biological molecules. Progress in Nuclear Magnetic Resonance Spectroscopy. 31:259–285. (Review). [Google Scholar]
- Pal, S. K., J. Peon, and A. H. Zewail. 2002. Biological water at the protein surface: dynamical solvation probed directly with femtosecond resolution. Proc. Natl. Acad. Sci. USA. 99:1763–1768. [DOI] [PMC free article] [PubMed] [Google Scholar]
- Pande, V. S., and D. S. Rokhsar. 1999. Molecular dynamics simulations of unfolding and refolding of a beta-hairpin fragment of protein G. Proc. Natl. Acad. Sci. USA. 96:9062–9067. [DOI] [PMC free article] [PubMed] [Google Scholar]
- Rupley, J. A., and G. Careri. 1991. Protein hydration and function. Adv. Protein Chem. 41:37–172. [DOI] [PubMed] [Google Scholar]
- Russo, D., P. Baglioni, E. Peroni, and J. Teixeira. 2003. Picosecond hydration water dynamics of a completely hydrophobic small peptide. Chem. Phys. 292:235–245. [Google Scholar]
- Russo, D., J. Perez, J. M. Zanotti, M. Desmadril, and D. Durand. 2002. Dynamic transition associated with the thermal denaturation of a small beta protein. Biophys. J. 83:2792–2800. [DOI] [PMC free article] [PubMed] [Google Scholar]
- Sears, V. F. 1966. Theory of cold neutron scattering by homonuclear diatomic liquids. I. Free rotation. Canadian Journal of Physics. 44:1299.
- Shea, J. E., J. N. Onuchic, and C. L. Brooks. 2002. Probing the folding free energy landscape of the src-SH3 protein domain. Proc. Natl. Acad. Sci. USA. 99:16064–16068. [DOI] [PMC free article] [PubMed] [Google Scholar]
- Sheinerman, F. B., and C. L. Brooks. 1998. Molecular picture of folding of a small alpha/beta protein. Proc. Natl. Acad. Sci. USA. 95:1562–1567. [DOI] [PMC free article] [PubMed] [Google Scholar]
- Sorenson, J. M., G. Hura, A. K. Soper, A. Pertsemlidis, and T. Head-Gordon. 1999. Determining the role of hydration forces in protein folding. J. Phys. Chem. B. 103:5413–5426. [Google Scholar]
- Svergun, D. I., S. Richard, M. H. J. Koch, Z. Sayers, S. Kuprin, and G. Zaccai. 1998. Protein hydration in solution: experimental observation by x-ray and neutron scattering. Proc. Natl. Acad. Sci. USA. 95:2267–2272. [DOI] [PMC free article] [PubMed] [Google Scholar]
- Tarek, M., and D. J. Tobias. 1999. Environmental dependence of the dynamics of protein hydration water. J. Am. Chem. Soc. 121:9740–9741. [Google Scholar]
- Tarek, M., and D. J. Tobias. 2000. The dynamics of protein hydration water: a quantitative comparison of molecular dynamics simulations and neutron-scattering experiments. Biophys. J. 79:3244–3257. [DOI] [PMC free article] [PubMed] [Google Scholar]
- Tarek, M., and D. J. Tobias. 2002. Role of protein-water hydrogen bond dynamics in the protein dynamical transition. Phys. Rev. Lett. 88:138101. [DOI] [PubMed] [Google Scholar]
- Tournier, A. L., J. C. Xu, and J. C. Smith. 2003. Translational hydration water dynamics drives the protein glass transition. Biophys. J. 85:1871–1875. [DOI] [PMC free article] [PubMed] [Google Scholar]
- Zanotti, J. M., M. C. Bellissentfunel, and J. Parello. 1997. Dynamics of a globular protein as studied by neutron scattering and solid-state NMR. Physica B. 234:228–230. [Google Scholar]
- Zanotti, J. M., M. C. Bellissent-Funel, and J. Parello. 1999. Hydration-coupled dynamics in proteins studied by neutron scattering and NMR: the case of the typical EF-hand calcium-binding parvalbumin. Biophys. J. 76:2390–2411. [DOI] [PMC free article] [PubMed] [Google Scholar]