Abstract
We activated a solid-fluid interface by attaching flagellated bacteria to a solid surface. We adsorbed swarmer cells of Serratia marcescens to polydimethylsiloxane or polystyrene. The cell bodies formed a densely packed monolayer while their flagella continued to rotate freely. Motion of the fluid close to an extended flat surface, visualized with tracer beads, was dramatically enhanced compared to the motion farther away. The tracer beads revealed complex ever-changing flow patterns, some linear (rivers), others rotational (whirlpools). Typical features of this flow were small (tens of μm) and reasonably stable (many minutes). The surface performed active mixing equivalent to diffusion with a coefficient of 2 × 10⁻⁷ cm2/s. We call these flat constructs “bacterial carpets”. When attached to polystyrene beads or to fragments of polydimethylsiloxane, the bacteria generated both translation and rotation. We call these constructs “auto-mobile beads” or “auto-mobile chips”. Given the size and strength of the flow patterns near the carpets, the motion must be generated by small numbers of coordinated flagella. We should be able to produce larger and longer-range effects by increasing coordination.
INTRODUCTION
Designers of microfluidic devices must deal with the strange, often counterintuitive physics of low Reynolds number hydrodynamics. Many physical processes, such as turbulent mixing and pumping, do not work in the microscopic world (for a review, see Beebe et al. (2002)). However, there are native inhabitants of this world—for example, bacteria—that have evolved to meet the unique physical constraints of life at low Reynolds number (Purcell, 1977). Microfluidic devices became compatible with living organisms through polydimethylsiloxane (PDMS) soft-lithography microfabrication techniques (Quake and Scherer, 2000; Whitesides et al., 2001). This opens the possibility of using bacteria to solve problems of microscale hydrodynamics. Might motile bacteria, fixed on a surface, move the fluid near them? Will such bacteria, fixed to the surface of a small object, act as microscopic propellers? The flagella of a swimming bacterium spontaneously coordinate into bundles. Can we achieve flagellar coordination with bacteria on a surface?
The flagellum is a propulsive organelle that includes a reversible rotary motor embedded in the cell wall, and a filament that extends into the external medium (Berg, 2003). The filament is a long (∼10 μm), thin (∼20 nm) helix (2.5 μm pitch, 0.5 μm diameter) that turns at speeds of ∼100 Hz. Motile bacteria differ in their styles of flagellation (Leifson, 1960). One such style is peritrichous flagellation, such as in Escherichia coli, Salmonella typhimurium, and Serratia marcescens. The flagella of these cells are distributed randomly over the cell surface, and each flagellar motor rotates independently of the others. Hydrodynamic interactions among flagella cause them to coordinate, coalescing and “bundling” behind the cell during swimming. These bacteria have more than one lifestyle: they can live individually as freely swimming single cells in fluids, or cooperatively as swarms of cells on surfaces (for a review, see Fraser and Hughes (1999)). Swarms develop when cells are grown in a rich medium on a soft agar surface. The cells lengthen, produce more flagella, and move in groups that are packed side by side in dense layers, one or several cells thick (Harshey, 1994; Henrichsen, 1972). We exploit swarmer cells of S. marcescens (Alberti and Harshey, 1990) as a ready source of microscopic low Reynolds number pumps.
Bacteria are equipped with exquisitely sensitive detectors of physical or chemical sensory stimuli that modulate the direction of rotation of their flagellar motors (Falke et al., 1997). These detectors can be selected, or even designed, to respond to (for example) light of specific wavelengths (Jung et al., 2001) or to specific chemical substances (Looger et al., 2003). Bacteria have some advantages over conventional micro- or nanofabricated devices. They can live on small amounts of simple nutrients, e.g., sugars, so no external power source is needed. They self replicate, so no multistep lithographic fabrication is required. Thus, it may eventually be possible to combine a biological sensor and fluid actuator in a single small, cheap, self-replicating package. This study was designed to learn how well the flagella of groups of bacteria might move fluid in a microscopic environment.
METHODS
Bacteria
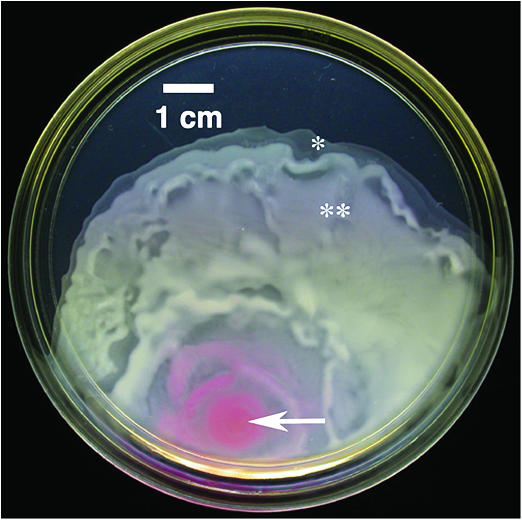
The bacterium S. marcescens (ATCC 274, American Type Culture Collection, Manassas, VA) was grown on swarm plates (L-broth containing 0.6% Difco Bacto-agar and 5 g/l glucose (Toguchi et al., 2000). Petri plates, 15 cm diameter, containing 33 ml medium, were inoculated off-center with a 2 μl aliquot of a 10−6 dilution of a saturated L-broth culture and incubated at 30°C overnight. This produced a 5–6 cm radius swarming colony (Fig. 1).
FIGURE 1.
A S. marcescens colony swarming across an agar plate. The arrow indicates the inoculation site and the asterisks mark approximate locations of carpet fabrication.
Bacterial carpet fabrication
Dow Corning (Midland, MI) Sylgard 184 (mainly PDMS) was mixed according to the manufacturer's instructions and spun onto 22 mm diameter No. 1 coverslips at 3000 rpm for 30 s using a spinner (model PWM32-PS-R790, Headway Research, Garland, TX), then cured either 1 h at 100°C or overnight at 60°C. The PDMS-coated coverslip was inverted onto the active bacterial swarm and removed. Unattached bacteria were washed free by floating the coverslip over motility medium (0.01 M potassium phosphate, 0.067 M sodium chloride, 10−4 M ethylenediaminetetraacetic acid, 0.01 M glucose, and 0.002% Tween-20, pH 7.0) and stirring. We refer to this method of transferring bacteria to PDMS as “blotting” and the resulting structure as a “carpet”.
Carpet assessment
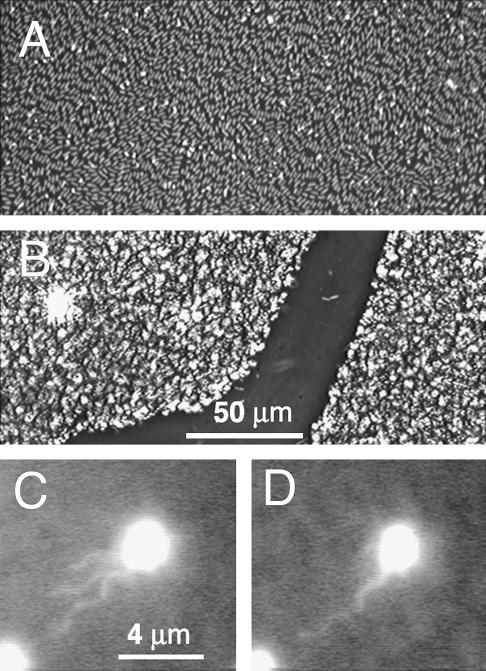
Cell attachment was evaluated using a Nikon (Tokyo, Japan) Optiphot microscope equipped with a 40× phase objective (Fig. 2, A and B). Bacterial filaments were visualized by creating a carpet of labeled and unlabeled bacteria: S. marcescens were washed from a swarm plate, labeled (Turner et al., 2000) using Cy3 dye (PA23001, Amersham Biosciences, Piscataway, NJ), added back to the swarm, incubated 15 min at 30°C, and then blotted. The flagellar filaments were imaged (Turner et al., 2000) with the coverslip as part of a flow cell (see below, “Fluid-flow assays”, and Fig. 2, C and D). Filament rotation rates were determined from a frame-by-frame analysis of high-speed video from a 500-Hz low-light-level camera (HSC-500 ×2, JC Labs, Mountain View, CA) (L.T. and H.C.B., unpublished).
FIGURE 2.
Phase-contrast image of a bacterial carpet. (A) These bacteria lay flat on the surface in groups that were aligned. (B) These bacteria were attached to the surface end-on. (C and D) A fluorescently labeled bacterium among unlabeled bacteria in a carpet. The flagellar filaments oriented with the flow in (C) and bundled in (D). The flow field was ∼10 μm/s (measured 10 μm above the carpet surface).
Fluid-flow assays
The carpet formed the bottom window of a flow cell designed for bacterial behavioral assays (Berg and Block, 1984). The viewing area is 0.76 cm square by 0.033 cm deep. The total flow-cell chamber volume including inlet pipes is 60 μl. A syringe pump (Harvard Apparatus, South Natick, MA) was used to flush motility medium through the chamber at 100–200 μl/min for at least 5 min before data acquisition. The carpet was imaged with a 60× phase objective (Nikon PlanApo DM oil, NA 1.4) and an inverted microscope (Nikon Diaphot 200) also equipped for fluorescence.
For motion assays, a 1:50 dilution of 1 μm nominal diameter red fluorescing beads (R0100, Duke Scientific, Palo Alto, CA) was added through the flow-cell input and imaged in epifluorescence mode using mercury arc excitation (TRITC fluorescence cube No. 31002, Chroma Technologies, Brattleboro, VT) and a CCD camera (model 1070, Marshall Electronics, Culver City, CA). Images were recorded (Sony GV-D1000, Sony, Montvale, NJ) and played back for analysis to a Macintosh G3 computer (Apple Computer, Cupertino CA) equipped with an LG3 video board and Scion Image software (both from Scion, Frederick, MD).
Data analysis
Videos of bead motion were divided into 10- or 30-s segments and imported into MATLAB (The MathWorks, Natick, MA) for tracking. Each set of images was thresholded, generally 5–7 standard deviations above the black background. MATLAB's built-in particle locating routines assigned all contiguous above-threshold pixels to the same “particle”, and labeled each disjoint “particle” with a unique index. The centroid of every particle (with area >3 pixels) was tracked frame to frame. A 1 μm bead was assumed to move <2 μm between frames (1/30 s). In any ambiguous situation, the algorithm terminated the existing bead track and started afresh. This technique frequently chopped a single long track into several short tracks (for instance, when a bead dipped below threshold for a single frame), reducing the total number of long tracks available for subsequent analysis. As a result, the statistics for long tracking times are poor, so bead-tracking analysis was stopped at a practical upper limit of 3 s. The 2 μm search radius was chosen just large enough to accept all the observed single-frame displacements, and adjusted when necessary for different bead sizes and data rates.
Alignment parameters
To evaluate the correlation of a vector field (see Fig. 6), we constructed an alignment parameter  and normalized it so that
  The average is over all pairs of vectors measured at relative distances
  and relative times
  . Since cell bodies have a head/tail ambiguity, measures of cell alignment used a variation
  where
where  is a unit vector parallel to the major axis of the cell body. Both of these parameters are constructed so that Ω = 1 for a fully aligned field and Ω = 0 for a completely random field.
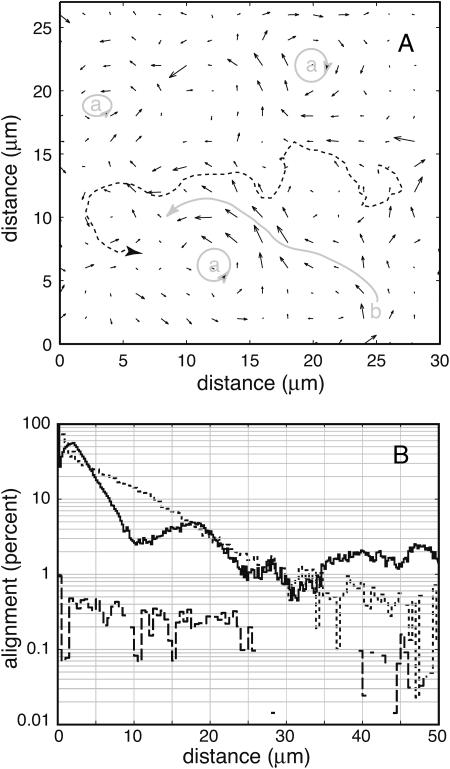
FIGURE 6.
Vector plot of velocities, and velocity correlations. (A) Fluid velocity immediately above the active surface (short arrows). The longest velocity vector corresponds to a speed of 60 μm/s. Several “whirlpools” (a) and a “river” (b) are indicated in gray. Velocities were calculated from video of 1 μm tracer beads, binned into 2 μm × 2 μm pixels and averaged over 60 s. Blank areas have no data. The dotted line shows a typical 10-s-long path of a tracer bead. (B) Semilog plot of flow-flow (solid line), cell-cell (dotted line), and cell-flow (dashed line) alignment as a function of distance r. The alignment parameters can be roughly interpreted as the percentage of objects at a distance r that are coaligned with an object at the origin, but see “Methods” for rigorous definitions. The hump in the flow-flow alignment curve (10 μm < r < 25 μm) is reproducible. It is caused by anticorrelation on opposite sides of whirlpools; the hump width is the average diameter of a whirlpool. The flow-flow and cell-cell parameters are normalized to 100% at r = 0. However, the flow-flow alignment is not reliable in the range  μm, due to a proximity breakdown in the tracking algorithm, and there is an artifact in the cell-cell curve at r < 1 μm caused by packing limitations of finite-size cells. Negative values are omitted, producing gaps in some curves. All three curves were taken from the same active surface, part of which is binned and plotted in A.
Auto-mobile beads and chips
Large red fluorescing polystyrene beads (10 μm diameter F-8834, Molecular Probes, Eugene, OR) were centrifuged (10 min at ∼800 × g) and concentrated in motility medium (about fivefold) and pipetted onto the leading edge of a swarm. This region was pipetted from the plate into 1 ml of motility medium. A sample was sealed between coverslip and slide with a grease ring and observed in both fluorescence (Texas Red cube No. 31004, Chroma Technologies) and phase contrast with a 40× dry objective. Auto-mobile bead motion was recorded and the centroid tracked, as above. To extract rotational information, individual bacteria on the bead's surface were identified by eye and tracked frame to frame. These markers were rotated into alignment between successive frames, giving the change in bead body angle.
Auto-mobile chips were fabricated from Dow Corning Sylgard 184 (PDMS), which was spread between two microscope slides by sliding the edge of one across the surface of the other. This created a very thin PDMS layer that was cured by holding the slide in a propane flame until red hot. As the microscope slide cooled to room temperature, the PDMS slowly fractured. The fractured PDMS was blotted onto S. marcescens as described above, and pieces were scraped off the slide under buffer using a razor blade. This produced small fragments of bacterial-carpet-coated PDMS, which were imaged in phase-contrast with a 10× objective.
RESULTS
A portion of an active swarm of S. marcescens (Fig. 1) was transferred from an agar plate to a PDMS-coated coverslip by blotting, resulting in a bacterial carpet. Using phase-contrast imaging, we found domains in which bacteria were highly oriented, either lying flat, parallel to the substrate (Fig. 2 A), or standing on end, normal to the substrate (Fig. 2 B). The flat, parallel patches were similar to bacterial rafts observed during swarming (Harshey, 1994), whereas the upright morphology resembles colonies of Vibrio parahaemolyticus (Enos-Berlage and McCarter, 2000). However, S. marcescens swarms do not contain visible regions of vertically oriented bacteria, so the latter type of attachment appears to be an artifact of the blotting technique. Remarkably, bacteria attached in either manner had freely rotating flagellar filaments that stirred the fluid.
Carpets made from the leading edge of the swarm (Fig. 2 A) contained long cells (0.70 ± 0.07 μm wide by 2.7 ± 0.7 μm long) that were seldom up-ended. Carpets made farther behind the leading edge contained shorter cells (0.62 ± 0.01 μm wide by 1.7 ± 0.3 μm long) of mixed attachment style. The longest bacteria (6.6 ± 1.9 μm), found at the leading edge of the swarm, were missing from our bacterial carpets.
We mixed fluorescently labeled bacteria with unlabeled swarming bacteria to create a heterogeneous carpet. Labeled flagella rotated just above the carpet surface (Fig. 2, C and D). An applied flow of 10 μm/s (measured 10 μm above the carpet surface) caused these filaments to orient in the direction of flow, where they bundled and unbundled. The rotation rate of the flagella was 140 ± 30 Hz, comparable to the rotation rate of E. coli flagella when cells are stuck to glass (L.T. and H.C.B, unpublished). When swarming S. marcescens were suspended in motility medium at room temperature, their swimming speed was 47 ± 16 μm/s.
Bead dynamics
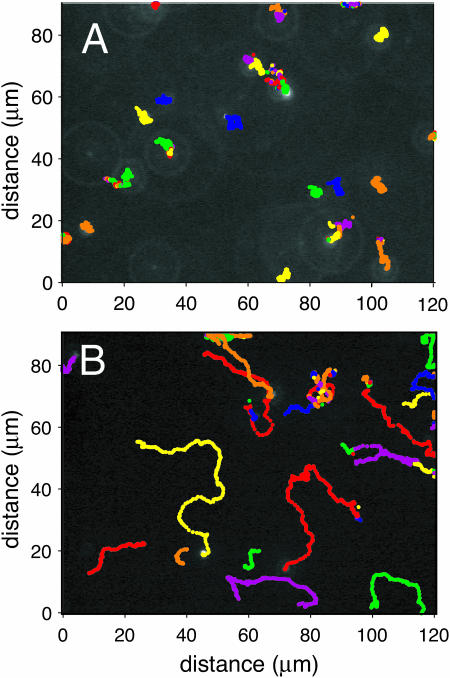
Fig. 3 shows the paths traced by 1 μm beads over a 10 s interval, in the bulk fluid (A) and immediately above the surface (B). Beads near the surface moved much more rapidly, and over much larger distances, than beads in the bulk fluid. Since all bead motions were, on average, uncorrelated with each other, we describe their motion statistically and develop an analogy with ordinary diffusion.
FIGURE 3.
Tracer bead tracks. Paths traced by 1 μm diameter fluorescent beads over a 10 s interval (A) when far from the active surface and (B) when close to that surface. These two sets of data were taken above the same area of the carpet, but at heights of +80 μm and +3 μm, respectively. Beads close to the surface (B) followed much longer, straighter trajectories than those generated by Brownian motion (A). Individual dots are center-of-mass positions at 1/30-s intervals. Each bead's trace is color-coded by the analysis program; when an ambiguity in the tracking algorithm occurred, the analysis software reset the bead identity, leading to a mid-course color change.
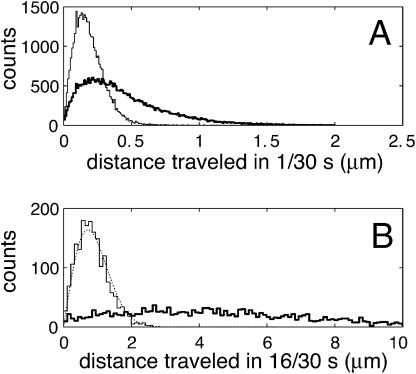
Fig. 4 shows histograms of the end-to-end distance traveled over 1/30 s and 16/30 s. Since the camera focal plane was parallel to the carpet surface, this analysis only includes motion in the two dimensions parallel to the carpet. Any process that obeys the diffusion equation  should be invariant under the similarity transform
  and
and  with distance r, time t, and an arbitrary scale factor α. Indeed, far from the surface the distribution is unchanged if we increase the time interval by a factor of
  and compress the distance scale by a corresponding factor of
  (compare Fig. 4, A and B). For diffusion in two dimensions, we expect this distribution to follow
  with diffusion coefficient
  (according to the Stokes-Einstein equation with temperature T, viscosity η, and particle radius a). This functional form is superimposed in Fig. 4 B (dotted line), and agrees with the observed distribution; we conclude that all influence of the active carpet surface has already dissipated at a distance of 80 μm from that surface.
FIGURE 4.
Tracer bead displacements over short and long time spans. Histograms of bead displacements over time spans of (A) 1/30 s and (B) 16/30 s. Thick lines are distributions for motion close to the surface (+3 μm), and thin lines are for distributions for motion far from the surface (+80 μm). Note that the abscissa of B is compressed by a factor of 4 relative to A. This transformation preserves the shape of the distribution for Brownian motion (thin line), but not for surface motion. Data within each panel are normalized to equal areas. As a consistency check, the fitted diffusion coefficient from Fig. 5 A was used to generate the Brownian distribution of Fig. 4 B (dotted line).
Just above the surface, the distribution evolves in a completely different manner. Under the same similarity transform, the distribution is stretched and distorted, with most beads moving much farther than predicted by the normal diffusion equation. Brownian motion requires that individual steps be essentially uncorrelated. However, beads close to the surface follow smooth trajectories that are very different from the random jiggles of Brownian motion. These beads “remember” their direction of motion for a significant time, destroying the  scaling law of the similarity transform.
The simplest plausible correlation function allows an exponentially decaying memory of velocity:  This is mathematically equivalent to a Rayleigh particle, which is designed to describe the diffusion of a physically reasonable particle (albeit on time scales ∼105 times smaller than ours (van Kampen, 1992)). The mean-square displacement in two dimensions is given by
 |
where the diffusion coefficient D, correlation time τ, and rms speed  are related via
  For small t this becomes ballistic motion
  ; for large t it becomes Brownian motion
  .
.
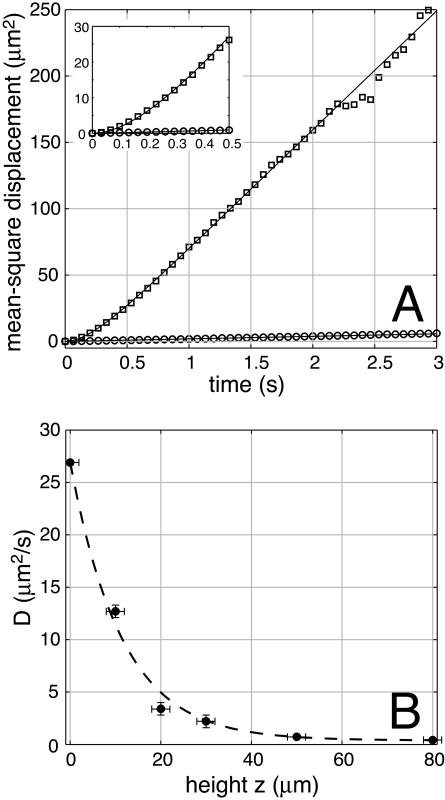
Fig. 5 A shows the mean-square displacements as a function of time. In the bulk fluid far from the surface (open circles), the mean-square displacement  increases linearly with t at a very slow rate that is consistent with the small diffusion coefficient of the large tracer beads. At the surface (open squares),
  begins as ballistic motion, but soon changes over to Brownian motion. The initial curvature (inset) occurs because bead motion is correlated over ∼0.25 s.
FIGURE 5.
Mean-square displacement and D(z). (A) Mean-square displacement as a function of time t, near the surface (open squares) and far from the surface (open circles). Far from the surface, the mean-square displacement is uniformly linear in time. Close to the surface, correlation between steps produces a curvature in  for t < 1 s. The expanded scale of the inset shows the curvature more clearly. Solid lines are fits to the form
  , yielding D = 22.4 ± 0.2 μm2/s and τ = 0.22 ± 0.01 s at the surface, and D = 0.48 ± 0.01 μm2/s and τ = 0.02 ± 0.01 s in the bulk. Based on the ratio of the fitted diffusion coefficients D, this particular area of the carpet produces diffusive transport ∼45 times faster than bulk Brownian motion of 1 μm beads. Due to statistical limitations, this plot is truncated at 3 s and (15 μm)2, but each tracer bead continued to diffuse until it eventually exited our ∼100-μm-wide field of view. (B) Effective diffusion coefficient D as a function of height z. Motion was recorded at a series of heights above an active surface, and the subset of beads that were in focus (estimated to be within 2 μm of the focal plane) was tracked. Each of the mean-square displacement curves was fit as above, yielding D(z). The dashed line (an exponential with a decay length of 11.5 μm) is supplied for comparison.
Averaging over 13 separate areas of 6 carpets gave Dsurface = 19 ± 5 μm2/s and Dbulk = 0.52 ± 0.18 μm2/s. From the ratio of these two numbers, the agitation of bacterial flagella increased the surface “active” diffusion coefficient almost 40 times relative to the bulk “passive” diffusion of 1 μm beads. Individual measurements of Dsurface spanned ±40% of the mean value, even within different areas of a single carpet preparation. Presumably, this variability stems from differences in the number, length, and coordination of the cells' free flagella. We found no significant correlation between Dsurface and style of cell attachment.
The average correlation times are τsurface = 0.09 ± 0.03 s and τbulk = 0.02 ± 0.03 s. The relatively large error associated with the latter measurement occurs because τ is sensitive to small amounts of drift in the bulk fluid, so τ is generally a less precise and robust measure than D.
The bulk fit parameters are consistent with the Stokes-Einstein predictions of τbulk = 50 ns and of Dbulk = 0.45 ± 0.02 μm2/s for a 0.97 ± 0.05 μm diameter sphere in water (Reif, 1965). We verified that bead motion in the bulk fluid was similar to motion over a bare surface or over a surface of deactivated bacteria.
The effective diffusion coefficient drops smoothly as a function of height above the surface (Fig. 5 B). At distances of more than 50 μm from the surface, it is indistinguishable from its bulk value.
Surface flows
The vector plot of Fig. 6 A gives a snapshot of flow over a small portion of the surface. In some regions of this snapshot, the fluid seemed quiescent, whereas in others bead after bead moved across the surface. These local variations can be qualitatively classified into “whirlpools” (a) and “rivers” (b). “Whirlpools” produced an almost perfectly circular flow, whereas “rivers” transported beads in an almost straight line. Many rivers seemed to be constructed from several suitably spaced co- and counter-rotating whirlpools. These features generally lasted several minutes before dissipating, with the hardiest rivers and whirlpools lasting more than 10 min. After 10 min, the amount of activity is undiminished (as measured by the rms speed of the flow, for example), but almost none of the originally identifiable centers of activity remain. Most rivers and whirlpools have shifted, merged, or dissipated in that time.
To quantify these observations, we examined the correlations between measured surface fluid velocities as a function of the distance and time between them. Fig. 6 B shows the average, normalized correlation between velocities (solid line, defined as the alignment parameter  in “Methods”). The peak between 10 and 25 μm is a consistent feature of all our carpets. It is caused by the anticorrelation between velocities on opposite sides of whirlpools. The distance between the flanking minima corresponds to the whirlpool diameter, which ranged from 10 to 15 μm. The average interwhirlpool distance was ∼30 μm.
Choosing a particular distance ( μm) and examining the alignment
  as it decays in time, we see a gradual decline over many minutes (data not shown). After 5 min, the correlation was reduced to ∼25% of its original value, but it was still far from zero. As noted above, some locations maintained stable patterns for more than 10 min.
If flagella were to form bundles that are aligned with the cell body (as occurs during swimming), these bundles would produce a local flow that is itself aligned with the cell body. Fig. 6 B includes a plot of cell-cell alignment as a function of cell-cell separation (dotted line, defined as  in “Methods”). It does not match the flow-flow alignment curve particularly well. The cell-cell correlation length (7–9 μm) seems too short to explain the observed whirlpool sizes. As a direct test, we examined the alignment between flow direction and cell orientation (dashed line). Over short distances, the cell-flow alignment is consistently positive, but extremely weak: at 2 μm separation, flow-flow alignment is high (better than 60%) and cell-cell alignment is moderate (∼30%), but they are not aligned with each other (cell-flow alignment is <0.5%). The connector between the flagellum and the cell body (the “hook”) is very flexible. This enables the filaments to change their orientation (Berg and Anderson, 1973) and thus, in a carpet, to decouple the direction of local flow from any order present among the cell bodies themselves.
Auto-mobile beads and chips
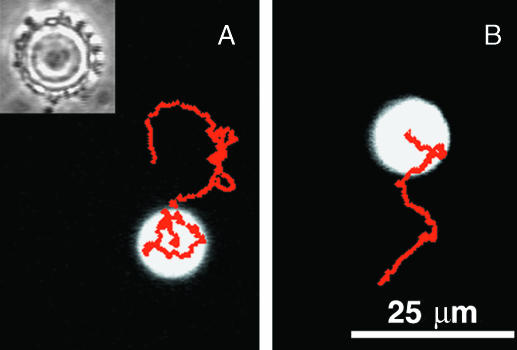
We attached S. marcescens to fluorescent 10 μm diameter beads (Fig. 7 A, inset) to make them auto-mobile. Fig. 7, A and B, show two trajectories of such a bead. The ∼50 bacteria attached correspond to a surface density of ∼1 bacterium/6 μm2, ∼3 times smaller than the density achieved by blotting flat PDMS surfaces. A substantial number of the attached bacteria must be active, since contaminants drifting near the bead are suddenly spurted away from many different points on the bead's surface.
FIGURE 7.
Auto-mobile bead. (A) Motion of a 10 μm diameter fluorescent auto-mobile bead over 30 s. Red dots mark the bead's center at 1/10 s intervals. On a phase-contrast image of the same bead (inset), adhered bacteria are visible as dark spots around the bead's circumference. (B) Motion of the same auto-mobile bead over 20 s, beginning 30 s later. This track is composed of straight segments interspersed with abrupt changes in direction.
The root mean-square speed for the bead in Fig. 7 was 4.7 μm/s. Since the bead retained its direction for a relatively long time (0.9 s, on average), it could move substantial distances. Its mean-square displacement was 250 μm2 over 9 s, which is 150 times greater than expected from diffusion (1.6 μm2 in 9 s). It rotated rapidly—one complete turn in 10 s—and nearly unidirectionally. By comparison, rotational diffusion alone would have taken more than 3 h to turn the bead through 360°. We conclude that most of the randomization of translational velocity was due to rotation of the bead, rather than to loss of coherence of the propelling bacteria.
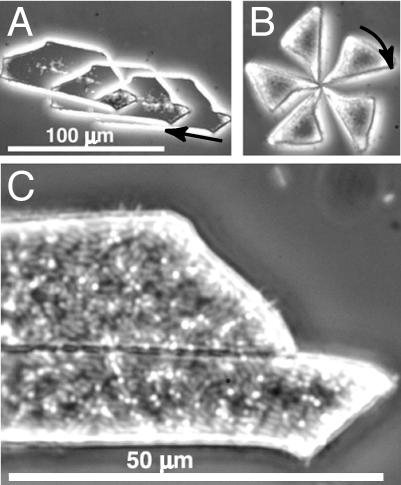
To reduce rotation, we created larger, flat fragments of bacterial carpets: “auto-mobile chips.” These flat objects appeared to skate in the buffer just above the surface of the microscope slide, moving in two dimensions. Fig. 8, A, shows a trapezoidal auto-mobile chip moving at ∼5 μm/s. The slight clockwise rotation reversed sharply 2 min later. The bacterial carpet, which coats the top side of the chip (Fig. 8, C), shows both styles of attachment. The wedge-shaped chip of Fig. 8, B, rotated at ∼6 rpm for more than 10 min. Since its axis of rotation meandered slightly during this time, the wedge's corner probably was dragging on the surface rather than being tethered. Other triangular chips also rotated rapidly, and almost all clockwise (viewed from above). Square chips, or irregularly shaped chips with aspect ratios closer to 1, tended to rotate about an axis closer to their centers.
FIGURE 8.
Auto-mobile chips: car and wedge. (A) Time-lapse composite of a car-shaped piece of PDMS coated with bacterial carpet. Superimposed images were taken at 5 s intervals from right to left. The arrow marks the first image and direction of motion. (B) Rotation of a triangular piece of PDMS coated with bacterial carpet. The wedge rotates clockwise about one corner, which moves slightly as it drags on the surface below. These images were taken at 2 s intervals. The distance scale is the same as in A. (C) The bacterial carpet of A, containing a mixture of bacteria with long axes perpendicular to the surface (bright circles) or parallel to the surface (fainter oblongs). This carpet is on the upper surface of the PDMS chip (away from the bottom of the assay chamber).
DISCUSSION
We created active bacterial carpets that move fluids over an area of 3 cm2 and a depth of ∼50 μm. The carpets were made by blotting PDMS-coated glass onto a petri plate of swarming S. marcescens. Both swarms and carpets were robust and easy to prepare, and the blot-transfer process consistently gave dense, uniform carpets. Carpets formed from suspensions of such cells were less dense (data not shown), suggesting that bacterial wastes in the buffer compete for available PDMS binding sites. Surprisingly, the surfactants produced by swarming S. marcescens (Matsuyama et al., 1992) do not prevent cell adhesion, except at the extreme leading edge of the swarm. Carpets can also be made on glass, although they are less robust. S. marcescens bound equally well to native (hydrophobic) PDMS and to oxygen-plasma-treated (hydrophilic) PDMS. It seems that binding depends more on the bacterial surface than on the underlying substrate, as E. coli failed to bind to any of these surfaces, and S. typhimurium was little better.
The bulk diffusion coefficient (Dbulk = 0.52 μm2/s) is a property of the 1 μm spheres used as tracer particles, whereas the surface diffusion coefficient (Dsurface = 19 μm2/s) is a property of the carpet itself. Since diffusion coefficients for small molecules are ∼1000 μm2/s, this active surface is not competitive with passive diffusion for salts, amino acids, or sugars, but it is potentially useful with macromolecules. Any object larger than 10 nm could benefit from the active mixing of such a carpet. Since the variation in D over different areas of the same carpet was quite large and comparable to the variation among carpets, we could not identify any differences in surface activity due to the position of carpet fabrication on the swarm plate or to the style of cell attachment. The total depth of fluid affected by the carpet is ∼50 μm, with a half-depth of 10 μm. This is reasonably consistent with either flagellar length or whirlpool size, which are the two length scales that could influence the height dependence of the flow field.
The measured correlation time is τsurface = 0.09 s. From the relation  , the rms speed of fluid just above the carpet is ∼15 μm/s, which compares favorably with the S. marcescens swimming speed of 47 μm/s. As this swimming speed is probably the best achievable fluid-pumping speed, improvements in carpet-making technique could increase
  by up to a factor of 3 (a factor of 9 in D). There is no such upper limit on the correlation time, so boosting τ could increase D much further. We might improve coordination among flagella by increasing the flagellar density, using a S. marcescens strain that spins its flagella exclusively in one direction, adding an attractant to lengthen the period between motor reversals, or reducing the depth of the fluid to be mixed. All of these should increase the typical size of the surface flow patterns, producing a corresponding increase in correlation time.
Fluid flow above the active surface seems to consist of many “whirlpools”, rotating both clockwise and counterclockwise, which are typically 10–15 μm in diameter. These whirlpools are not correlated with the pattern of the underlying cell bodies in the carpet. The simplest explanation of whirlpool size is that it is produced by a rotating flagellum (or flagella) sticking straight up into the fluid. The velocity induced by a rotating flagellum should decrease with radial distance r as  , where
  μm is the radius of the flagellar helix (Higdon, 1979). The peak speed of
  occurs at
  , where
  Hz is the flagellum rotation rate. At a distance of 3 μm, this idealized flagellum would create a flow of
  μm/s. At the same distance, a real whirlpool produces a flow of 9 μm/s that does fall off reasonably like
  (data not shown). This suggests that a whirlpool could be created by a small number of coordinated flagella aligned predominantly normal to the carpet surface. The 10 μm/s flow field that orients filaments in the carpet is consistent with bacterial locomotion: a swimming speed of just a few μm/s causes randomly oriented flagella to stream behind the cell and rebundle (Turner et al., 2000). Rivers of flow are often several times the length of any relevant bacterial dimension (including the typical flagellum length of 10 μm). Both rivers and whirlpools persist many times longer than the typical bundle lifetime during normal swimming. All of these observations lead us to suspect that we have achieved coordination among a handful of flagella at a time, although as yet we have no direct evidence of this.
Under our temperature and buffer conditions, S. marcescens swims at ∼47 μm/s. If we approximate its cell body as a 1 μm diameter sphere, then one bacterium attached end-on should be able to move a 10 μm sphere (our auto-mobile bead) 4.7 μm/s (since the viscous drag on a sphere is proportional to its radius). From Stokes' law, this works out to a thrust of ∼0.5 pN. One bacterium attached side-on, applying this propulsive force tangentially to the sphere's surface through a 5 μm lever arm, would rotate the bead 41°/s. The observed rms translational and rotational speeds of our auto-mobile bead were 4.7 μm/s and 59°/s, respectively. This can be explained by applying the propulsive force equivalent to one or two free-swimming bacteria (properly oriented).
In reality, a 10 μm bead captures ∼50 bacteria. If these 50 bacteria are randomly distributed over the surface, each pointing an average of four flagella in random directions, the net force and torque produced would be zero. We actually observe frequent pauses and reversals of motion that are caused by statistical fluctuations among flagella orientations. We expect to see temporary imbalances of ∼ flagella that transiently produce a net force and torque. This is equivalent to three or four free-swimming bacteria. The estimate of the previous paragraph is slightly lower than this, probably because a bacterium that is stuck to a surface cannot deliver as much thrust as one that is swimming freely. The reduction in propulsive power could be caused by flagella sticking to the bead surface or breaking during fabrication, or by increased drag against the large nearby bead surface. As the latter would be a more fundamental problem with our technique, we are currently working to understand the relevant hydrodynamics.
Until we can coordinate larger numbers of flagella, the propulsive force F generated by N bacteria attached to an object of size L will scale like  ; since
  , we expect
  . Meanwhile, the low Reynolds number drag also scales like L, so the typical speed should be roughly independent of size. Indeed, the auto-mobile chip pictured in Fig. 8, A, is almost 10 times the size of the auto-mobile bead, but moves at the same speed.
Acknowledgments
This work is part of a collaborative effort with Thomas Powers (Brown University) and Greg Huber (University of Massachusetts). We thank them for many insightful conversations. We thank Rasika Harshey for her gift of S. marcescens strains and for her critical reading of the manuscript, and Svetlana Rojevskaya for her expert technical assistance.
This work was supported by the Defense Advanced Research Projects Agency/Office of Naval Research Biomolecular Motors Program (contract No. N66001-02-C-8029) and by the Rowland Institute at Harvard.
Nicholas Darnton and Linda Turner contributed equally to this work.
References
- Alberti, L., and R. M. Harshey. 1990. Differentiation of Serratia marcescens 274 into swimmer and swarmer cells. J. Bacteriol. 172:4322–4328. [DOI] [PMC free article] [PubMed] [Google Scholar]
- Beebe, D. J., G. A. Mensing, and G. A. Walker. 2002. Physics and applications of microfluids in biology. Annu. Rev. Biomed. Eng. 4:261–286. [DOI] [PubMed] [Google Scholar]
- Berg, H. C. 2003. The rotary motor of bacterial flagella. Annu. Rev. Biochem. 72:19–54. [DOI] [PubMed] [Google Scholar]
- Berg, H. C., and R. A. Anderson. 1973. Bacteria swim by rotating their flagellar filaments. Nature. 245:380–382. [DOI] [PubMed] [Google Scholar]
- Berg, H. C., and S. M. Block. 1984. A miniature flow cell designed for rapid exchange of media under high-power microscope objectives. J. Gen. Microbiol. 130:2915–2920. [DOI] [PubMed] [Google Scholar]
- Enos-Berlage, J. L., and L. L. McCarter. 2000. Relation of capsular polysaccharide production and colonial cell organization to colony morphology in Vibrio parahaemolyticus. J. Bacteriol. 182:5513–5520. [DOI] [PMC free article] [PubMed] [Google Scholar]
- Falke, J. J., R. B. Bass, S. L. Butler, S. A. Chervitz, and M. A. Danielson. 1997. The two-component signaling pathway of bacterial chemotaxis: a molecular view of signal transduction by receptors, kinases, and adaptation enzymes. Annu. Rev. Cell Dev. Biol. 13:457–512. [DOI] [PMC free article] [PubMed] [Google Scholar]
- Fraser, G. M., and C. Hughes. 1999. Swarming motility. Curr. Opin. Microbiol. 2:630–635. [DOI] [PubMed] [Google Scholar]
- Harshey, R. M. 1994. Bees aren't the only ones: swarming in Gram-negative bacteria. Mol. Microbiol. 13:389–394. [DOI] [PubMed] [Google Scholar]
- Henrichsen, J. 1972. Bacterial surface translocation: a survey and a classification. Bacteriol. Rev. 36:478–503. [DOI] [PMC free article] [PubMed] [Google Scholar]
- Higdon, J. L. L. 1979. The generation of feeding currents by flagellar motions. J. Fluid Mech. 94:305–330. [Google Scholar]
- Jung, K.-H., E. N. Spudich, V. D. Trivedi, and J. L. Spudich. 2001. An archaeal photosignal-transducing module mediates phototaxis in Escherichia coli. J. Bacteriol. 183:6365–6371. [DOI] [PMC free article] [PubMed] [Google Scholar]
- Leifson, E. 1960. Atlas of Bacterial Flagellation. Academic Press, New York and London.
- Looger, L. L., M. A. Dwyer, J. J. Smith, and H. W. Hellinga. 2003. Computational design of receptor and sensor proteins with novel functions. Nature. 423:185–189. [DOI] [PubMed] [Google Scholar]
- Matsuyama, T., K. Kaneda, Y. Nakagawa, K. Isa, H. Hara-Hotta, and L. Yano. 1992. A novel extracellular cyclic lipopeptide which promotes flagellum-dependent and -independent spreading growth of Serratia marcescens. J. Bacteriol. 174:1769–1776. [DOI] [PMC free article] [PubMed] [Google Scholar]
- Purcell, E. M. 1977. Life at low Reynolds number. Am. J. Phys. 45:3–11. [Google Scholar]
- Quake, S. R., and A. Scherer. 2000. From micro- to nanofabrication with soft materials. Science. 290:1536–1540. [DOI] [PubMed] [Google Scholar]
- Reif, F. 1965. Statistical Physics. McGraw Hill, New York.
- Toguchi, A., M. Siano, M. Burkart, and R. M. Harshey. 2000. Genetics of swarming motility in Salmonella enterica serovar typhimurium: critical role for lipopolysaccharide. J. Bacteriol. 182:6308–6321. [DOI] [PMC free article] [PubMed] [Google Scholar]
- Turner, L., W. S. Ryu, and H. C. Berg. 2000. Real-time imaging of fluorescent flagellar filaments. J. Bacteriol. 182:2793–2801. [DOI] [PMC free article] [PubMed] [Google Scholar]
- van Kampen, N. G. 1992. Stochastic Processes in Physics and Chemistry. Elsevier Science Publishers, Amsterdam, The Netherlands.
- Whitesides, G. M., E. Ostuni, S. Takayama, X. Jiang, and D. Ingber. 2001. Soft lithography in biology and biochemistry. Annu. Rev. Biomed. Eng. 3:335–373. [DOI] [PubMed] [Google Scholar]


