Abstract
The basic effector domain of myristoylated alanine-rich C kinase substrate (MARCKS), a major protein kinase C substrate, binds electrostatically to acidic lipids on the inner leaflet of the plasma membrane; interaction with Ca2+/calmodulin or protein kinase C phosphorylation reverses this binding. Our working hypothesis is that the effector domain of MARCKS reversibly sequesters a significant fraction of the l-α-phosphatidyl-d-myo-inositol 4,5-bisphosphate (PIP2) on the plasma membrane. To test this, we utilize three techniques that measure the ability of a peptide corresponding to its effector domain, MARCKS(151–175), to sequester PIP2 in model membranes containing physiologically relevant fractions (15–30%) of the monovalent acidic lipid phosphatidylserine. First, we measure fluorescence resonance energy transfer from Bodipy-TMR-PIP2 to Texas Red MARCKS(151–175) adsorbed to large unilamellar vesicles. Second, we detect quenching of Bodipy-TMR-PIP2 in large unilamellar vesicles when unlabeled MARCKS(151–175) binds to vesicles. Third, we identify line broadening in the electron paramagnetic resonance spectra of spin-labeled PIP2 as unlabeled MARCKS(151–175) adsorbs to vesicles. Theoretical calculations (applying the Poisson-Boltzmann relation to atomic models of the peptide and bilayer) and experimental results (fluorescence resonance energy transfer and quenching at different salt concentrations) suggest that nonspecific electrostatic interactions produce this sequestration. Finally, we show that the PLC-δ1-catalyzed hydrolysis of PIP2, but not binding of its PH domain to PIP2, decreases markedly as MARCKS(151–175) sequesters most of the PIP2.
INTRODUCTION
Although PIP2 comprises only ∼1% of the phospholipids in a plasma membrane from a typical animal cell, it plays a key role in many cell-signaling pathways. Specifically, it is the source of three important second messengers (Berridge and Irvine, 1984; Payrastre et al., 2001; Cantley 2002; Vanhaesebroeck et al., 2001) and is involved in membrane trafficking (Czech, 2003; Cremona and De Camilli, 2001; Martin, 2001; Osborne et al., 2001; Simonsen et al., 2001); it also modulates several ion channels (Hilgemann et al., 2001; Runnels et al., 2002; Prescott and Julius, 2003), mediates cytoskeleton-membrane interaction (Yin and Janmey, 2003; Raucher et al., 2000), and regulates the activity of a variety of molecules (e.g., PLD (Sciorra et al., 2000); N-WASP (Lim, 2002). How does one lipid play so many different roles? We and others have hypothesized that proteins bind a significant fraction of the PIP2 in the plasma membrane, then release it locally in response to specific signals (Caroni, 2001; McLaughlin et al., 2002). Putative PIP2-sequestering proteins should satisfy three criteria: they must be present at concentrations comparable to PIP2, bind PIP2 with high affinity, and release it locally in response to specific stimuli such as an increase in the local calcium ion concentration.
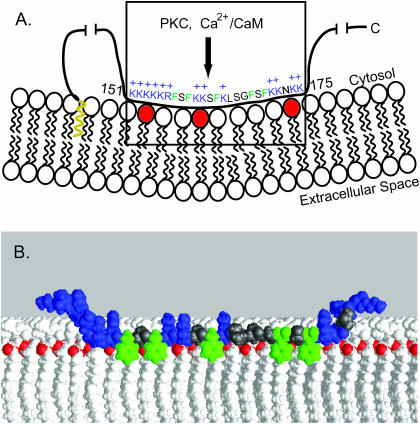
One such candidate is the myristoylated alanine-rich C kinase substrate (MARCKS) protein (Aderem, 1992; Blackshear, 1993; McLaughlin and Aderem, 1995; Arbuzova et al., 1998, 2002). Other viable candidates include GAP43 and CAP23 in neuronal tissue (Laux et al., 2000). As illustrated in Fig. 1 A, MARCKS is a natively unfolded protein that binds to the plasma membrane through hydrophobic insertion of its N-terminal myristate (shown in yellow) and electrostatic interaction of its basic effector domain with acidic lipids (shown in the box). The available evidence suggests that MARCKS may satisfy the three criteria listed above. First, MARCKS is present at high concentrations (∼10 μM) in neuronal and other tissues (Blackshear, 1993; Albert et al., 1987); all measurements to date indicate this is in the same range as the PIP2 concentration. PIP2 comprises 0.3–1.5% of the phospholipid in the plasma membrane of mammalian erythrocytes (Ferrell and Huestis, 1984; Hagelberg and Allan, 1990), lymphocytes (Mitchell et al., 1986), and hepatocytes (Tran et al., 1993); for a 10-μm cell, this corresponds to an effective concentration of PIP2 of 5–30 μM. Bunce et al. (1993) determined that the total concentration of PIP2 in human myeloid cells is ∼30 μM. Studies using GFP-PH domain constructs also suggest the effective concentration of PIP2 in cells is 2 < [PIP2] < 30 μM, as discussed elsewhere (McLaughlin et al., 2002). Second, a peptide corresponding to the effector domain, MARCKS(151–175), binds with high affinity to phospholipid vesicles containing a mixture of the zwitterionic lipid phosphatidylcholine (PC) and PIP2 (Arbuzova et al., 2000b; Wang et al., 2001, 2002; Rauch et al., 2002). As illustrated in Fig. 1 A, the effector domain interacts with approximately three PIP2 to form an electroneutral complex. This report provides evidence that MARCKS(151–175) can laterally sequester PIP2 in the presence of a significant excess of monovalent acidic lipids. Third, the sequestration of PIP2 can be reversed by protein kinase C (PKC) phosphorylation or by interaction with calcium/calmodulin (Ca2+/CaM). Introduction of three negatively charged phosphates by PKC or binding of Ca2+/CaM causes translocation of both the MARCKS protein (Kim et al., 1994) and MARCKS(151–175) (Arbuzova et al., 1998) from the membrane to solution by diminishing its electrostatic binding to acidic phospholipids. The translocation of the native MARCKS protein from the plasma membrane due to PKC phosphorylation or Ca2+/CaM binding has been observed in vivo (Swierczynski and Blackshear, 1995; Ohmori et al., 2000; J. Sable and M. P. Sheetz, Columbia University, personal communications).
FIGURE 1.
(A) Cartoon of the “natively unfolded” MARCKS protein, shown as a black line, interacting with the inner leaflet of the plasma membrane. The N-terminal myristate, shown in yellow, inserts hydrophobically into the bilayer. The MARCKS effector domain (residues 151–175 of bovine MARCKS, shown in the box) interacts electrostatically with acidic lipids (3 PIP2 shown in red) through its 13 basic residues (in blue with + signs) and hydrophobically through its five aromatic residues (in green). (B) Molecular model of a peptide corresponding to the MARCKS effector domain overlaid on a molecular model of a bilayer membrane. Experimental evidence (see text) shows that the peptide is located at the polar headgroup region in an extended conformation; the five aromatic phenylalanine residues (colored green) penetrate to the level of the acyl chains, and the highly charged N-terminal region (basic residues colored blue) is in the aqueous phase. The lipids are shown in white with the carbonyl oxygen atoms colored red to illustrate the interface between the headgroup region and the hydrocarbon interior of the membrane. The extended peptide is ∼9 nm in length.
Structural studies have revealed how a peptide corresponding to the MARCKS effector domain interacts with both Ca2+/CaM and membranes. The crystal structure of the peptide-Ca2+/CaM complex reveals the peptide is highly elongated, with a “short one-turn helix surrounded by two loops” (Yamauchi et al., 2003). More relevant to the work reported here, recent structural studies support the molecular model of MARCKS(151–175) overlaid on a bilayer shown in Fig. 1 B. Specifically, electron paramagnetic resonance (EPR) (Qin and Cafiso, 1996) and circular dichroism (Wang et al., 2001) studies indicate the effector domain peptide is unstructured and elongated, both in solution and when bound to a membrane. EPR (Qin and Cafiso, 1996; Victor et al., 1999) and high resolution NMR experiments in bilayers (Zhang et al., 2003) and bicelles (Ellena et al., 2003) demonstrate that the five phenylalanine residues (shown in green in Fig. 1 B) penetrate into the acyl chain region of the bilayer. This penetration must drag the backbone of the adjacent residues deep into the polar headgroup region; the charges on these basic residues may “snorkel” up to the water-polar headgroup interface as illustrated in Fig. 1 B (Segrest et al., 2002; Strandberg et al., 2002). Available EPR evidence (Qin and Cafiso, 1996) suggests that the highly charged cluster of basic residues at the N-terminus is in the water phase, as expected from Born energy considerations and seen experimentally for adsorbed pentalysine peptides (Roux et al., 1988). The basic cluster at the C-terminus is also shown in the water phase in Fig. 1 B.
Arbuzova et al. (1998) discuss the evidence that the MARCKS(151–175) peptide is a good model for studying the interaction of MARCKS with membranes. For example, the peptide binds Ca2+/CaM with the same high (∼4 nM) affinity as the intact protein and contains the three serine residues phosphorylated by PKC; either binding of Ca2+/CaM or phosphorylation by PKC produce translocation of both protein and peptide from membrane to solution. There is strong evidence that the MARCKS(151–175) peptide binds with high affinity to PIP2/PC vesicles by electrostatically sequestering approximately three PIP2 (Wang et al., 2002; Rauch et al., 2002). There is only indirect evidence, however, that the effector domain can sequester PIP2 when the membrane contains a physiological mol fraction of monovalent acidic lipids (i.e., 15–30% phosphatidylserine (PS) (White, 1973; Yorek, 1993)); specifically, both MARCKS and MARCKS(151–175) inhibit the PLC-catalyzed hydrolysis of PIP2 in vesicles or monolayers containing both PS and PIP2 (Murray et al., 2002; Wang et al., 2002). We have used three different techniques, fluorescence resonance energy transfer (FRET), quenching, and EPR, to obtain more direct evidence that the effector domain of MARCKS can sequester PIP2 when PS is present.
We first measured FRET between labeled MARCKS(151–175) and PIP2 using PC/PS/PIP2 vesicles containing 0.1% PIP2 and up to 30% PS. We eliminated the possibility that sequestration of PIP2 is due to probe-probe interactions by measuring the effect of unlabeled MARCKS(151–175) on the quenching of fluorescent PIP2 and on the EPR spectra of spin-labeled PIP2 in these PC/PS/PIP2 vesicles.
Calculations using atomic-level models of bilayers and adsorbed basic peptides show that the peptides produce a local positive electrostatic potential, even when the membrane contains 30% monovalent acidic lipid; this positive potential should electrostatically sequester the multivalent acidic lipid, PIP2. To test that the sequestration is due to electrostatics, we measured the effect of increasing the salt concentration on lateral sequestration.
Aromatic Phe residues embedded within a basic peptide drag the adjacent basic residues into the polar headgroup region (Fig. 1 B). Our electrostatic model predicts that this should increase the positive potential produced by the peptide when it adsorbs to the bilayer. Hence, aromatic residues should enhance PIP2 sequestration. To test this prediction, we compare the PIP2 sequestration produced by MARCKS(151–175) versus FA-MARCKS(151–175), a peptide synthesized with alanine residues substituted for phenylalanine (Table 1).
TABLE 1.
Sequences of peptide
| Peptide | Sequence |
|---|---|
| MARCKS(151–175) | Ac-KKKKKRFSFKKSFKLSGFSFKKNKK-NH2 |
| FA-MARCKS(151–175) | Ac-KKKKKRASAKKSAKLSGASAKKNKK-NH2 |
| Lys-13 | Ac-KKKKKKKKKKKKK-NH2 |
| Lys-7 | Ac-KKKKKKK-NH2 |
Basic (lysine or arginine) residues are in bold. Aromatic (phenylalanine) residues are underlined. The N-terminus of each peptide is blocked with an acetyl group (Ac-) and the C-terminus is blocked with an amide group (-NH2). For fluorescent probe labeling, peptides were synthesized with a cysteine residue at the N-terminus. The sequence for MARCKS(151–175) shown here is identical for bovine (151–175) and murine (145–169) MARCKS effector domains.
Finally, we explored the effect of this sequestration on the activity and membrane binding of phosphoinositide specific phospholipase C (PLC). The five PLC families (Berridge et al., 2003; Rhee, 2001; Rebecchi and Pentyala, 2000; Williams and Katan, 1996) catalyze the hydrolysis of PIP2 to two important second messengers, IP3 and DAG (Berridge and Irvine, 1984). We first tested whether sequestration of PIP2 by MARCKS(151–175) inhibits PLC-δ1 activity, then examined how sequestration affects the membrane binding of the PLC-δ1 PH domain, which anchors the enzyme to the plasma membrane by forming a specific 1:1 complex with PIP2 (Ferguson et al., 1995; Lemmon, 2003).
MATERIALS AND METHODS
Materials
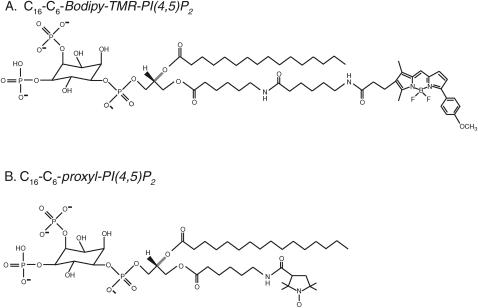
Fig. 2 shows the structures of the fluorescent and spin-labeled PIP2 lipids that we used in these studies. Bodipy-TMR-PIP2 (Fig. 2 A) was purchased from Echelon (Salt Lake City, Utah) as a triethylammonium salt. 1-Palmitoyl-2-oleoyl-sn-glycero-3-phosphatidylcholine (PC), 1-palmitoyl-2-oleoyl-sn-glycero-3-phosphatidylserine, and the ammonium salt of PIP2 were purchased from Avanti Polar Lipids (Alabaster, AL). Radioactively labeled [dioleoyl-1-14C]-l-α-dioleoyl-phosphatidylcholine (14C-DOPC) and [inositol-2-3H(N)]-l-α-phosphatidyl-d-myo-inositol 4,5-bisphosphate (3H-PIP2) were from Perkin Elmer Life Sciences (Boston, MA). Texas Red C5 bromoacetamide, Bodipy-507 iodoacetamide, Oregon Green 488 maleimide, fluorescein-5-iso-thiocyanate (FITC), and N-(6- tetramethylrhodaminethiocarbamoyl)-1,2-dihexadecanoyl-sn-glycero-3- phosphoethanolamine (TRITC-PE) were from Molecular Probes (Eugene, OR). The Molecular Probes catalog illustrates the structures of these fluorescent probes. FITC-labeled neomycin (Arbuzova et al., 2000a) was obtained from Glenn Prestwich (Echelon). Recombinant human PLC-δ1 was purified from Escherichia coli as described elsewhere (Garcia et al., 1995). The EGFP-PLC-δ1 PH domain construct (EGFP-PH domain) was prepared in E. coli as described elsewhere (Pentyala et al., 2003; Tall et al., 2000).
FIGURE 2.
Molecular structures of (A) Bodipy-TMR-PIP2 and (B) proxyl-PIP2 .
Peptides
All peptides, listed in Table I, were obtained from American Peptide Company (Sunnyvale, CA). The final labeled or unlabeled peptides used for experiments were determined to be >95% pure by HPLC and MALDI-TOF mass spectroscopy.
Peptide labeling
We used a protocol modified from “Conjugation with Thiol-Reactive Probes” (Molecular Probes) to label peptides with the thiol-reactive fluorescent probes. In brief, we mixed 1 ml of ∼1 mM peptide in 10 mM K2HPO4/KH2PO4, pH 7.0 with the probe dissolved in N,N′-dimethylformamide (probe-to-peptide molar ratio of ∼1:1) for 1 h. We purified the labeled peptide using high-performance liquid chromatography and checked that it has the correct molecular weight using MALDI-TOF mass spectrometer (Proteomics Center, SUNY at Stony Brook, Stony Brook, NY).
Vesicle preparations
We used 100-nm diameter large unilamellar vesicles (LUVs) for the FRET, self-quenching, PLC-δ1 hydrolysis, and centrifugation binding experiments, as described in detail elsewhere (Wang et al., 2002). Briefly, we added solutions of PIP2 (or Bodipy-TMR-PIP2), PS, and PC in chloroform to a 50-ml round-bottom flask, which was then well immersed in a 30–35°C water bath and attached to a rotary evaporator. The flask was rotated without vacuum for ∼5 min to warm the flask and solution. We then rapidly evaporated most of the solvent by applying the maximum vacuum that does not boil the chloroform. (Rapid evaporation is required to produce a uniform mixture of PC, PS, and PIP2 because PIP2 is less soluble in chloroform than either PC or PS.) The flask was kept under full vacuum for ≥30 min to remove all traces of chloroform. A solution containing 100 mM KCl, 1 mM MOPS, pH 7.0 was added for most of our experiments. Subsequently, we rapidly froze and thawed the multilamellar vesicles five times. Finally, we formed LUVs by extrusion of the multilamellar vesicles through 100-nm diameter polycarbonate filters. (A solution containing 176 mM sucrose, 1 mM MOPS, pH 7.0 was added to make sucrose-loaded LUVs for centrifugation binding measurements. The solution bathing the LUVs was then exchanged for 100 mM KCl, 1 mM MOPS, pH 7.)
Preparation of lipid vesicles for EPR spectroscopy
LUVs (100 nm) were prepared as described previously by mixing appropriate volumes of stock solutions of POPC and POPS in chloroform, drying the lipid mixtures under vacuum, hydration of the lipid in 100 mM KCl, 10 mM MOPS, pH 7.0 followed by extrusion through 100-nm pore size polycarbonate filters (Rauch et al., 2002). The spin-labeled proxyl-PIP2 (shown in Fig. 2 B; provided by G. Prestwich and C. Ferguson, Echelon, Salt Lake City, UT) was incorporated into the outer leaflet of the vesicles by adding the lipid vesicle suspension to a dried film of labeled lipid. As discussed previously, this procedure resulted in incorporation of the proxyl-PIP2 into the outer leaflet of the vesicle bilayer (Rauch et al., 2002).
FRET experiments
FRET and other fluorescence experiments were performed on an SML-AMINCO spectrofluorometer. FRET experiments used LUVs prepared with 0.1% Bodipy-TMR-PIP2 (shown in Fig. 2 A) incorporating varying mol fractions of POPS and POPC. We excited the donor fluorophore and collected the complete emission spectra. When Bodipy-TMR-PIP2 was the donor and Texas Red MARCKS(151–175) the acceptor, we excited at 547 nm and collected emission spectra from 560 to 660 nm. Direct binding measurements using the centrifugation technique (not shown) allowed us to choose a sufficiently high lipid concentration so that essentially all the peptide we added was bound to the LUVs; we monitored FRET as peptide was added to the solution containing the LUVs. We deconvoluted the data by performing a four-parameter two-peak Lorentzian fit keeping the peak wavelengths fixed at 571 nm for the Bodipy-TMR-PIP2 and at 607 nm for Texas Red MARCKS(151–175). After checking the quality of fit, we used the peak amplitudes and full width at half-maximum amplitude for each peak to calculate the fluorescence intensity. The energy transfer efficiency, % transfer, was analyzed by calculating the quenching of the fluorescence intensity of the donor,
 |
(1) |
where Ida is the donor fluorescence intensity determined at the given excitation wavelength, λ, in the presence of the acceptor, and Id is the corresponding intensity in the absence of the acceptor. The % transfer was also determined by calculating the fluorescence intensity of the acceptor,
 |
(2) |
where ɛad is the absorbance of the acceptor when donor is present; ɛda is the absorbance of the donor when acceptor is present; λ1 is the peak absorbance wavelength of the donor; Iad is the intensity determined at the acceptor wavelength, λ2, in the presence of the donor; and Ia is the corresponding intensity in the absence of the donor (Berney and Danuser, 2003; Lakowicz 1999; Van Der Meer et al., 1994).
We performed two control measurements to estimate effects due to probe-probe interactions and other artifacts. First, we replaced fluorescent PIP2 with TRITC-PE, a zwitterionic lipid that should not be sequestered by fluorescent MARCKS(151–175) and should not exhibit FRET. TRITC is a rhodamine analog that has excitation and emission spectra comparable to the Bodipy-TMR. Second, we added 1–5 nM of PLC-δ1 to hydrolyze the Bodipy-TMR-PIP2 on the same vesicles used to perform FRET experiments. The amount of FRET was remeasured on these hydrolyzed vesicles.
We performed FRET experiments with vesicles containing 0.1% or 1% fluorescent PIP2. We note, however, that random interactions produced significant energy transfer when Texas-Red-labeled peptide bound to vesicles containing 1% fluorescent PE (an electrostatically neutral lipid that should not bind to the basic peptides) instead of fluorescent PIP2. This is expected because, for a vesicle containing 1% fluorescent lipid, the average distance between a fluorophore on the lipid and a fluorophore on the peptide is ∼50 Å, which is approximately the Ro value for the fluorophores we used (Fluorescence Resonance Energy Transfer in Molecular Probes Handbook). For a vesicle containing 0.1% fluorescent lipid, the average distance between the fluorophores on the peptide and lipid is ∼160 Å; thus, FRET measurements of lateral interaction are more informative at the lower PIP2 concentration. Moreover, measurements using 0.1% PIP2 are a more stringent test of our hypothesis that much of the PIP2 is sequestered under physiological conditions.
Quenching experiments
Bodipy-TMR-PIP2 was excited at 547 nm and emission spectra were recorded from 560 to 660 nm in the presence of different concentrations of unlabeled peptide. We calculated the % quenching as described above using Eq. 1 (Berney and Danuser, 2003; Lakowicz 1999; Van Der Meer et al., 1994). The vesicle concentration was sufficiently high that essentially all the peptide added to the solution bound to the membrane. We excluded quenching artifacts by performing control experiments on vesicles in which the negatively charged Bodipy-TMR-PIP2 was replaced with zwitterionic or neutral fluorescent lipids (TRITC-PE or Bodipy-TMR-DAG), as discussed in the FRET section above.
The average distance between PIP2 molecules is ∼100 Å and ∼300 Å in vesicles containing 1% and 0.1% PIP2, respectively; the Ro value of the Bodipy-TMR probe is ∼50 Å, so self-quenching should be negligible in the absence of peptide. Indeed, for ≤1% Bodipy-TMR-PIP2, fluorescence increases linearly with the % labeled PIP2 in the vesicles. We observed qualitatively similar results in experiments performed with vesicles containing either 1% or 0.1% Bodipy-TMR-PIP2, but present data only for the vesicles with 1% Bodipy-TMR-PIP2, where the effect was more pronounced.
EPR spectroscopy
EPR spectra were recorded at X-band from ∼5 μL of sample using a Varian E-line Century series spectrometer fitted with a MITEQ microwave amplifier (Hauppauge, NY) and a two-loop one-gap resonator (Medical Advances, Milwaukee, WI). Spectra were recorded using a modulation of 1 Gauss peak-to-peak and microwave power of ≤2 mW.
EPR spectra with titration of MARCKS(151–175) were performed by adding concentrated solutions of the peptide to ∼100 μL of a 7–20 mM lipid vesicle suspension with 0.25–0.85 mol% proxyl-PIP2 incorporated into the outer leaflet. Spectra were recorded by withdrawing a small sample of the vesicle suspension into the loop-gap resonator as described previously (Rauch et al., 2002). The binding of MARCKS(151–175) to proxyl-PIP2 was analyzed by recording the amplitude of the first derivative peak-to-peak EPR spectrum.
Measurement of PIP2 Hydrolysis
We previously reported that MARCKS and a peptide corresponding to its effector domain inhibit PLC-catalyzed PIP2 hydrolysis (Wang et al., 2001, 2002; Murray et al., 2002). In those experiments, however, the vesicles or monolayers contained 1% PIP2 and a high concentration of protein or peptide was needed to inhibit the hydrolysis. The experiments reported here used vesicles containing only 0.1% PIP2, allowing us to use lower concentrations of peptide and minimize effects other than PIP2 sequestration (for example, effects due to the insertion of Phe residues into the acyl chain region of the bilayer or to the charges on the peptide decreasing the net negative charge of the PC/PS/PIP2 bilayer).
We added PLC-δ1 to vesicles containing 3H-PIP2 and terminated hydrolysis at different times by adding 375 μl ice-cold 10% trichloroacetic acid and 50 μl 10% Triton X-100 to 75 μl of the reaction mixture, then incubating the samples on ice until a white precipitate formed. The samples were then centrifuged at 14,000 × g for 5 min and the supernatant was mixed with 1 ml of chloroform/methanol (2:1 volume ratio); subsequently, the upper phase containing the 3H-IP3 products was transferred to a scintillation vial for counting.
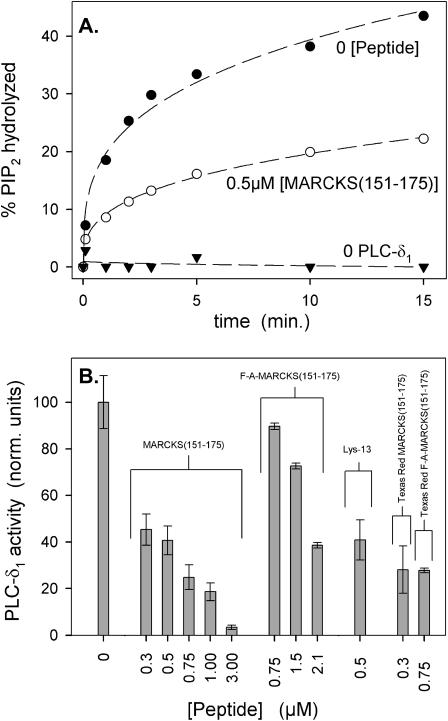
Data were analyzed by first plotting the % PIP2 hydrolyzed versus time (Fig. 13 A). We obtained the rate of hydrolysis or PLC-δ1 activity by calculating the initial (first 2–3 min) slopes from the time curves of individual experiments. Because PLC-δ1 activity varies from one day to the next, we normalized the activity to controls where no peptide was present; the data in Fig. 13 B are averages of normalized activity from individual experiments.
FIGURE 13.
Inhibition of PLC-δ1-catalyzed hydrolysis of PIP2 by peptides that sequester PIP2. (A) The % accessible PIP2 hydrolyzed versus time after addition of PLC-δ1. These data are for zero peptide (•) and 0.5 μM MARCKS(151–175) (○). A control with no PLC shows no hydrolysis (▾), as expected. The results illustrate the average of six separate experiments. (B) Bar graph of relative PLC-δ1 activity, calculated from the initial slopes of hydrolysis versus time curves similar to those shown in A. These bars represent an average of six experiments (±SD) for each peptide. LUVs were composed of PC/PS/3H-PIP2 (83:17:0.15); 0.2 mM total lipid concentration. Solution contains 100 mM KCl, 25 mM HEPES, 100 μM EGTA, 102 μM CaCl2 (∼5 μM free Ca2+), 2 mM DTT, ∼10 nM PLC-δ1, pH 7.0.
Binding experiments with EGFP-PH domain and FITC-neomycin
We measured the binding of EGFP-PH domain or FITC-neomycin to sucrose-loaded PC/PIP2 LUVs using the centrifugation technique described previously (Buser and McLaughlin, 1998). The technique gives results similar to other techniques used to study binding of peptide to membrane (Simon and McIntosh, 2002). Briefly, sucrose-loaded PC/PIP2 LUVs were mixed with trace concentrations of labeled peptide or protein (typically 5–20 nM), and the mixture was centrifuged at 100,000 × g for 1 h. We calculated the percentage of peptide or protein bound by comparing fluorescence in the supernatant and the pellet. Measurements of the binding to PC vesicles containing 1%, 0.1%, or 0.03% PIP2 are consistent with the formation of a 1:1 complex (Ferguson et al., 1995) and show that the EGFP-PH domain binds to PIP2 with a Kd of 1.6 ± 0.4 μM (data not shown). We measured a similar value for the Kd when we used 5:1 PC:PS vesicles with 1% PIP2. This Kd value is consistent with the value in literature for the PH domain of PLC-δ1 (Harlan et al., 1994; Lemmon et al., 1995; Garcia et al., 1995). A minor problem with our EGFP-PH domain construct is that it aggregates, and some resulting multimers are in the pellet. We attempted to diminish these problems by precentrifuging the EGFP-PH domain and using the primarily monomeric EGFP-PH domain from the supernatant; we also used a low concentration of detergent 0.0065% Triton X-100, which does not destroy the vesicles (Buser et al., 1994), to solubilize the EGFP-PH in our experiments.
Electrostatic calculations
Electrostatic potentials and free energies are obtained from a modified version of the DelPhi program (Gallagher and Sharp, 1998) that solves the nonlinear Poisson Boltzmann (PB) equation for protein/membrane systems (Ben-Tal et al., 1996). DelPhi produces finite difference solutions to the PB equation (the FDPB method) for a system where the solvent is described in terms of a bulk dielectric constant and concentrations of mobile ions, whereas solutes (here, basic peptides, the PLC-δ1 PH domain, PIP2, and phospholipid membranes) are described in terms of the coordinates of the individual atoms as well as their atomic radii and partial charges (Brooks et al., 1983; Peitzsch et al., 1995).
The application to the PIP2/peptide/membrane systems considered here is described in more detail in our companion computational paper (Wang et al., 2003). PIP2 is assumed to have a valence of −4 and the basic peptides are assumed to be in their minimum free-energy orientations as determined for the interaction with PC/PS bilayers in 0.1 M KCl in the absence of PIP2; i.e., it is assumed that the interaction with PIP2 does not affect the orientation of the basic peptides at the membrane surface. The structure of the PH domain from PLC-δ1 (Ferguson et al., 1995) was used in the calculation of the electrostatic potentials illustrated in Fig. 15. The electrostatic potentials depicted in Figs. 12 and 15 were calculated by solving the nonlinear PB equation (Gallagher and Sharp, 1998) and visualized in GRASP (Nicholls et al., 1991).
FIGURE 15.
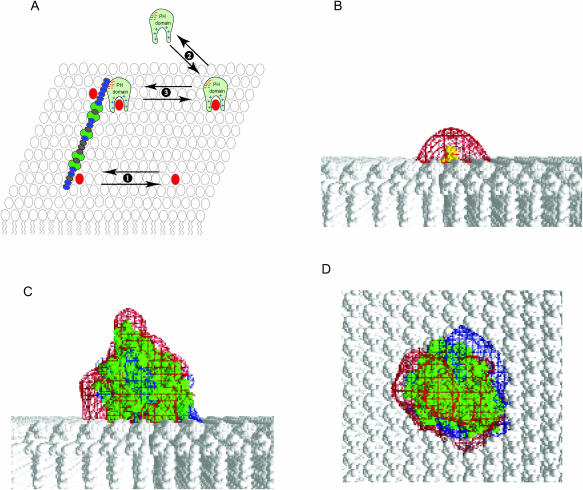
MARCKS(151–175) laterally sequesters the PIP2-bound PH domain of PLC-δ1 as well as PIP2. (A) See text for description of cartoon. Equilibrium 1: membrane-bound MARCKS(151–175) (blue ovals represent the 13 basic residues; green ovals the five phenylalanine residues) laterally sequesters PIP2 (red). Equilibrium 2: The PLC-δ1 PH domain (light green) binds to PIP2 (red) with high specificity; PIP2 forms multiple hydrogen bonds with positively charged residues (blue + signs) in the binding pocket. Equilibrium 3: We propose that the PIP2-bound PH domain, which contains a patch of acidic residues (red − signs) on its surface, is (like PIP2) sequestered electrostatically by the membrane-bound MARCKS(151–175). Panel B shows the potential produced by PIP2 (yellow) on a PC membrane. Panel C shows the potential produced by PIP2-bound PH domain (green) on a PC membrane as viewed from the side. Panel D illustrates the view from the top of the membrane: −25 mV and +25 mV potential profiles are shown in red and blue; salt concentration = 100 mM.
FIGURE 12.
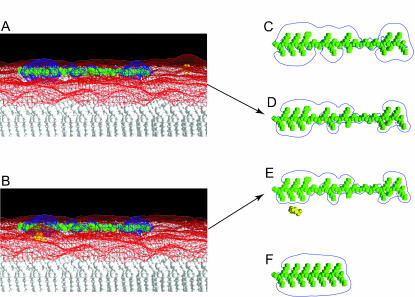
Electrostatic potentials produced by basic peptides FA-MARCKS(151–175) or Lys-13. (A) FA-MARCKS(151–175) (colored green) binds to a 5:1 PC/PS membrane; a single PIP2 (colored yellow) is visible far from the peptide in the upper right-hand side of the bilayer. The blue and red meshes show +25 and −25 mV equipotential profiles. (B) FA-MARCKS(151–175) binds to a 5:1 PC/PS membrane and sequesters a PIP2. (C) FA-MARCKS(151–175) in 100 mM KCl solution. The blue line shows a two-dimensional representation of the +25 mV equipotential profile. In panels D, E, and F the peptide is adsorbed to a 5:1 PC/PS bilayer and viewed from above. For clarity, we do not show the membrane and −25 mV potential profile. (D) FA-MARCKS(151–175) binds to a 5:1 PC/PS membrane; (E) membrane-bound FA-MARCKS(151–175) sequesters a PIP2; (F) membrane-bound Lys-13.
Preparation of giant vesicles for microscopy
Giant unilamellar vesicles for microscopy studies were prepared using a gentle hydration method (Akashi et al., 1996). An appropriate lipid mixture in chloroform was dried in a flask on a rotary evaporator under vacuum for 30 min to form a thin film. The dried film was prehydrated for 20 min with water-saturated argon at 40°C, and 1–4 ml of buffer solution was gently added to the flask. The sealed flask was incubated at room temperature for 12 h, and 100–200 μl of the upper part of the solution was harvested and used for microscopy studies. Images were obtained using a fixed stage microscope (Axioskop, Carl Zeiss, Göttingen, Germany), Plan-NEOFLUOR 63×-oil objective (Carl Zeiss), and Micro-Max Princeton CCD camera (Princeton Instruments, Trenton, NJ). The Texas Red fluorescence was measured using a short band-pass filter set XF43 from Omega Optical (Brattleboro, VT): exciter 580DF27 nm, beam splitter 600 nm, and emitter 630DF30 nm.
RESULTS
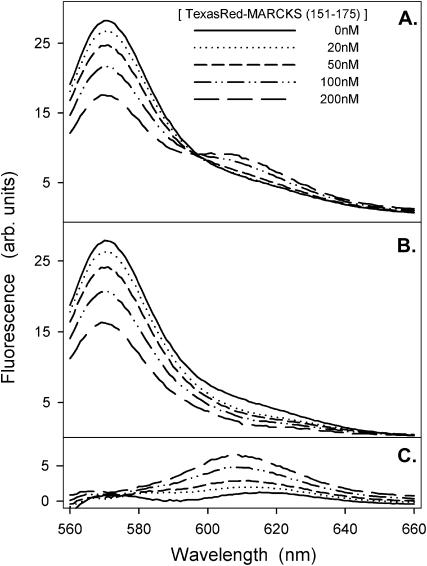
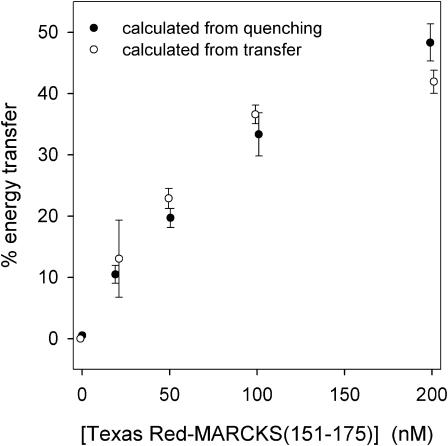
FRET shows membrane-bound MARCKS(151–175) sequesters PIP2, even when the vesicles contain a 300-fold excess of PS. Fig. 3 A shows energy transfer from Bodipy-TMR-PIP2 to membrane-bound Texas Red MARCKS(151–175) as the peptide concentration increases from 0 to 200 nM. Fig. 3, B and C, show the deconvoluted, emission spectra of the two fluorophores. As the peptide concentration increases, the donor (Bodipy-TMR-PIP2) fluorescence decreases (Fig. 3 B) and the acceptor fluorescence increases (Fig. 3 C). Fig. 4 shows the % energy transfer calculated using both the quenched Bodipy-TMR fluorescence (•) and the energy transferred Texas Red fluorescence (○) data. The two calculations agree, as they should. These experiments illustrate that the Bodipy-TMR-PIP2 transfers energy effectively to membrane-bound Texas Red MARCKS(151–175) on LUVs containing 30% monovalent acidic lipids, suggesting that the basic peptide sequesters the multivalent acidic lipid PIP2 under physiological conditions (i.e., 300-fold excess PS).
FIGURE 3.
FRET from Bodipy-TMR-PIP2 to membrane-bound Texas Red MARCKS(151–175). The LUVs are formed from PC/PS/Bodipy-TMR-PIP2 (70:30:0.1). The total lipid concentration is 0.75 mM; approximately all the peptide is bound to the LUVs. Bodipy-TMR-PIP2 is excited at 547 nm. (A) Representative corrected emission spectra for the peptide concentrations indicated. Spectra are deconvoluted to two peaks: (B) the quenching of Bodipy-TMR-PIP2, centered at 571 nm, and (C) the energy transfer to Texas Red MARCKS(151–175), centered at 607 nm. The solutions in these experiments, and in those shown in the following figures (except Figs. 9 and 13), contain 100 mM KCl, 1 mM MOPS, pH 7.0.
FIGURE 4.
The % energy transfer versus concentration of Texas Red MARCKS(151–175). We calculate the % energy transfer from the quenching data (•) in Fig. 3 B and similar experiments, or from the energy transferred data (○) in Fig. 3 C and similar experiments. All subsequent energy transfer results are calculated using the quenching spectra. Each point shown in the graph is an average of ≥7 separate experiments (±SD).
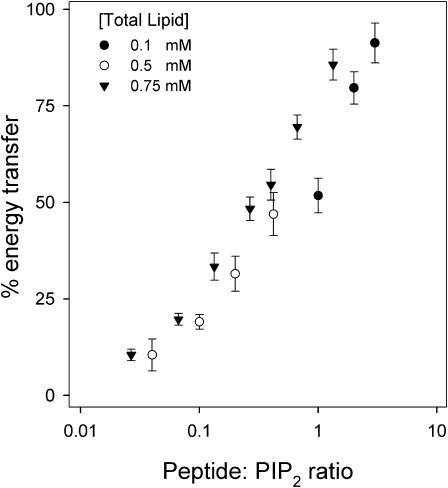
We performed FRET experiments similar to those shown in Figs. 3 and 4 (0.75 mM lipid concentration) at two additional lipid concentrations: 0.1 mM and 0.5 mM. Fig. 5 compares the results obtained at the different lipid concentrations, plotting the % energy transfer against the ratio of the peptide concentration to the total PIP2 concentration in the solution. Because the sequestration represents a lateral interaction between the membrane-bound peptide and PIP2, we expect the % energy transfer to be independent of the lipid concentration and to depend only on the peptide:PIP2 molar ratio. The results shown in Fig. 5 agree qualitatively with this expectation. Note that the % transfer approaches 100% as the peptide concentration (i.e., peptide:PIP2 ratio) increases. This is surprising: we expected that the polyvalent peptide would undergo FRET with only the PIP2 on the outer leaflet because it would not permeate the LUVs. The simplest interpretation is that the Texas Red MARCKS(151–175) permeates the bilayer and binds to PIP2 on both the inner and outer leaflets of the vesicles. Appendix 1 presents direct experimental support for this interpretation.
FIGURE 5.
The % energy transfer for PC/PS/Bodipy-TMR-PIP2 (70:30:0.1) LUVs plotted against the molar ratio of Texas Red MARCKS(151–175) to Bodipy-TMR-PIP2. The total lipid concentrations are 0.75 mM (▾), 0.5 mM (○), and 0.1 mM (•).
We used the data in Fig. 5 to estimate the apparent Kd for the lateral binding of PIP2 to MARCKS(151–175) by making three key assumptions: i), the surface phase containing both the PIP2 and the membrane-bound MARCKS(151–175) may be considered to be a three-dimensional phase of molecular (1 nm) thickness (Guggenheim approximation; Aveyard and Haydon, 1973); ii), the area occupied by the lipids is 0.7 nm2; and iii), 50% of the PIP2 is bound when the % transfer is 50%. With these and other assumptions, we deduce that the apparent Kd ∼ 1 mM (or stronger) and that the magnitude of the binding energy (ΔG′ = −RT ln Kd) is ≥4 kcal/mol for this lateral interaction.
We also studied FRET to Bodipy-TMR-PIP2 using peptides labeled with donor fluorophores (Bodipy-507 or Oregon Green) and obtained results similar to those shown for Texas Red MARCKS(151–175) (data not shown). Specifically, 200–300 nM of either Bodipy-507-MARCKS(151–175) or Oregon Green MARCKS(151–175) energy transferred ∼50% to Bodipy-TMR-PIP2 on PC/PS/Bodipy-TMR-PIP2 (70:30:0.1) LUVs, as observed in Fig. 4 with the Texas Red label. The energy transfer with these probes also approached 100% quenching for high (>5) peptide:PIP2 ratios. MARCKS(151–175) labeled with these hydrophobic probes also rapidly permeates vesicles (see Appendix 1).
The data shown in Figs. 3, 4, and 5 were obtained with vesicles containing 30% PS. We also performed experiments with vesicles containing 0%, 10%, and 17% PS (data not shown). The 0% PS data are consistent with spin label (Rauch et al., 2002), kinetic (Wang et al., 2002), competition, and ζ-potential (Wang et al., 2001) measurements that show each membrane-bound MARCKS(151–175) sequesters approximately three PIP2 on a PC/PIP2 membrane. As expected, the vesicles with 10% and 17% PS show stronger energy transfer than those with 30% PS. Because biological membranes contain PE and cholesterol as well as PC, PS, and PIP2 (White, 1973; Yorek, 1993), we measured FRET with 1:1:1:1 POPC:POPS:POPE:cholesterol + 0.1% Bodipy-TMR-PIP2 LUVs; the energy transfer was comparable to that illustrated in Fig. 4 (data not shown). Appendix 2 considers in more detail the role of cholesterol in the binding of MARCKS effector domain to membranes.
Effect of aromatics
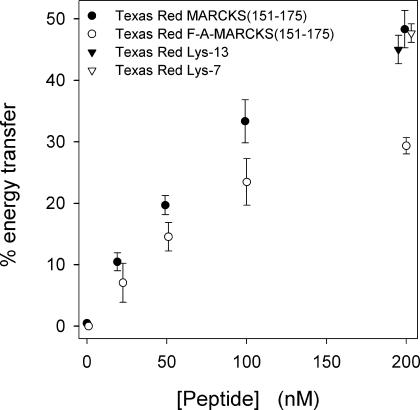
Fig. 6 shows the effect of replacing the five aromatic (Phe) residues in Texas Red MARCKS(151–175) with Ala: Texas Red FA-MARCKS(151–175) showed approximately twofold weaker energy transfer than Texas Red MARCKS(151–175), indicating that the aromatics increase the sequestration of PIP2. The lipid concentration was 0.75 mM, sufficient to bind essentially all of the peptide.
FIGURE 6.
The % energy transfer from Bodipy-TMR-PIP2 to Texas-Red-labeled peptides: Texas Red MARCKS(151–175) (•),Texas Red FA-MARCKS(151–175) (○), Texas Red Lys-13(▾), and Texas Red Lys-7(▿). The total lipid concentration is 0.75 mM in PC/PS/Bodipy-TMR-PIP2 (70:30:0.1) LUVs.
Effect of linear density of basic residues
Texas-Red-labeled Lys-7 and Lys-13 showed a concentration-dependent energy transfer similar to that observed with Texas Red MARCKS(151–175); Fig. 6 shows only the data obtained at 200-nM peptide concentration. Labeled Lys-13 (▾) produces greater quenching than labeled FA-MARCKS(151–175) (○), consistent with our prediction that increasing the linear charge density should increase the electrostatic sequestration. Note that the labeled Lys-7 and Lys-13 peptides both produce strong sequestration. In summary, FRET experiments illustrate that MARCKS(151–175) can sequester PIP2 on LUVs containing a physiological mol fraction of monovalent acidic lipid (15–30%).
One potential complication with these experiments is that direct interactions may occur between the fluorophores on the peptide and on PIP2. We performed control FRET experiments using Bodipy-TMR-DAG, which is produced by hydrolyzing Bodipy-TMR-PIP2 with PLC-δ1; the same vesicles used in the original FRET measurements were hydrolyzed. Because Bodipy-TMR-DAG is electrically neutral, we expect no electrostatic sequestration and no energy transfer between Bodipy-TMR-DAG and Texas Red MARCKS(151–175). The energy transfer (not shown) is significantly less than illustrated in Fig. 4 (maximum ∼10% transfer rather than ∼50%), and similar results were obtained using TRITC-PE instead of Bodipy-TMR-PIP2. Thus, most of the FRET seen in Figs. 4–6 is due not to probe-probe interaction but to lateral interaction of MARCKS(151–175) with PIP2. We used two techniques, quenching and EPR, to perform experiments with unlabeled peptide, which allowed us to eliminate any probe-probe interactions and to test the possibility that the probe on the peptide is enhancing the lateral sequestration of PIP2 by some other mechanism (e.g., enhanced image charge effect).
MARCKS(151–175) produces self-quenching of fluorescent PIP2
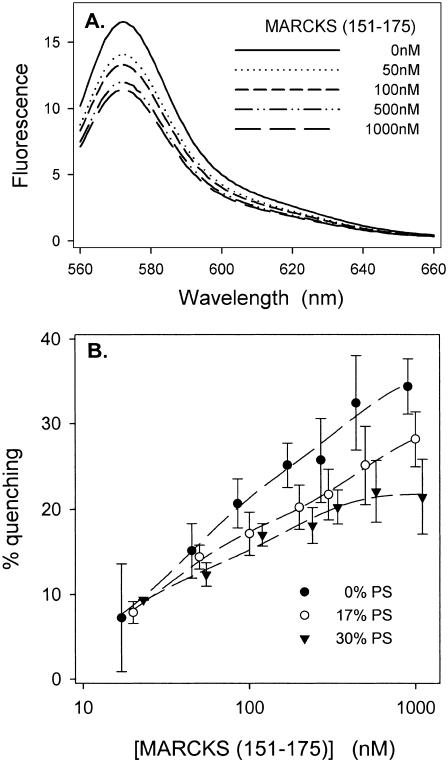
Because one MARCKS(151–175) peptide can bind approximately three PIP2 on a PIP2/PC membrane (Rauch et al., 2002; Wang et al., 2002), we postulated that the peptide should induce local clustering, and thus self-quenching of fluorescent PIP2. Fig. 7 A illustrates that unlabeled MARCKS(151–175) decreases the fluorescence of Bodipy-TMR-PIP2 in PC/Bodipy-TMR-PIP2 (99:1) vesicles. Fig. 7 B plots the % quenching of Bodipy-TMR-PIP2 as a function of MARCKS(151–175) concentration (•); data were from Fig. 7 A and similar experiments. These results are consistent with previous experiments (spin-label, kinetic measurements, etc.) showing that MARCKS(151–175) can sequester approximately three PIP2 lipids on a PC/PIP2 membrane. Our control experiments examined the ability of MARCKS(151–175) to quench electrostatically neutral TRITC-PE or Bodipy-TMR-DAG: as expected, no significant quenching was observed (data not shown).
FIGURE 7.
Quenching of Bodipy-TMR-PIP2 due to membrane-bound unlabeled MARCKS(151–175). Total lipid concentration is 0.1 mM. Bodipy-TMR-PIP2 is excited at 547 nm. (A) Representative experiments showing the raw emission spectra for Bodipy-TMR-PIP2 at different concentrations of MARCKS(151–175); vesicles are PC/Bodipy-TMR-PIP2 (99:1) LUVs. (B) The % quenching of Bodipy-TMR-PIP2 as a function of MARCKS(151–175) concentration on vesicles comprised of PC, 1% Bodipy-TMR-PIP2, and either 0 (•), 17% (○), or 30% (▾) PS. Each point on the plot is an average of ≥7 independent experiments.
Fig. 7 B also shows quenching results obtained with PC/PS/Bodipy-TMR-PIP2 vesicles containing 17% (○) and 30% (▾) PS; note that we observed significant quenching even in the presence of 30% PS. Control experiments (not shown) indicate that the peptide produces a larger self-quenching effect on the vesicles containing fluorescent PIP2 than fluorescent diacylglycerol (DAG).
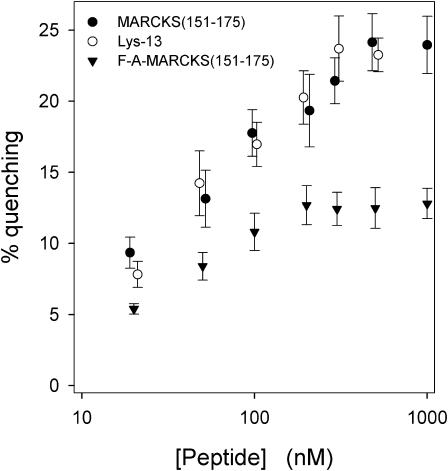
Fig. 8 shows similar quenching measurements using either unlabeled FA-MARCKS(151–175) or Lys-13; in contrast to MARCKS(151–175), these peptides bind outside the envelope of the polar headgroup region. These measurements allow us to investigate how aromatics and the linear charge density affect the electrostatic sequestration of PIP2. MARCKS(151–175) (•) produces stronger quenching of Bodipy-TMR-PIP2 than FA-MARCKS(151–175) (▾); thus, aromatics enhance the electrostatic sequestration of PIP2. Lys-13 (○) produces stronger quenching than FA-MARCKS(151–175) (▾), even though both peptides contain 13 basic residues and no aromatics; the simplest, but not the only, explanation is that a higher linear density of basic residues also increases the sequestration. (We note in passing that if the quenching shown in Figs. 7 B and 8 were due only to the proximity of the PIP2 bound to the peptide, it would have exhibited a maximum for 100 < [peptide] < 1000 nM, where the molar ratio of bound peptide to PIP2 decreases to a value <1. No maxima are observed, which indicates that other factors contribute to the quenching produced by the peptide-lipid interaction.)
FIGURE 8.
Quenching of Bodipy-TMR-PIP2 due to MARCKS(151–175) (•), Lys-13 (○), and FA-MARCKS(151–175) (▾). PC/PS/Bodipy-TMR-PIP2 (69:30:1) LUVs at a lipid concentration of 0.5 mM are sufficient to bind essentially all of the peptide.
These quenching results agree qualitatively with the FRET results: both techniques show that MARCKS(151–175) can laterally sequester PIP2, even when the vesicles contain 30% PS; aromatics increase the sequestration, as predicted by electrostatic theory (see below).
Increasing the salt concentration decreases the lateral sequestration of PIP2
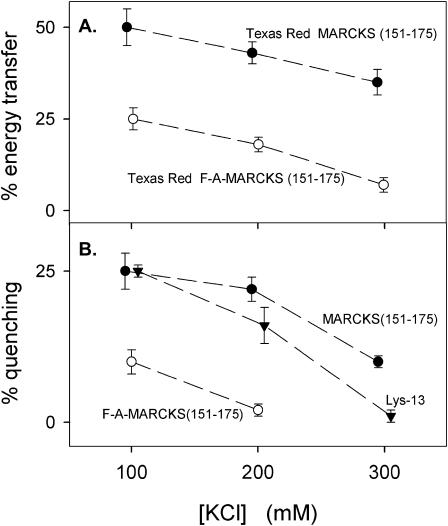
If the sequestration of PIP2 by a membrane-bound peptide is due mainly to electrostatics, theory predicts that sequestration should decrease as the salt concentration is increased. FRET measurements with labeled peptides (Fig. 9 A) and quenching measurements with unlabeled peptides (Fig. 9 B) show the lateral sequestration of PIP2 indeed decreases as the salt concentration increases.
FIGURE 9.
Increasing the salt concentration decreases both energy transfer and quenching. (A) Energy transfer between Bodipy-TMR-PIP2 and Texas Red MARCKS(151–175) (•) or Texas Red FA-MARCKS(151–175) (○) in solutions containing 100 mM, 200 mM, or 300 mM KCl. Lipid composition of LUVs is PC/PS/Bodipy-TMR-PIP2 (70:30:0.1). (B) Quenching of Bodipy-TMR-PIP2 due to MARCKS(151–175) (•), FA-MARCKS(151–175) (○), or Lys-13 (▾) in solutions containing 100 mM, 200 mM, or 300 mM KCl. Lipid composition of LUVs is PC/PS/Bodipy-TMR-PIP2 (69:30:1).
EPR experiments show MARCKS(151–175) can sequester proxyl-PIP2 in the presence of monovalent acidic lipids
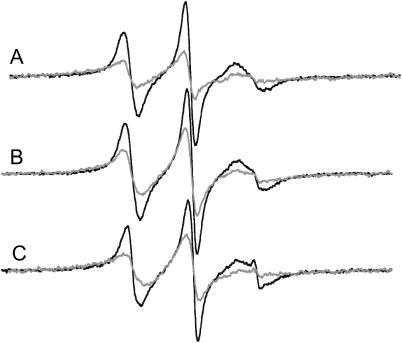
Fig. 10 shows EPR spectra of the proxyl-PIP2 spin label incorporated into LUVs formed from PC or mixtures of PC and PS in the absence and presence of MARCKS(151–175). In each lipid mixture, addition of MARCKS(151–175) produced a substantial reduction in the EPR resonance amplitude, reflecting a broadening of the normalized EPR spectrum. Previous studies showed addition of molecules known to interact with PIP2, such as neomycin and the PH domain of PLC-δ1, decrease the amplitude of the EPR spectra (Rauch et al., 2002). For MARCKS(151–175), the decrease in spectral amplitude of proxyl-PIP2 reflects an ∼30% reduction in the rotational correlation time. Under certain conditions (for example the PC sample in Fig. 10 A), dipolar interactions may produce additional broadening when more than one proxyl-PIP2 lipid is bound to MARCKS(151–175) (Rauch et al., 2002). The changes seen upon MARCKS(151–175) addition are reversed when the peptide is removed from the membrane interface, e.g., by the addition of Ca2+/calmodulin (data not shown).
FIGURE 10.
EPR spectra of proxyl-PIP2 in bilayers composed of (A) PC, (B) PC/PS (9:1), and (C) PC/PS (7:3) in the absence (black line) and presence (gray line) of MARCKS(151–175). The peptide was added to concentrations of ∼50, 80, and 120 μM in A, B, and C, respectively. The spin label was present at ∼0.5 mol%; total lipid concentration is 20 mM; solution contains 100 mM KCl, 10 mM MOPS, pH 7.0. The amplitudes of the EPR spectra have been normalized against the total spin concentration.
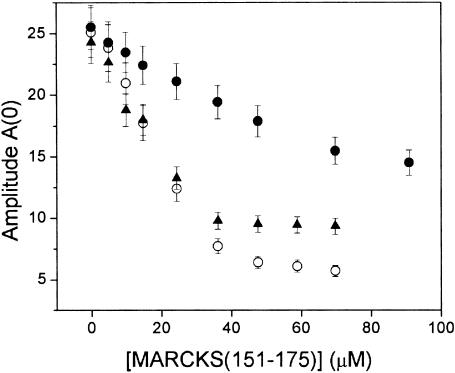
Fig. 11 shows titrations of the normalized proxyl-PIP2 resonance amplitude upon addition of the MARCKS(151–175). For proxyl-PIP2 in PC and PC:PS (9:1) LUVs, we observed similar changes in amplitude, suggesting a similar affinity between proxyl-PIP2 and MARCKS(151–175) in the presence or absence of PS. These data could not be fit to a simple 1:1 binding model, consistent with the idea that multiple PIP2 are sequestered by the peptide (Wang et al., 2001; Rauch et al., 2002). When experiments were performed with 7:3 PC/PS LUVs, the EPR amplitude approached a similar endpoint, but the apparent affinity of proxyl-PIP2 for MARCKS(151–175) was lower, in agreement with the fluorescence results shown in Fig. 7.
FIGURE 11.
Titration of the central (mI = 0) nitroxide EPR resonance, A(0), as a function of the concentration of added MARCKS(151–175). The titration is shown in vesicle suspensions of PC (○), PC/PS (9:1, ▴), PC/PS (7:3, •) at a total lipid concentration of ∼7 mM; proxyl-PIP2 is present at 0.85 mol%.
SUMMARY
FRET, quenching, and EPR experiments all show that the MARCKS effector domain can laterally sequester PIP2 on LUVs with lipid composition comparable to the inner leaflet of the plasma membrane (i.e., 15–30% PS). The next section shows that electrostatic theory predicts this lateral sequestration of a polyvalent lipid.
Calculations of the sequestration of PIP2 by FA-MARCKS(151–175) provide support for a nonspecific electrostatic mechanism
We used the Finite Difference Poisson-Boltzmann (FDPB) method to examine two hypotheses: i), lateral sequestration of PIP2 by membrane-adsorbed basic peptides is due to nonspecific electrostatic interactions, and ii), electrostatic sequestration is significant, even when the membrane contains an appreciable mol fraction of PS. The calculations incorporate molecular models of PIP2, the peptide, and the PC/PS membrane. Fig. 12 A illustrates the predicted electrostatic properties of a 5:1 PC/PS membrane under a variety of conditions. The front portion of the figure represents the membrane far from either peptide or PIP2: the −25 mV equipotential profile above this region of “bulk” membrane undulates gently, with hills corresponding to the location of the charged PS lipids. The middle portion of Fig. 12 A illustrates how the adsorption of the basic peptide FA-MARCKS(151–175) to the membrane surface produces a highly localized region of positive potential in its vicinity. The multivalent anionic PIP2 (shown in yellow and visible in the upper right portion of Fig. 12 A) produces a localized enhancement of the negative potential of the 5:1 PC/PS membrane. The membrane-adsorbed FA-MARCKS(151–175) electrostatically attracts the highly charged PIP2; as discussed in Wang et al. (2003), the calculated change in electrostatic free energy when PIP2 partitions from bulk membrane to a position adjacent to the peptide is −2.2 kcal/mol (Fig. 12 B). Therefore, FA-MARCKS(151–175) adsorbed to the surface of a membrane containing 17 mol % PS provides a strong basin of attraction for the electrostatic sequestration of PIP2. Additional quantitative results, as well as the calculated dependence of PIP2 partitioning on the ionic strength of the solution, the mol percent acidic lipid in the membrane, and the residue composition of the peptide, are provided in our companion computational paper (Wang et al., 2003).
Fig. 12, C–E, provide an alternative representation of the electrostatic interactions that occur first between FA-MARCKS(151–175) and bulk membrane, then between the membrane-adsorbed peptide and PIP2. As depicted in Fig. 12 C, FA-MARCKS(151–175) in solution ([KCl] = 0.1 M) has a strong positive electrostatic profile. Fig. 12 D shows the decrease in this positive contour when the peptide binds to the surface of a 5:1 PC/PS membrane (the view is from above, looking down on the membrane surface). FDPB calculations indicate this decrease is due to the favorable electrostatic interaction between the basic peptide and acidic lipids in the membrane; details of the membrane and its electrostatic potential have been removed for clarity. Fig. 12 E illustrates how interaction with PIP2 further decreases the positive contour of the N-terminal portion of the membrane-adsorbed peptide; this is the same interaction depicted in Fig. 12 B.
Fig. 12, D and F, contrast the positive potential contours surrounding FA-MARCKS(151–175) and Lys-13, respectively, adsorbed to the surface of a 5:1 PC:PS membrane. Although both peptides have a net charge of +13, Lys-13 has a significantly higher linear charge density. Consequently, FDPB calculations predict that the positive equipotential contour of membrane-adsorbed Lys-13 is significantly larger than that of membrane-adsorbed FA-MARCKS(151–175), which consists of 25 amino acid residues. This suggests that Lys-13 interacts with PIP2 more strongly than FA-MARCKS(151–175) because of its higher linear charge density.
One limitation of our atomic model is obvious: PS is not at electrochemical equilibrium, but is assumed to be spatially fixed. Only PIP2 redistributes (is laterally sequestered) when the peptide binds to the membrane. Experiments are in progress to address the possibility that PS is also sequestered by basic peptides (May et al., 2000) and that when PIP2 is sequestered from a membrane containing both PS and PIP2, there is an exchange of several sequestered PS for PIP2. Simplified models of peptides and membranes allow one to take into account the electrochemical equilibrium of both PS (May et al., 2000; Groves et al., 2000) and PIP2 (Haleva et al., 2003) as the peptide adsorbs. If the peptide is assumed to be a disk larger than the Debye length, the charge density on the membrane beneath the adsorbed disk is approximately “matched” to the charge density on the disk (Haleva et al., 2003). In this case there is a release of approximately three PS as one PIP2 is sequestered. The major conclusion of this disk model agrees with our atomic model calculations: basic peptides can laterally sequester multivalent anionic lipids such as PIP2 by an electrostatic mechanism.
Simple electrostatics predicts increased sequestration due to aromatics
Figs. 6, 8, and 13 B show that aromatic residues embedded in a cluster of basic residues enhance the lateral sequestration of PIP2, but how do aromatic residues exert this effect? Fig. 1 B depicts a model based on the results of several different experiments showing that the aromatics insert into the acyl chain region and consequently pull the adjacent basic residues into the polar headgroup region. Moving a charge close to or within the polar headgroup region increases the electrostatic potential it produces—and thus the sequestration of PIP2—for two reasons. First, when a charge moves close to a region of low dielectric constant, the “image charge” effect enhances the potential, as discussed in standard texts (Dill and Bromberg, 2003; see Chapter 21) and reviews (McLaughlin, 1989; see Fig. 1). In the simplest case (no salt in aqueous, a, or membrane, m, phases) moving a single point charge from a medium of dielectric 80 to the interface with a homogeneous phase of dielectric 2 increases the potential by a factor 2ɛa/(ɛm + ɛa) ≈ 2 at any distance from the charge (see Fig. 4.4 in Jackson, 1975). Second, if the aqueous phase contains salt, and the membrane phase does not, moving a point charge q to the interface perturbs the ion atmosphere around the charge. Even if image charge effects are absent (e.g., dielectric constant of the membrane phase is identical to that of the aqueous phase), the potential increases at distances comparable to the Debye length. For example, in a 100-mM salt solution (where 1/κ, the Debye length, is ∼1 nm) the potential a distance r = 2 nm from the charge q increases approximately twofold at the membrane surface due to the perturbation of the double layer (Mathias et al., 1992, see Fig. 4 and Eq. 10 for the complicated expression that describes the potential).
A surprisingly simple expression for the potential emerges when the membrane phase has both a low dielectric and excludes ions. For a charge q far from the interface in the aqueous phase, the monovalent ions in solution “screen” the charge, and the potential is described by Debye-Hückel theory: ψa = q exp(−κr) / (4πɛoɛar) where r is the distance from the charge. If the charge q is moved to the interface with a low dielectric membrane phase (ɛa / ɛm ≫ 1) the potential in the aqueous phase is simply ∼2 times the Debye-Hückel expression at all distances r from the charge (Mathias et al., 1992, see Fig. 3; Stillinger, 1961).
Of course, only the acyl chain region of a phospholipid bilayer has a dielectric ∼2: the polar headgroup region contains ∼50% water by volume, and its average dielectric constant is significantly higher. Nevertheless, the two factors discussed above should approximately double the potential produced by a charge on a peptide (at least for r > 1/κ ∼1 nm, z = distance from surface = 0) when the charge is located within the polar headgroup region. These electrostatic phenomena provide a simple explanation for the ability of aromatic residues to enhance the sequestration of PIP2 by clusters of basic residues observed in Figs. 6, 8, and 13 B.
The energy required to increase the electrostatic potential adjacent to the basic residues comes from the hydrophobic energy gained by insertion of the Phe residues into the acyl chain region of the membrane (Fig. 1 B). Engelman et al. (1986) estimate this energy is ∼4 kcal/mol per Phe residue, sufficient to account for the observed effects.
More detailed, realistic theoretical calculations are highly model dependent, and are not presented here. We merely note that J. Wang (unpublished) has shown that the potential produced by a model basic peptide does increase in the expected manner as the charges on the peptide approach the polar headgroup interface of an atomic model of a bilayer similar to that shown in Fig. 12.
Biological implications
MARCKS(151–175) sequestration of PIP2 on LUVs inhibits PLC-catalyzed hydrolysis of PIP2
Fig. 13 A plots the % PIP2 hydrolyzed in PC/PS/PIP2 LUVs as a function of time. In the absence of PLC-δ1 (▾), we observed no significant hydrolysis over 15 min, whereas addition of enzyme produced significant hydrolysis of PIP2 within the first 3 min (•). Adding 0.5 μM MARCKS(151–175) with the PLC (○) decreased the initial rate of hydrolysis by ∼50%. Fig. 13 B shows the effect of peptide on the initial rate of hydrolysis seen in Fig. 13 A, along with the results of similar experiments done with different concentrations of MARCKS(151–175). MARCKS(151–175) inhibits PLC-δ1 activity in a concentration-dependent manner, with 0.3–0.5 μM peptide producing ∼50% inhibition. The simplest interpretation is that the PLC-δ1 cannot hydrolyze sequestered PIP2. Fig. 13 B also shows that MARCKS(151–175) inhibits PLC activity approximately fourfold more effectively than FA-MARCKS(151–175). This result is consistent with the more direct FRET (Fig. 6) and quenching (Fig. 8) results indicating that aromatics enhance the sequestration of PIP2. Finally, Fig. 13 B shows 0.5 μM Lys-13 produces greater inhibition than 0.75 μM FA-MARCKS(151–175), providing additional evidence that a higher linear density of positive charges enhances PIP2 sequestration. As noted with the FRET results, the Texas Red label on the peptides may be enhancing the sequestration. This fluorophore is hydrophobic and may, like the Phe residues, enhance the electrostatic potential of the peptide by pulling the adjacent basic residues deeper into the headgroup. Indeed, Texas Red-MARCKS(151–175) and Texas Red FA-MARCKS(151–175) both increased inhibition of PLC-induced PIP2 hydrolysis compared to an equivalent concentration of their unlabeled counterparts (Fig. 13 B). Attaching a hydrophobic fluorescent probe to a basic peptide corresponding to a region of gelsolin also enhanced its ability to bind PIP2 (Cunningham et al., 2001).
MARCKS(151–175) sequestration of PIP2 on LUVs has little effect on binding of the PLC-δ1 PH domain to the vesicles
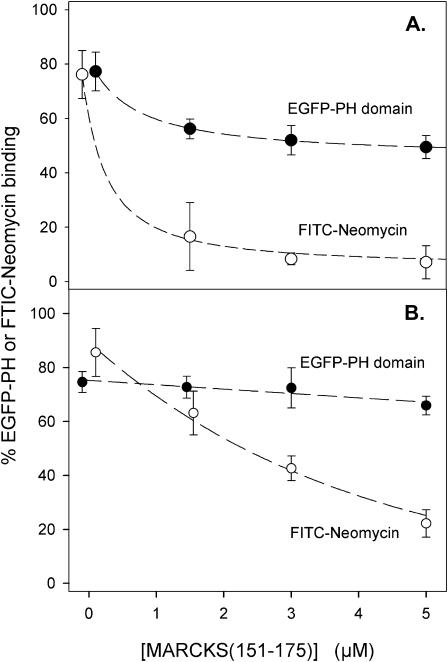
Previous work (Harlan et al., 1994; Lemmon et al., 1995; Garcia et al., 1995) and our centrifugation experiments (not shown) demonstrated that the EGFP-PLC-δ1 PH domain construct binds to PIP2 in membranes with significant affinity (Kd = 2 μM) and great specificity. As shown in Fig. 14, the binding of EGFP-PH (•) to PC/PIP2 (99:1) vesicles or to PC/PS/PIP2 (82:17:1) vesicles did not change markedly as the MARCKS(151–175) concentration increased from 0 to 5 μM. The accessible PIP2 concentration is 4 μM in these vesicles, and our FRET, quenching, EPR, and PLC experiments indicate >4 μM MARCKS(151–175) should sequester >90% of the PIP2. Nevertheless, most of the EGFP-PH domain remains bound to the vesicles even at the highest peptide concentration. If most of the PIP2 in these vesicles is indeed sequestered, there should be a marked decrease in the binding of neomycin, which forms a 1:1 electroneutral complex with PIP2 (Arbuzova et al., 2000a). Fig. 14 also shows the binding of FITC-neomycin (○), which decreases in the expected manner as MARCKS(151–175) sequesters PIP2. (We also performed controls using a trace concentration of 3H-MARCKS(151–175) to ensure that the unlabeled MARCKS(151–175) was indeed sequestering the PIP2 in these vesicles. As expected, the binding of 3H-MARCKS(151–175) (data not shown) decreases in a manner similar to FITC-neomycin.)
FIGURE 14.
Effect of PIP2 sequestration on the binding of EGFP-PH and FITC-Neomycin to LUVs. (A) Binding of EGFP-PH domain from PLC-δ1 (•) or FITC-Neomycin (○) to PC/PIP2 (99:1) LUVs plotted against MARCKS(151–175) concentration. Lipid concentration 0.8 mM; EGFP-PH domain or FITC-Neomycin concentration ∼10 nM. Solutions contain 100 mM KCl, 1 mM MOPS, 100 μM EDTA, 2 mM DTT, 0.0065% Triton X-100, pH 7.0. (B) Binding of EGFP-PH domain (•) or FITC-Neomycin (○) to PC/PS/PIP2 (79:20:1) LUVs. All data points are an average of nine experiments (±SD).
The simplest interpretation of these results is that MARCKS(151–175) may electrostatically sequester not only PIP2 but also the PH domain bound to PIP2, as illustrated in Fig. 15. Fig. 15 A (equilibrium 1) illustrates our main conclusion from FRET, quenching, and ESR experiments: membrane-bound MARCKS(151–175) laterally sequesters PIP2 because the local positive potential around the peptide electrostatically attracts the negatively charged PIP2 (Fig. 15 B). The PLC-δ1 PH domain, illustrated bound to PIP2 on the membrane in equilibrium 2 of Fig. 15 A, has a patch of acidic residues on its surface that produces a high local negative potential. This negative potential, which is apparent in the side and top views shown in Fig. 15, C and D, should also be sequestrated by the positively charged MARCKS(151–175) (equilibrium 3 in Fig. 15 A). There is strong support for equilibria 1 and 2; the evidence for equilibrium 3 is still indirect. This putative lateral interaction between the membrane-bound PH domain and clusters of basic residues has interesting implications for the use of this PH domain as a probe of the free concentration of PIP2 in the membrane (Balla and Varnai, 2002). It also implies that MARCKS may act as a scaffolding protein: scaffolding proteins typically bind both enzymes and their substrates (Burack and Shaw, 2000; Edwards and Scott, 2000). The available evidence suggests the effector domain of MARCKS sequesters both PLC-δ1 (through its PH domain) and its substrate, PIP2; some ion channels also sequester both PLC and PIP2 (Runnels et al., 2002).
DISCUSSION
The effector domain of MARCKS sequesters PIP2
The working hypothesis is that adsorption of the basic effector domain of MARCKS to the inner leaflet of the plasma membrane produces a local positive electrostatic potential that reversibly sequesters a significant fraction of the polyvalent acidic lipid PIP2 in the cell. We used three techniques to show that a peptide corresponding to the basic effector domain, MARCKS(151–175), indeed sequesters PIP2 laterally in the presence of much higher, physiologically relevant concentrations of the monovalent acidic lipid PS. FRET from the Bodipy-TMR label on PIP2 to the Texas Red label on MARCKS(151–175) shows that membrane-bound MARCKS(151–175) sequesters PIP2, even when PS is present at a 300-fold excess (Figs. 3–6). Fluorescence quenching (Figs. 7 and 8) and EPR measurements (Figs. 10 and 11) show that unlabeled MARCKS(151–175) also laterally sequesters fluorescent and spin-labeled PIP2 in the presence of excess PS.
The sequestration is due to electrostatics
Does MARCKS(151–175) sequester PIP2 laterally by means of local electrostatics? Previous theoretical calculations using the nonlinear Poisson-Boltzmann equation (Arbuzova et al., 1998; Murray et al., 1999, 2002; Wang et al., 2002; McLaughlin et al., 2002), and those illustrated in Fig.12 of this report, demonstrate that adsorption of a polybasic peptide to a bilayer containing 15–35% monovalent acidic lipid produces a local positive potential that can sequester polyvalent phosphoinositides such as PIP2 and PIP3. Calculations illustrated in Fig. 12 suggest that the sequestration of PIP2 is significant, even when the membrane contains a large excess of monovalent acidic lipid such as PS (Wang et al., 2003).
The predicted sequestration follows from the Boltzmann relation and the high valence of PIP2. Fig. 12 illustrates the potential is ∼+30 mV close to the basic peptide and ∼−30 mV far from it. The Boltzmann equation predicts that a lipid with a valence of −4 (e.g., PIP2) will be concentrated or sequestered 1000-fold more effectively than a lipid with a valence of −1 (e.g., PS) if we assume, for simplicity in illustrating the phenomenon, that monovalent and tetravalent lipids are point charges that do not perturb the potential. The calculations summarized in Fig. 12 take into account the fact that PIP2 modifies the potential as it approaches the membrane-bound peptide. These calculations are presented in more detail in the companion report (Wang et al., 2003). These detailed electrostatic calculations and the thermodynamic model of Haleva et al. (2003), which treats the peptide as a uniformly charged disk, indicate that PIP2 will be sequestered strongly in the presence of monovalent acidic lipids.
The available experimental evidence supports these theoretical predictions that nonspecific electrostatics can account for this preferential sequestration of PIP2. The experiments shown in Fig. 9 illustrate that increasing the salt concentration decreases the sequestration, the result expected from double-layer theory (PB equation) if the sequestration is due to electrostatics (Wang et al., 2003; Haleva et al., 2003). Furthermore, three results from experiments measuring the binding of basic peptides to PC/PIP2 vesicles strongly suggest the peptide-PIP2 interaction is due mainly to electrostatics. First, the binding is independent of the chemical nature of the basic residues: Lys-13 and Arg-13 peptides bind to PC/PIP2 99:1 vesicles with the same molar partition coefficient, K = 106 M−1, (Wang et al., 2002). Second, the binding does not depend on the chemical nature of the phosphoinositide: MARCKS(151–175) binds equally well to PC/PIP2 vesicles containing either PI (3,4)P2 or PI (4,5)P2 (Wang et al., 2001). Third, increasing the salt concentration decreases the binding of the peptides to PC/PIP2 vesicles (Wang et al., 2001, 2002). Although the binding of basic peptides to PC/PIP2 vesicles and the sequestration of PIP2 by the peptide bound to PC/PS/PIP2 vesicles both involve an electrostatic interaction between PIP2 and the peptide, there are important differences: the binding increases exponentially with valence of the peptide (Wang et al., 2002), whereas the sequestration is not strongly dependent on the valence (Fig. 6).
Binding of peptides to vesicles versus sequestration of PIP2 by a membrane-bound peptide
Our experimental results illustrate an important difference between binding and sequestration. Lys-7 binds to PC/PIP2 (99:1) vesicles with a molar partition coefficient K = 103 M−1; Lys-13 binds to these PC/PIP2 vesicles with K = 106 M−1 (Wang et al., 2002). The 1000-fold difference between the affinities of Lys-7 and Lys-13 for PC/PIP2 vesicles is also manifested in their binding to 5:1 PC/PS vesicles (Wang et al., 2002). This difference is well understood theoretically and can be calculated from the first principles using the PB equation (Murray et al., 2002). The essence of the calculation is easy to understand: the positively charged peptides accumulate in the diffuse double layer adjacent to the negatively charged vesicles. If ψ(x) is the potential at a distance x from the surface and we assume, to simplify the discussion, that the peptide is a point charge of valence z that does not perturb the potential, the Boltzmann equation gives the peptide concentration at x: P(x) = P(∞) exp(zeψ(x) / kT). The integral of the excess peptide concentration, P(x) − P(∞), over the double layer (a few Debye lengths in thickness; 1/κ ∼1 nm for 100 mM salt) gives the Gibbs surface excess, which may be regarded as the number of “bound” peptides per unit area of membrane. If addition of six basic residues (Lys-13 versus Lys-7) increases the binding 1000-fold, it is apparent that each of these six basic residues experiences an average potential of about −30 mV when the peptide binds. Indeed, this is the average potential a few angstroms from a 5:1 PC/PS vesicle; the potential may be calculated from the Helmholtz capacitor equation (McLaughlin, 1977), Gouy-Chapman theory (McLaughlin, 1989), the application of the nonlinear PB equation to an atomic level model of a PC/PS membrane (Peitzsch et al., 1995; Murray et al., 2002), or measured experimentally by a number of different techniques (e.g., the ζ-potential of a 5:1 PC/PS vesicle in 100 mM salt is salt is −30 mV (McLaughlin, 1989). The more realistic theoretical treatment based on atomic models of membranes and peptides using the nonlinear PB equation is reviewed elsewhere (Murray et al., 2002). Theory predicts that the valence of the peptide is a major factor in determining how strongly an unstructured basic peptide binds electrostatically to a PC/PS or PC/PIP2 vesicle. The results with all the basic peptides we have examined support this prediction (Wang et al., 2002).
Now consider the case where either a membrane-bound Lys-7 or Lys-13 sequesters PIP2 (present at trace concentrations, e. g., 0.1%) in a PC/PS/PIP2 vesicle. The experimental results reported here show that these two membrane-bound peptides produce a similar sequestration of PIP2. (Specifically the Bodipy-TMR label on PIP2 undergoes FRET with the Texas Red label on Lys-7 and Lys-13 with about the same efficiency (Fig. 6).) It is the valence of the lipid, not the membrane-bound peptide, that is the more important factor for lateral electrostatic sequestration. PIP2, with a valence of ∼−4, experiences a high positive potential adjacent to both membrane-adsorbed peptides.
Embedded aromatics increase electrostatic sequestration
Our experimental results show that replacing the aromatic Phe residues in MARCKS(151–175) with Ala decreases the lateral sequestration of PIP2 by a membrane-bound peptide (compare MARCKS(151–175) and FA-MARCKS(151–175) in Figs. 6, 8, and 13). The FA-MARCKS peptide does not penetrate the bilayer, whereas the five Phe residues of the MARCKS peptide drag the adjacent basic residues into the polar headgroup region (Fig. 1 B), and thus increase the potential they produce (Mathias et al., 1992).
Biological correlations
We previously compared the nonspecific electrostatic sequestration of PIP2 by unstructured clusters of basic/aromatic residues on proteins to the highly specific binding of PIP2 to structured domains, such as the PH domain of PLC-δ1 (McLaughlin et al., 2002; Wang et al., 2002). We now argue that biology utilizes both types of interactions to produce a flow of information in signal transduction systems. Our working hypothesis is that MARCKS reversibly sequesters a significant fraction of the PIP2 (and PIP3) in the inner leaflet of the plasma membrane (Laux et al., 2000; McLaughlin et al., 2002). One important caveat is that the concentration of MARCKS and other putative PIP2 buffers (e.g., GAP43, CAP23) in many cell types is not well established, and may not be sufficiently high to buffer a significant fraction of the PIP2. Six cell biology experiments, however, provide support for our hypothesis: i), Laux et al. (2000) showed overexpression of MARCKS in neuronal or epithelial cells produces an increase in the total level of PIP2 in the cell, which is the anticipated result if the higher MARCKS concentration reduces the level of free PIP2, causing the cell to compensate by increasing PIP2 production to maintain a constant free PIP2 level; ii), MARCKS is not uniformly distributed in the plasma membrane of some cell types; it is concentrated in the ruffles of fibroblasts (Myat et al., 1997) and the nascent phagosomes of macrophages (Allen and Aderem, 1995), presumably because of its interaction with actin. The hypothesis predicts that PIP2 also should be concentrated in these membrane ruffles and nascent phagosomes. It is based on experiments that use a fluorescent construct of the PH domain of PLC-δ1 to detect PIP2 (Botelho et al., 2000; Tall et al., 2000). Interestingly, the concentration of PIP kinases is also elevated in both these areas (Doughman et al., 2003a). Hence both local synthesis and sequestration could contribute to the accumulation of PIP2 (Doughman et al., 2003b); iii), membrane ruffles (M. Rebecchi, SUNY Stony Brook, NY, personal communication) and nascent phagosomes (Marshall et al., 2001; Botelho et al., 2000) exhibit steep gradients for polyphosphoinositides at their borders. Local synthesis alone, however, should produce only a shallow concentration gradient as the PIP2 diffuses from the region of high local concentration. Lateral sequestration, on the other hand, could produce sharp gradients if the concentration of MARCKS falls sharply at the edge of the ruffle or nascent phagosome; iv), experiments by D. J. Olson and R. A. Anderson (U. Wisconsin-Madison, personal communication) show that free PIP2 levels >0.1% inhibit native PIP kinase I purified from erythrocytes, whereas the phospholipids of the inner leaflet of most plasma membranes comprise ∼1% PIP2, suggesting indirectly that ∼90% of the PIP2 may be sequestered in some manner; v), cytoskeleton-free microvesicles released from erythrocytes contain only ∼50% of the PIP2 in the unperturbed membrane, suggesting much of the PIP2 in the unperturbed membrane is not free to diffuse (Hagelberg and Allan, 1990); and vi), J. Sable and M. P. Sheetz (Columbia University, personal communication) have recently obtained the best evidence to date that MARCKS reversibly sequesters a significant fraction of the PIP2 in a living fibroblast cell. They performed two experiments that suggest the level of free PIP2 increases at the plasma membrane when MARCKS translocates from membrane to cytosol due to PKC phosphorylation. In one experiment, they detect an increase in the level of free PIP2 by measuring the increase in membrane tension due to PIP2-dependent cytoskeleton-plasma membrane adhesion as GFP-labeled MARCKS is translocated from the plasma membrane. An important control shows that activation of PKC in fibroblasts lacking MARCKS does not produce an increase in the level of free PIP2.
Clusters of basic residues on other proteins should also sequester PIP2 (and PIP3)
Many other proteins with clusters of basic residues interact with membranes, and some are present at concentrations sufficiently high that they, too, could sequester PIP2. For example, neuronal cells have two other natively unfolded proteins, CAP23 and GAP43, that are present at high concentrations; their clusters of basic/aromatic residues may also act to sequester PIP2 (Laux et al., 2000). Several scaffolding proteins have properties that suggest they also could act as reversible PIP2 buffers. Drosophila A kinase anchor protein 200 (DAKAP200) (Rossi et al., 1999) contains a basic/aromatic region similar in structure to the MARCKS effector domain, and a peptide corresponding to this region binds strongly to PC/PIP2 vesicles (Wang et al., 2002). The mammalian scaffolding protein AKAP79 contains clusters of basic residues that are capable of binding PIP2 (Dell'Acqua et al., 1998); Src-suppressed C kinase substrate, SSeCKS, also has a cluster of basic/aromatic residues that resembles the MARCKS effector domain (Gelman, 2002).
In summary, the biophysical results reported here on model systems support the hypothesis that an unstructured cluster of basic/aromatic residues on MARCKS is capable of reversibly sequestering a significant fraction of the PIP2 on the inner leaflet of a plasma membrane.
Acknowledgments
This work was supported by the National Institutes of Health (grant GM24971 to S.M., GM62305 to D.C., and GM69651 to S.S.) and by the National Science Foundation (grant MCB0212362 to D.M.).
APPENDIX 1: PHOSPHOLIPID VESICLES ARE SURPRISINGLY PERMEABLE TO FLUORESCENTLY LABELED BASIC AND BASIC/AROMATIC PEPTIDES
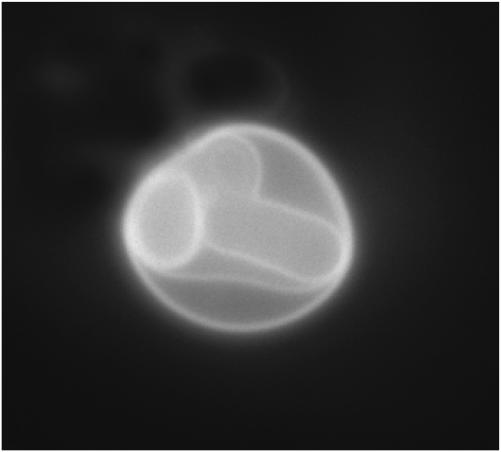
Our measurements (Fig. 5) show that FRET approaches 100% at high Texas Red MARCKS(151–175) concentrations. The simplest interpretation of this observation is that labeled MARCKS(151–175) rapidly crosses the bilayer and binds to the fluorescent PIP2 on the inner as well as the outer leaflet of LUVs. We investigated this further by performing epi-fluorescence microscope experiments on giant (≥5 μm) vesicles. The conventional hydration method of forming giant vesicles (Akashi et al., 1996) produces a mixture of unilamellar vesicles, multilamellar vesicles, and unilamellar giant outer vesicles that contain smaller vesicles inside. We confirmed the smaller vesicles were inside the giant vesicle and were not merely invaginations of the outer membrane by observing them at different focal depths and noting their Brownian movements inside the giant vesicle. We added Texas Red MARCKS(151–175) to a solution of these vesicles on a glass slide, then used a conventional epi-fluorescence microscope with a CCD camera to observe whether Texas Red MARCKS(151–175) binds rapidly to the small inner vesicles enclosed by giant vesicles. Fig. 16 shows one example of such an experiment: Texas Red MARCKS(151–175) does indeed permeate the outer membrane rapidly (<1 min) and binds to the inner vesicles, which we stress are not invaginations of the outer bilayer. We observed rapid permeation in >100 vesicles in these experiments. This technique permitted us to discard any false positives resulting from observations of smaller vesicles tethered to giant vesicles or aggregates of many vesicles. The lipid composition in Fig. 16 is PC/PS/PIP2 (70:30:0.1). Rapid permeation of the labeled peptide is also observed with PC/PS (5:1) vesicles (data not shown).
FIGURE 16.
Texas Red MARCKS(151–175) permeates giant unilamellar vesicles. We observed Texas Red fluorescence immediately (∼10 s) after addition of Texas Red MARCKS(151–175) to a solution containing a giant (∼10 μm) vesicle enclosing four smaller vesicles. Epi-fluorescence microscopy reveals Texas Red MARCKS(151–175) binds rapidly to the inner vesicles. Lipid composition: PC/PS/PIP2 (69:30:0.1); peptide concentration: ∼100 nM.
We are surprised that the bilayer is permeable to a peptide with 13 basic residues; Born calculations (Parsegian 1969), and many experiments with simple ions and small basic peptides, indicate phospholipid bilayers are not generally permeable to charged molecules. “Trojan” peptides, a class of highly basic or basic/aromatic peptides, are known to penetrate biological membranes, however, and can even be used to deliver covalently attached “cargo” into cells by an unknown mechanism (Lindgren et al., 2000; Binder and Lindblom, 2003).
We have not investigated the mechanism by which the fluorescently labeled peptides permeate phospholipid bilayers in any detail. The Texas Red labels are large (∼700 Da) and hydrophobic; they almost certainly penetrate into the acyl chain region of the bilayer, as do the Phe residues illustrated in Fig. 1 B. These hydrophobic groups do not provide enough energy to solubilize the 13 charges on MARCKS(151–175) in the low dielectric interior of the bilayer (Parsegian 1969). They may, however, act in a number of different ways: inducing local curvature that destabilizes the membrane; stabilizing the spontaneously occurring, transient water-filled pores in the bilayer; and/or aggregating laterally to form alamethicin-like pores that allow penetration of the pore-forming molecules (Lindgren et al., 2000; Biggin and Sansom, 1999). We note that the Texas Red Lys-7 also permeates rapidly, suggesting aromatic residues on the peptide are not required. Furthermore, we see similar permeation (and similar 100% FRET) of MARCKS(151–175) labeled with the smaller hydrophobic probes Oregon Green (∼450 Da) and Bodipy-507 (∼300 Da) (results not shown). Cunningham et al. (2001) observed that attaching a hydrophobic fluorescent probe, rhodamine B, to a basic peptide corresponding to a region of gelsolin allows the peptide to cross the cell membrane by an unknown mechanism. In contrast, we did not observe permeation of the bilayer using a peptide with a hydrophilic label, Alexa-488-MARCKS(151–175) (data not shown), but found that adding Texas Red MARCKS(151–175) and Alexa-488-MARCKS(151–175) together allows the latter peptide to permeate (not shown), suggesting strongly that a transient pore is formed.
APPENDIX 2: Effects of cholesterol on the binding of MARCKS(151–175) to vesicles
As we discuss in the Introduction, EPR (Qin and Cafiso, 1996; Victor et al., 1999) and NMR (Zhang et al., 2003; Ellena et al., 2003) experiments indicate that the phenylalanine residues on the MARCKS peptide penetrate into the acyl chain region of the bilayer, as shown in Fig. 1 B. Thus the backbone of the adjacent residues must be dragged deep into the polar headgroup region (Fig. 1 B). If the surface pressure in the polar headgroup region is comparable to that in the acyl chain region, the work required to bury the backbone and these residues in the polar headgroup region could be large. We reasoned that less work would be required if the membrane contained lipids with a very small polar headgroup such as cholesterol: cholesterol could diffuse into the region adjacent to the bound peptide, reducing local surface pressure. Thus, we investigated whether MARCKS(151–175) binds more strongly to phospholipid vesicles that contain cholesterol. We found that radioactively labeled MARCKS(151–175) binds with exactly the same molar partition coefficient to PC/PS (88:12) vesicles and to PC/PS/Ch (7:1:3) vesicles that contain a mol fraction of PS required to exactly match the ζ-potential of the PC/PS vesicles (data not shown). This observation is consistent with measurements on monolayers that show binding of ∼1 MARCKS(151–175) per 100 lipids on a PC/PS/PIP2 (70:30:1) monolayer produces only a small increase in the surface pressure (<1 mN/m; data not shown). The simplest, albeit speculative, interpretation is that the surface pressure in the polar headgroup region of a bilayer formed from lipids with unsaturated acyl chains is low, and that the insertion of peptides into this region can be accomplished with very little work against this surface pressure.
Caroni and colleagues (Laux et al., 2000; Caroni, 2001) suggested the MARCKS protein (and two neuronal proteins, GAP43 and CAP23) may be concentrated in cholesterol-enriched domains, or rafts, in cells, because these proteins bind to PIP2 that is apparently concentrated in these cholesterol-enriched domains (Pike and Miller, 1998). We wanted to explore whether there is an obvious relationship between MARCKS(151–175), PIP2, and cholesterol-enriched rafts in a simple model system. We used epi-fluorescence microscopy to observe large (>5 μm) cholesterol-enriched domains that form spontaneously in monolayers (Keller, 2002; Radhakrishnan and McConnell, 1999). We observed that PIP2 is excluded from the cholesterol-enriched domains, as monitored by its ability to bind either EGFP-PH or MARCKS(151–175) from the subphase (not shown); Bodipy-TMR-PIP2 is also excluded. The exclusion of PIP2 from these cholesterol-enriched domains in simple model systems is expected because PIP2 contains a polyunsaturated chain (Silvius, 2003; Brown and London, 2000). Of course these experiments on rafts in a simple model system cannot easily be extrapolated to living cells: the size, composition, lifetime, and mechanism of formation of putative rafts in cell membranes are all still unknown (Edidin, 2003; McIntosh et al., 2003).
References
- Aderem, A. 1992. The MARCKS brothers: a family of protein kinase C substrates. Cell. 71:713–716. [DOI] [PubMed] [Google Scholar]
- Akashi, K., H. Miyata, H. Itoh, and K. Kinosita, Jr. 1996. Preparation of giant liposomes in physiological conditions and their characterization under an optical microscope. Biophys. J. 71:3242–3250. [DOI] [PMC free article] [PubMed] [Google Scholar]
- Albert, K. A., A. C. Nairn, and P. Greengard. 1987. The 87-kDa protein, a major specific substrate for protein kinase C: purification from bovine brain and characterization. Proc. Natl. Acad. Sci. USA. 84:7046–7050. [DOI] [PMC free article] [PubMed] [Google Scholar]
- Allen, L. A., and A. Aderem. 1995. A role for MARCKS, the α isozyme of protein kinase C and myosin I in zymosan phagocytosis by macrophages. J. Exp. Med. 182:829–840. [DOI] [PMC free article] [PubMed] [Google Scholar]
- Arbuzova, A., K. Martushova, G. Hangyas-Mihalyne, A. J. Morris, S. Ozaki, G. D. Prestwich, and S. McLaughlin. 2000a. Fluorescently labeled neomycin as a probe of phosphatidylinositol-4, 5-bisphosphate in membranes. Biochim. Biophys. Acta. 1464:35–48. [DOI] [PubMed] [Google Scholar]
- Arbuzova, A., D. Murray, and S. McLaughlin. 1998. MARCKS, membranes, and calmodulin: kinetics of their interaction. Biochim. Biophys. Acta. 1376:369–379. [DOI] [PubMed] [Google Scholar]
- Arbuzova, A., A. A. Schmitz, and G. Vergeres. 2002. Cross-talk unfolded: MARCKS Proteins. Biochem. J. 362:1–12. [DOI] [PMC free article] [PubMed] [Google Scholar]
- Arbuzova, A., L. Wang, J. Wang, G. Hangyas-Mihalyne, D. Murray, B. Honig, and S. McLaughlin. 2000b. Membrane binding of peptides containing both basic and aromatic residues. Experimental studies with peptides corresponding to the scaffolding region of caveolin and the effector region of MARCKS. Biochemistry. 39:10330–10339. [DOI] [PubMed] [Google Scholar]
- Aveyard, R., and D. A. Haydon. 1973. An Introduction to the Principles of Surface Chemistry. Cambridge University Press, Cambridge, UK.
- Balla, T., and P. Varnai. 2002. Visualizing Cellular Phosphoinositide Pools with GFP-Fused Protein-Modules. STKE (http://www.stke.org/cgi/content/full/OC_sigtrans); 2002/125/pl3:1–16. [DOI] [PubMed]
- Ben-Tal, N., B. Honig, R. M. Peitzsch, G. Denisov, and S. McLaughlin. 1996. Binding of small basic peptides to membranes containing acidic lipids: theoretical models and experimental results. Biophys. J. 71:561–575. [DOI] [PMC free article] [PubMed] [Google Scholar]
- Berney, C., and G. Danuser. 2003. FRET or no FRET: a quantitative comparison. Biophys. J. 84:3992–4010. [DOI] [PMC free article] [PubMed] [Google Scholar]
- Berridge, M. J., M. D. Bootman, and H. L. Roderick. 2003. Calcium signalling: dynamics, homeostasis and remodelling. Nat. Rev. Mol. Cell Biol. 4:517–529. [DOI] [PubMed] [Google Scholar]
- Berridge, M. J., and R. F. Irvine. 1984. Inositol trisphosphate, a novel second messenger in cellular signal transduction. Nature. 312:315–321. [DOI] [PubMed] [Google Scholar]
- Biggin, P. C., and M. S. Sansom. 1999. Interactions of alpha-helices with lipid bilayers: a review of simulation studies. Biophys. Chem. 76:161–183. [DOI] [PubMed] [Google Scholar]
- Binder, H., and G. Lindblom. 2003. Charge-dependent translocation of the trojan peptide penetratin across lipids membranes. Biophys. J. 85:982–995. [DOI] [PMC free article] [PubMed] [Google Scholar]
- Blackshear, P. J. 1993. The MARCKS family of cellular protein kinase C substrates. J. Biol. Chem. 268:1501–1504. [PubMed] [Google Scholar]
- Botelho, R. J., M. Teruel, R. Dierckman, R. Anderson, A. Wells, J. D. York, T. Meyer, and S. Grinstein. 2000. Localized biphasic changes in phosphatidylinositol-4,5-bisphosphate at sites of phagocytosis. J. Cell Biol. 151:1353–1368. [DOI] [PMC free article] [PubMed] [Google Scholar]
- Brooks, B. R., R. E. Bruccoleri, B. D. Olafson, D. J. States, S. Swaminathan, and M. Karplus. 1983. CHARMM: a program for macromolecular energy, minimization, and dynamics calculations. J. Comput. Chem. 4:187–217. [Google Scholar]
- Brown, D. A., and E. London. 2000. Structure and function of sphingolipid- and cholesterol-rich membrane rafts. J. Biol. Chem. 275:17221–17224. [DOI] [PubMed] [Google Scholar]
- Bunce, C. M., P. H. French, P. Allen, J. C. Mountford, B. Moor, M. F. Greaves, R. H. Michell, and G. Brown. 1993. Comparison of the levels of inositol metabolites in transformed heamopoietic cells and their normal counterparts. Biochem. J. 289:667–673. [DOI] [PMC free article] [PubMed] [Google Scholar]
- Burack, W. R., and A. S. Shaw. 2000. Signal transduction: hanging on a scaffold. Curr. Opin. Cell Biol. 12:211–216. [DOI] [PubMed] [Google Scholar]
- Buser, C. A., and S. McLaughlin. 1998. Ultracentrifugation technique for measuring the binding of peptides and proteins to sucrose-loaded phospholipid vesicles. Methods Mol. Biol. 84:267–281. [DOI] [PubMed] [Google Scholar]
- Buser, C. A., C. T. Sigal, M. D. Resh, and S. McLaughlin. 1994. Membrane binding of myristylated peptides corresponding to the NH2-terminus of Src. Biochemistry. 33:13093–13101. [DOI] [PubMed] [Google Scholar]
- Cantley, L. C. 2002. The phosphoinositide 3-kinase pathway. Science. 296:1655–1657. [DOI] [PubMed] [Google Scholar]
- Caroni, P. 2001. Actin cytoskeleton regulation through modulation of PI(4,5)P2 rafts. EMBO J. 20:4332–4336. [DOI] [PMC free article] [PubMed] [Google Scholar]
- Cremona, O., and P. De Camilli. 2001. Phosphoinositides in membrane traffic at the synapse. J. Cell Sci. 114:1041–1052. [DOI] [PubMed] [Google Scholar]
- Cunningham, C. C., R. Vegners, R. Bucki, M. Funaki, N. Korde, J. H. Hartwig, T. P. Stossel, and P. A. Janmey. 2001. Cell permeant polyphosphoinositide-binding peptides that block cell motility and actin assembly. J. Biol. Chem. 276:43390–43399. [DOI] [PubMed] [Google Scholar]
- Czech, M. P. 2003. Dynamics of phosphoinositides in membrane retrieval and insertion. Annu. Rev. Physiol. 65:791–815. [DOI] [PubMed] [Google Scholar]
- Dell'Acqua, M. L., M. C. Faux, J. Thorburn, A. Thorburn, and J. D. Scott. 1998. Membrane-targeting sequences on AKAP79 bind phosphatidylinositol-4,5-bisphosphate. EMBO J. 17:2246–2260. [DOI] [PMC free article] [PubMed] [Google Scholar]
- Dill, K. A., and S. Bromberg. 2003. Molecular Driving Forces: Statistical Thermodynamics in Chemistry and Biology. Garland Science, New York. 387–407.
- Doughman, R. L., A. J. Firestone, M. L. Wojtasiak, M. W. Bunce, and R. A. Anderson. 2003a. Membrane ruffling requires coordination between Type Iα phosphatidylinositol phosphate kinase and Rac signaling. J. Biol. Chem. 278:23036–23045. [DOI] [PubMed] [Google Scholar]
- Doughman, R. L., A. J. Firestone, and R. A. Anderson. 2003b. Phosphatidylinositol phosphate kinases put PI4,5P2 in its place. J. Membr. Biol. 194:77–89. [DOI] [PubMed] [Google Scholar]
- Edidin, M. 2003. Lipids on the frontier: a century of cell-membrane bilayers. Nat. Rev. Mol. Cell Biol. 4:414–418. [DOI] [PubMed] [Google Scholar]
- Edwards, A. S., and J. D. Scott. 2000. A-kinase anchoring proteins: protein kinase A and beyond. Curr. Opin. Cell Biol. 12:217–221. [DOI] [PubMed] [Google Scholar]
- Ellena, J. F., M. C. Burnitz, and D. S. Cafiso. 2003. Location of the myristoylated alanine-rich C-kinase substrate (MARCKS) effector domain in negatively charged phospholipid bicelles. Biophys. J. 85:2442–2448. [DOI] [PMC free article] [PubMed] [Google Scholar]
- Engelman, D. M., T. A. Steitz, and A. Goldman. 1986. Identifying nonpolar transbilayer helices in amino acid sequences of membrane proteins. Annu. Rev. Biophys. Biophys. Chem. 15:321–353. [DOI] [PubMed] [Google Scholar]
- Ferguson, K. M., M. A. Lemmon, J. Schlessinger, and P. B. Sigler. 1995. Structure of the high affinity complex of inositol trisphosphate with a phospholipase C pleckstrin homology domain. Cell. 83:1037–1046. [DOI] [PubMed] [Google Scholar]
- Ferrell, J. E., and W. H. Huestis. 1984. Phosphoinositide metabolism and the morphology of human erythrocytes. J. Cell Biol. 98:1992–1998. [DOI] [PMC free article] [PubMed] [Google Scholar]
- Gallagher, K., and K. A. Sharp. 1998. Electrostatic contributions to heat capacity changes of DNA-ligand binding. Biophys. J. 75:769–776. [DOI] [PMC free article] [PubMed] [Google Scholar]
- Garcia, P., R. Gupta, S. Shah, A. J. Morris, S. A. Rudge, S. Scarlata, V. Petrova, S. McLaughlin, and M. J. Rebecchi. 1995. The pleckstrin homology domain of phospholipase C-δ1 binds with high affinity to phosphatidylinositol 4,5-bisphosphate in bilayer membranes. Biochemistry. 34:16228–16234. [DOI] [PubMed] [Google Scholar]
- Gelman, I. H. 2002. The role of SSeCKS/gravin/AKAP12 scaffolding proteins in the spaciotemporal control of signaling pathways in oncogenesis and development. Front. Biosci. 7:d1782–d1797. [DOI] [PubMed] [Google Scholar]
- Groves, J. R., S. G. Boxer, and H. M. McConnell. 2000. Electric field effects in mulitcomponent fluid lipid membranes. Phys. Chem. B. 104:119–124. [Google Scholar]
- Hagelberg, C., and D. Allan. 1990. Restricted diffusion of integral membrane proteins and polyphosphoinositides leads to their depletion in microvesicles released from human erythrocytes. Biochem. J. 271:831–834. [DOI] [PMC free article] [PubMed] [Google Scholar]
- Haleva, E., N. Ben-Tal, and H. Diamant. 2003. Increased concentration of polyvalent phospholipids in the adsorption domain of a charged protein. Biophys. J. 86:2165–2178. [DOI] [PMC free article] [PubMed] [Google Scholar]
- Harlan, J. E., P. J. Hajduk, H. S. Yoon, and S. W. Fesik. 1994. Pleckstrin homology domains bind to phosphatidylinositol-4,5-bisphosphate. Nature. 371:168–170. [DOI] [PubMed] [Google Scholar]
- Hilgemann, D. W., S. Feng, and C. Nasuhoglu. 2001. The Complex and Intriguing Lives of PI(4,5)P2 with Ion Channels and Transporters. STKE (http://www.stke.org/cgi/content/full/OC_sigtrans); 2001/111/re19:1–8. [DOI] [PubMed]
- Jackson, J. D. 1975. Classical Electrodynamics. Wiley, New York. 147–52.
- Keller, S. 2002. Coexisting liquid phases in lipid monolayers and bilayers. Journal of Physics: Condensed Matter. 14:4763–4766. [Google Scholar]
- Kim, J., T. Shishido, X. Jiang, A. Aderem, and S. McLaughlin. 1994. Phosphorylation, high ionic strength, and calmodulin reverse the binding of MARCKS to phospholipid vesicles. J. Biol. Chem. 269:28214–28219. [PubMed] [Google Scholar]
- Lakowicz, J. R 1999. Principles of Fluorescence Spectroscopy. Kluwer Academic/Plenum Publishing, New York. 367–94.
- Laux, T., K. Fukami, M. Thelen, T. Golub, D. Frey, and P. Caroni. 2000. GAP43, MARCKS, and CAP23 modulate PI(4,5)P2 at plasmalemmal rafts, and regulate cell cortex actin dynamics through a common mechanism. J. Cell Biol. 149:1455–1472. [DOI] [PMC free article] [PubMed] [Google Scholar]
- Lemmon, M. A. 2003. Phosphoinositide recognition domains. Traffic. 4:201–213. [DOI] [PubMed] [Google Scholar]
- Lemmon, M. A., K. M. Ferguson, R. O'Brien, P. B. Sigler, and J. Schlessinger. 1995. Specific and high-affinity binding of inositol phosphates to an isolated pleckstrin homology domain. Proc. Natl. Acad. Sci. USA. 92:10472–10476. [DOI] [PMC free article] [PubMed] [Google Scholar]
- Lim, W. A. 2002. The modular logic of signaling proteins: building allosteric switches from simple binding domains. Curr. Opin. Struct. Biol. 12:61–68. [DOI] [PubMed] [Google Scholar]
- Lindgren, M., M. Hallbrink, A. Prochiantz, and U. Langel. 2000. Cell-penetrating peptides. Trends Pharmacol. Sci. 21:99–103. [DOI] [PubMed] [Google Scholar]
- Marshall, J. G., J. W. Booth, V. Stambolic, T. Mak, T. Balla, A. D. Schreiber, T. Meyer, and S. Grinstein. 2001. Restricted accumulation of phosphatidylinositol 3-kinase products in a plasmalemmal subdomain during Fcγ receptor-mediated phagocytosis. J. Cell Biol. 153:1369–1380. [DOI] [PMC free article] [PubMed] [Google Scholar]
- Martin, T. F. 2001. PI(4,5)P2 regulation of surface membrane traffic. Curr. Opin. Cell Biol. 13:493–499. [DOI] [PubMed] [Google Scholar]
- Mathias, R. T., G. J. Baldo, K. Manivannan, and S. McLaughlin. 1992. Discrete charges on biological membranes. In Electrified Interfaces in Physics, Chemistry and Biology. R. Guidelli, editor. Kluwer Academic Publishers, Dordrecht, The Netherlands. 473–90.
- May, S., D. Harries, and A. Ben-Shaul. 2000. Lipid demixing and protein-protein interactions in the adsorption of charged proteins on mixed membranes. Biophys. J. 79:1747–1760. [DOI] [PMC free article] [PubMed] [Google Scholar]
- McIntosh, T. J., A. Vidal, and S. A. Simon. 2003. Sorting of lipids and transmembrane peptides between detergent-soluble bilayers and detergent-resistant rafts. Biophys. J. 85:1656–1666. [DOI] [PMC free article] [PubMed] [Google Scholar]
- McLaughlin, S. 1977. Electrostatic potentials at membrane-solution interfaces. Current Topics in Membranes and Transport. 9:71–144. [Google Scholar]
- McLaughlin, S. 1989. The electrostatic properties of membranes. Annu. Rev. Biophys. Biophys. Chem. 18:113–136. [DOI] [PubMed] [Google Scholar]
- McLaughlin, S., and A. Aderem. 1995. The myristoyl-electrostatic switch: a modulator of reversible protein-membrane interactions. Trends Biochem. Sci. 20:272–276. [DOI] [PubMed] [Google Scholar]
- McLaughlin, S., J. Wang, A. Gambhir, and D. Murray. 2002. PIP2 and proteins: interactions, organization, and information flow. Annu. Rev. Biophys. Biomol. Struct. 31:151–175. [DOI] [PubMed] [Google Scholar]
- Mitchell, K. T., J. E. Ferrell, Jr., and W. H. Huestis. 1986. Separation of phosphoinositides and other phospholipids by two-dimensional thin-layer chromatography. Anal. Biochem. 158:447–453. [DOI] [PubMed] [Google Scholar]
- Murray, D., A. Arbuzova, G. Hangyas-Mihalyne, A. Gambhir, N. Ben-Tal, B. Honig, and S. McLaughlin. 1999. Electrostatic properties of membranes containing acidic lipids and adsorbed basic peptides: theory and experiment. Biophys. J. 77:3176–3188. [DOI] [PMC free article] [PubMed] [Google Scholar]
- Murray, D., A. Arbuzova, B. Honig, and S. McLaughlin. 2002. The role of electrostatic and nonpolar interactions in the association of peripheral proteins with membranes. Curr. Top. Membr. 52:271–302. [Google Scholar]
- Myat, M. M., S. Anderson, L. H. Allen, and A. Aderem. 1997. MARCKS regulates membrane ruffling and cell spreading. Curr. Biol. 7:611–614. [DOI] [PubMed] [Google Scholar]
- Nicholls, A., K. A. Sharp, and B. Honig. 1991. Protein folding and association: insights from the interfacial and thermodynamic properties of hydrocarbon. Proteins. 11:281–296. [DOI] [PubMed] [Google Scholar]
- Ohmori, S., N. Sakai, Y. Shira, H. Yamamoto, E. Miyamoto, N. Shimizu, and N. Saito. 2000. Importance of protein kinase C targeting for the phosphorylation of its substrate, myristoylated alanine-rich C-kinase substrate. J. Biol. Chem. 275:26449–26457. [DOI] [PubMed] [Google Scholar]
- Osborne, S. L., F. A. Meunier, and G. Schiavo. 2001. Phosphoinositides as key regulators of synaptic function. Neuron. 32:9–12. [DOI] [PubMed] [Google Scholar]
- Parsegian, A. 1969. Energy of an ion crossing a low dielectric membrane: solutions to four relevant electrostatic problems. Nature. 221:844–846. [DOI] [PubMed] [Google Scholar]
- Payrastre, B., K. Missy, S. Giuriato, S. Bodin, M. Plantavid, and M. Gratacap. 2001. Phosphoinositides: key players in cell signalling, in time and space. Cell. Signal. 13:377–387. [DOI] [PubMed] [Google Scholar]
- Peitzsch, R. M., M. Eisenberg, K. A. Sharp, and S. McLaughlin. 1995. Calculations of the electrostatic potential adjacent to model phospholipid bilayers. Biophys. J. 68:729–738. [DOI] [PMC free article] [PubMed] [Google Scholar]
- Pentyala, S., E. Tall, S. Mathew, K. Tanguturi, P. Yalamanchili, and M. Rebecchi. 2003. Fluorescent chimeras and living colors: unraveling the mysteries of cell signaling—the story of phospholipase C-δ1. In Radiobiology and Biomedical Research. K. P. Mishra, editor. Narosa Publishing House, New Delhi, India. 134–143.
- Pike, L. J., and J. M. Miller. 1998. Cholesterol depletion delocalizes phosphatidylinositol bisphosphate and inhibits hormone-stimulated phosphatidylinositol turnover. J. Biol. Chem. 273:22298–22304. [DOI] [PubMed] [Google Scholar]
- Prescott, E. D., and D. Julius. 2003. A modular PIP2 binding site as a determinant of capsaicin receptor sensitivity. Science. 300:1284–1288. [DOI] [PubMed] [Google Scholar]
- Qin, Z., and D. S. Cafiso. 1996. Membrane structure of the protein kinase C and calmodulin binding domain of myristoylated alanine rich C kinase substrate determined by site-directed spin labeling. Biochemistry. 35:2917–2925. [DOI] [PubMed] [Google Scholar]
- Radhakrishnan, A., and H. M. McConnell. 1999. Condensed complexes of cholesterol and phospholipids. Biophys. J. 77:1507–1517. [DOI] [PMC free article] [PubMed] [Google Scholar]
- Rauch, M. E., C. G. Ferguson, G. D. Prestwich, and D. S. Cafiso. 2002. Myristoylated alanine-rich C kinase substrate (MARCKS) sequesters spin-labeled phosphatidylinositol-4,5-bisphosphate in lipid bilayers. J. Biol. Chem. 277:14068–14076. [DOI] [PubMed] [Google Scholar]
- Raucher, D., T. Stauffer, W. Chen, K. Shen, S. Guo, J. D. York, M. P. Sheetz, and T. Meyer. 2000. Phosphatidylinositol 4,5-bisphosphate functions as a second messenger that regulates cytoskeleton-plasma membrane adhesion. Cell. 100:221–228. [DOI] [PubMed] [Google Scholar]
- Rebecchi, M. J., and S. N. Pentyala. 2000. Structure, function, and control of phosphoinositide-specific phospholipase C. Physiol. Rev. 80:1291–1335.11015615 [Google Scholar]
- Rhee, S. G. 2001. Regulation of phosphoinositide-specific phospholipase C. Annu. Rev. Biochem. 70:281–312. [DOI] [PMC free article] [PubMed] [Google Scholar]
- Rossi, E. A., Z. Li, H. Feng, and C. S. Rubin. 1999. Characterization of the targeting, binding, and phosphorylation site domains of an A kinase anchor protein and a myristoylated alanine-rich C kinase substrate-like analog that are encoded by a single gene. J. Biol. Chem. 274:27201–27210. [DOI] [PubMed] [Google Scholar]
- Roux, M., J. M. Neumann, M. Bloom, and P. F. Devaux. 1988. 2H and 31P NMR study of pentalysine interaction with headgroup deuterated phosphatidylcholine and phosphatidylserine. Eur. Biophys. J. 16:267–273. [DOI] [PubMed] [Google Scholar]
- Runnels, L. W., L. Yue, and D. Clapham. 2002. The TRPM7 channel is inactivated by PIP2 hydrolysis. Nat. Cell Biol. 4:329–336. [DOI] [PubMed] [Google Scholar]
- Sciorra, V. A., M. A. Frohman, and A. J. Morris. 2000. Regulation of phospholipase D signaling by phosphoinositides. In Biology of Phosphoinositides. S. Cockcroft, editor. Oxford University Press, Oxford, UK.
- Segrest, J. P., M. A. Jones, V. K. Mishra, and G. M. Anantharamaiah. 2002. Experimental and computational studies of the interactions of amphipathic peptides with lipid surfaces. In Peptide-Lipid Interactions. S. A. Simon and T. J. McIntosh, editors. Academic Press, San Diego, CA. 397–435.
- Silvius, J. R. 2003. Role of cholesterol in lipid raft formation: lessons from lipid model systems. Biochim. Biophys. Acta. 1610:174–183. [DOI] [PubMed] [Google Scholar]
- Simon, S. A., and T. J. McIntosh. 2002. Peptide-Lipid Interactions. Academic Press, San Diego, CA.
- Simonsen, A., A. E. Wurmser, S. D. Emr, and H. Stenmark. 2001. The role of phosphoinositides in membrane transport. Curr. Opin. Cell Biol. 13:485–492. [DOI] [PubMed] [Google Scholar]
- Stillinger, F. H. 1961. Interfacial solutions of the Poisson-Boltzmann equation. J. Chem. Phys. 35:1584–1589. [Google Scholar]
- Strandberg, E., S. Morein, D. T. Rijkers, R. M. Liskamp, P. C. van der Wel, and J. A. Killian. 2002. Lipid dependence of membrane anchoring properties and snorkeling behavior of aromatic and charged residues in transmembrane peptides. Biochemistry. 41:7190–7198. [DOI] [PubMed] [Google Scholar]
- Swierczynski, S. L., and P. J. Blackshear. 1995. Membrane association of the myristoylated alanine-rich C kinase substrate (MARCKS) protein. Mutational analysis provides evidence for complex interactions. J. Biol. Chem. 270:13436–13445. [DOI] [PubMed] [Google Scholar]
- Tall, E., I. Spector, S. N. Pentyala, I. Bitter, and M. J. Rebecchi. 2000. Dynamics of phosphatidylinositol 4,5-bisphosphate in actin-supported structures. Curr. Biol. 10:743–746. [DOI] [PubMed] [Google Scholar]
- Tran, D., P. Gascard, B. Berthon, K. Fukami, T. Takenawa, F. Giraud, and M. Claret. 1993. Cellular distribution of polyphosphoinositides in rat hepatocytes. Cell. Signal. 5:565–581. [DOI] [PubMed] [Google Scholar]
- Van Der Meer, B. W., G. Coker, and S. Y. S. Chen. 1994. Resonance Energy Transfer: Theory and Data. VCH Publishers, New York.
- Vanhaesebroeck, B., S. J. Leevers, K. Ahmadi, J. Timms, R. Katso, P. C. Driscoll, R. Woscholski, P. J. Parker, and M. D. Waterfield. 2001. Synthesis and function of 3-phosphorylated inositol lipids. Annu. Rev. Biochem. 70:535–602. [DOI] [PubMed] [Google Scholar]
- Victor, K., J. Jacob, and D. S. Cafiso. 1999. Interactions controlling the membrane binding of basic protein domains: phenylalanine and the attachment of the myristoylated alanine-rich C-kinase substrate protein to interfaces. Biochemistry. 38:12527–12536. [DOI] [PubMed] [Google Scholar]
- Wang, J., A. Arbuzova, G. Hangyas-Mihalyne, and S. McLaughlin. 2001. The effector domain of myristoylated alanine-rich C kinase substrate binds strongly to phosphatidylinositol 4,5-bisphosphate. J. Biol. Chem. 276:5012–5019. [DOI] [PubMed] [Google Scholar]
- Wang, J., A. Gambhir, G. Hangyas-Mihalyne, D. Murray, U. Golebiewska, and S. McLaughlin. 2002. Lateral sequestration of phosphatidylinositol 4,5-bisphosphate by the basic effector domain of myristoylated alanine-rich C kinase substrate is due to nonspecific electrostatic interactions. J. Biol. Chem. 277:34401–34412. [DOI] [PubMed] [Google Scholar]
- Wang, J., A. Gambhir, S. McLaughlin, and D. Murray. 2003. A computational model for the electrostatic sequestration of PI(4,5)P2 by membrane-adsorbed basic peptides. Biophys. J. 86:1969–1986. [DOI] [PMC free article] [PubMed] [Google Scholar]
- White, D. A. 1973. The phospholipid composition of mammalian tissues. In Form and Function of Phospholipids. R. M. C. Dawson, J. N. Hawthorne, and G. B. Ansell, editors. Elsevier Scientific Publishing Company, Amsterdam, The Netherlands. 441–78.
- Williams, R. L., and M. Katan. 1996. Structural views of phosphoinositide-specific phospholipase C: signalling the way ahead. Structure. 4:1387–1394. [DOI] [PubMed] [Google Scholar]
- Yamauchi, E., T. Nakatsu, M. Matsubara, H. Kato, and H. Taniguchi. 2003. Crystal structure of a MARCKS peptide containing the calmodulin-binding domain in complex with Ca2+-calmodulin. Nat. Struct. Biol. 10:226–231. [DOI] [PubMed] [Google Scholar]
- Yin, H. L., and P. A. Janmey. 2003. Phosphoinositide regulation of the actin cytoskeleton. Annu. Rev. Physiol. 65:761–789. [DOI] [PubMed] [Google Scholar]
- Yorek, M. A. 1993. Biological distribution. In Phospholipids Handbook. G. Cevc, editor. Marcel Dekker, New York. 745–75.
- Zhang, W., E. Crocker, S. McLaughlin, and S. O. Smith. 2003. Binding of peptides with basic and aromatic residues to bilayer membranes: phenylalanine in the MARCKS effector domain penetrates into the hydrophobic core of the bilayer. J. Biol. Chem. 278:21459–21466. [DOI] [PubMed] [Google Scholar]


