Abstract
Two retinylidene proteins, CSRA and CSRB, have recently been shown by photoelectrophysiological analysis of RNAi-transformants to mediate phototaxis signaling in Chlamydomonas reinhardtii. Here we report immunoblot detection of CSRA and CSRB apoproteins in C. reinhardtii cells enabling assessment of the cellular content of the receptors. We obtain 9 × 10⁴ CSRA and 1.5 × 10⁴ CSRB apoprotein molecules per cell in vegetative cells of the wild-type strain 495, a higher value than that for functional receptor cellular content estimated previously from photosensitivity measurements and retinal extraction yields. Exploiting our ability to control the CSRA/CSRB ratio by transformation with receptor gene-directed RNAi, we report analysis of the CSRA and CSRB roles in the photophobic response of the organism by action spectroscopy with automated cell tracking/motion analysis. The results show that CSRA and CSRB each mediate the photophobic swimming response, a second known retinal-dependent photomotility behavior in C. reinhardtii. Due to the different light saturation and spectral properties of the two receptors, CSRA is dominantly responsible for photophobic responses, which appear at high light intensity.
INTRODUCTION
Chlamydomonas reinhardtii and other green algae exhibit two types of motility responses to light: phototaxis, the oriented swimming of cells along the direction of a light beam, and the photophobic response, a reorientation of swimming direction induced by an abrupt increase in light intensity (Witman, 1993; Kreimer, 1994; Hegemann, 1997). Both types of photobehavior require the chromophore retinal (Foster et al., 1984; Lawson et al., 1991; Hegemann et al., 1991; Takahashi et al., 1991) and involve generation of kinetically complex electrical currents in the plasma membrane by photostimulation (Litvin et al., 1978; Sineshchekov et al., 1978, 1990; Harz and Hegemann, 1991; Sineshchekov and Govorunova, 2001). Recently, two retinylidene proteins homologous to archaeal rhodopsins were shown to mediate light-generated currents associated with phototaxis orientation by electrophysiological measurements of transformants in which their cellular concentrations were selectively reduced by RNAi (Sineshchekov et al., 2002). The proteins were therefore concluded to be phototaxis receptors and named CSRA and CSRB. The same proteins were independently reported by two other research groups. CSRA, under the name channelrhodopsin-1, was shown to be photoactive when expressed in Xenopus oocytes (Nagel et al., 2002) and, under the name Acop1, to be localized in the eyespot region of Chlamydomonas cells (Suzuki et al., 2003). Chlamydomonas phototaxis receptors are so far the only eukaryotic microbial rhodopsins whose function in the cell is known (Ebrey, 2002; Ridge, 2002; Jung and Spudich, 2004).
The electrophysiological measurements revealed several differences between the two receptors (Sineshchekov et al., 2002). CSRA and CSRB mediate two kinetically different photoreceptor currents, a fast and a slow current, at high and low light intensities, respectively. Also, the action spectra of photoreceptor currents in RNAi transformants indicated that the absorption maximum of CSRA (∼500–510 nm) is red-shifted with respect to that of CSRB (∼460–470 nm). Since the photophobic response is triggered by the membrane depolarization caused by the photoreceptor current (Litvin et al., 1978; Sineshchekov, 1991; Holland et al., 1997), we suggested that both rhodopsins are photosensory receptors not only for phototaxis but also for photophobic responses (Sineshchekov et al., 2002), but no direct evidence was available at that time. The absence of other recognizable retinylidene protein-encoding genes in the recently completed C. reinhardtii genome further suggested that at least one of them would be a photophobic response receptor.
Isolation and biochemical purification of photoreceptor proteins from C. reinhardtii has not yet been achieved. Therefore, prior to their identification last year, only indirect approaches could be used to estimate their concentrations in living cells. Those include calculations based on the threshold stimulus intensity of phototaxis and geometrical considerations (Foster and Smyth, 1980), freeze-etch electron microscopy that reveals intramembrane particles interpreted as photoreceptor complexes (Melkonian and Robenek, 1980), and measurement of the amount of retinal extracted from cells (Beckmann and Hegemann, 1991; Hegemann et al., 1991). These approaches did not take into account the existence of two photoreceptor pigments and did not separately probe for each of the two rhodopsins. The identification of the two photoreceptor genes created the possibility of direct titration of the apoprotein concentration in the cells by immunodetection calibrated with known amounts of standard antigens.
Here we report quantitative assessment of CSOA and CSOB concentrations in the wild-type and a newly isolated CSRA-RNAi transformant. In this new transformant and in the earlier reported transformant (Sineshchekov et al., 2002), a decrease in CSOA content correlates in an identical manner with changes in photoelectric currents and photobehavior, which confirms that these changes are indeed caused by suppression of CSOA and were not a result of a spontaneous mutation or disruption of another gene by random incorporation of the transforming construct. Using the new transformant and automated cell tracking/motion analysis we show directly that both CSRA and CSRB mediate photophobic responses by C. reinhardtii cells, the former being the dominant photoreceptor for this behavior.
METHODS
Strains and culture conditions
C. reinhardtii strain 495 was obtained from Dr. A. S. Chunaev (St. Petersburg State University, St. Petersburg, Russia). Cultures were maintained on Tris-acetate-phosphate (TAP) medium (Harris, 1989) agar plates under continuous illumination. Liquid TAP cultures were inoculated from plates and cells in the early exponential growth phase were used for experiments. Gametes were obtained by overnight incubation in nitrogen-free medium (3 mM K2HPO4, 3 mM KH2PO4, and 0.1 mM CaCl2). Escherichia coli strain DH5α was used for cloning and strain BL21 for expression of N-terminal polypeptides. E. coli transformants were grown on Luria-Bertani medium in the presence of ampicillin (50 μg/ml) at 37°C.
Chlamydomonas transformation and mutant selection
The linearized pSP124S plasmid containing the hairpin dsRNA construct for CSOA and the ble selection marker that confers resistance to Zeocin were introduced into Chlamydomonas strain 495 by electroporation as described earlier (Sineshchekov et al., 2002). The transformants were selected on TAP agar plates supplemented with Zeocin (10 μg/ml) at 28°C and tested by measurement of photoelectric currents with a population assay (Sineshchekov et al., 1992, 1994) and immunoblot analysis with the anti-CSOA antibody.
Plasmid construction and protein purification for quantitation of CSOA and CSOB
The C-terminal regions of CSOA and CSOB encoding 349 (out of 712) and 412 (out of 737) amino acid residues, respectively, were expressed in E. coli and purified on a Ni2+-affinity column. N-terminal His6 tags and NdeI/HindIII restriction sites were added by PCR using the plasmids containing the complete cDNA sequences of CSOA and CSOB as templates. The NdeI/HindIII fragments were cloned into a modified version of the E. coli vector pET15b (Jung et al., 2001). From this vector, the constructs were transferred to the XbaI/HindIII site of a modified expression vector pMS107 (Jung et al., 2001). The resultant plasmids were partially sequenced to verify correct insertion of the constructs. Transformed E. coli cells were sonicated in the buffer containing 150 mM NaCl and 30 mM Tris-HCl, pH 7.0, and centrifuged at 2600 × g to remove unbroken cells and cell debris. The C-terminal domains of CSOA and CSOB contain hydrophobic regions with the predicted secondary structure of the CSOA C-terminal domain exhibiting two transmembrane helices (Sineshchekov et al., 2002). Therefore, for solubilization of His6-tagged polypeptides cell lysates were incubated for 20 min with 1% n-dodecyl-β-d-maltopyranoside (DDM) (Anatrace, Maumee, OH) at 4°C. Nonsolubilized material was removed by a second centrifugation at 20,000 × g for 15 min at 4°C. The supernatant was combined with Ni2+-agarose (Quiagen, Valencia, CA) and incubated for 4 h on a rotator at 4°C in the presence of 5 mM imidazole. The mixture was washed twice with two bed volumes of 20 mM imidazole and eluted with 250 mM imidazole in the same buffer containing 0.01% DDM. The fractions with the highest OD280 were collected and dialyzed against the same buffer without imidazole. Protein concentration was measured with the protein assay kit from Bio-Rad Laboratories (Hercules, CA). The contents of CSOA- and CSOB-derived C-terminal fragments were, respectively, ∼17% and ∼25% of total protein in the eluate, as determined by densitometry of Coomassie-stained SDS-PAGE gels. The bands corresponding to the expressed His-tagged polypeptides were the only ones in the eluate recognized by both anti-CSOA and anti-CSOB antibodies; therefore, no further purification was required. The bands were verified by immunoblots with a commercial anti-His6 antibody (BD Biosciences Clontech, Palo Alto, CA). The yields of CSOA- and CSOB-derived polypeptides were ∼2 and ∼1 mg/l of E. coli culture, respectively, which is within a typical range for expression of membrane proteins in this system.
Immunoblot analysis
Polyclonal rabbit antibodies (Alpha Diagnostics, San Antonio, TX) were raised against synthetic peptides corresponding to 19 C-terminal amino acid residues of CSOA and CSOB (EMLQQLMSEINRLKNELGE and EMLQNLMNEINRLKNELGE, respectively). The relative sensitivities of the previously used anti-CSOA antibody (Sineshchekov et al., 2002) and the new anti-CSOB antibody toward CSOA and CSOB were determined by dot blot titration using E. coli-expressed C-terminal polypeptides as standard antigens. The anti-CSOA antibody has an ∼1.4-fold preference for the CSOA polypeptide over that of CSOB, and the anti-CSOB antibody an ∼3.2-fold preference for CSOB. Immunodetection of CSOA and CSOB in Chlamydomonas was carried out in whole-cell lysates obtained by incubation of the cells with 3% SDS sample buffer. Cell concentration was determined with a hemacytometer prior to lysis. HRP-conjugated goat anti-rabbit antibody was from Bio-Rad Laboratories. The ECL (enhanced chemiluminescence) kit was from Amersham Biosciences (Piscataway, NJ). Films were analyzed with an AlphaImager system (Alpha Innotech, San Leandro, CA). Peak fitting was performed by Origin 7.0 software (OriginLab, Northampton, MA). Molecular weights were calculated using Bio-Rad broad range prestained standards. Mean values and standard errors were calculated from data obtained in independent preparations used for experiments on different days.
Automated cell tracking and motion analysis
The photophobic (“stop”) responses were detected as transient changes in the averaged speed of the cell population after the stimulating flash. Trajectories of 25–30 cells in the microscopic field were recorded and analyzed at 15 frames per second under red (>650 nm) monitoring light by a computerized tracking/motion analysis system with version 5.1 Expertvision program (Motion Analysis Systems, Santa Rosa, CA). Photophobic stimuli were delivered to the cells every 60 s from a Vivitar 283 camera flash through the objective. Four individual data collections for a desired spectral range and intensity of the stimulus (obtained by 40-nm half-band interference and neutral density filters) were averaged. Relative numbers of quanta at different spectral ranges were estimated using a piroelectric probe P-444 (Terahertz Technologies, Oriskany, NY). Normalized difference in the mean speed 1 s before and 1 s after the flash was used for quantitative comparison of responses. Suspensions of overnight gametes were diluted three- to fivefold with the same medium and incubated in the dark for 20 min before measurement.
RESULTS
Concentration of CSOA in the wild-type of C. reinhardtii
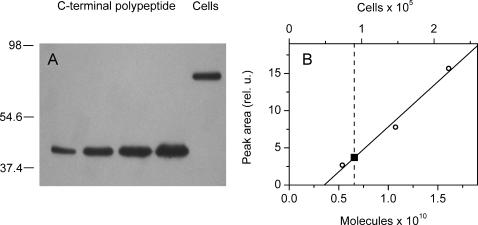
A C-terminal polypeptide of CSRA with a His6-tag added to its N-terminus was expressed in E. coli and purified by Ni2+-affinity chromatography to use as a standard antigen. A whole-cell extract from a known number of cells was tested against serial dilutions of the standard antigen, and a calibration curve was constructed by plotting peak areas of the standard bands against antigen concentrations. The amount of CSOA per cell was then estimated using a linear range of the calibration curve (Fig. 1). The results of three independent experiments yielded 9 ± 1 × 10⁴ (mean ± SE) CSRA apoprotein molecules per cell.
FIGURE 1.
Quantitation of the cellular content of CSOA in the wild-type C. reinhardtii. (A) Immunoblot of C-terminal polypeptide serial dilutions and a whole-cell extract. Positions of molecular weight markers in kDa are shown to the left. (B) Densitometric analysis of the blot data; (○, bottom abscissa) C-terminal polypeptide (data points in the linear range are shown); (▪, top abscissa) cell extract. For presentation purposes, the image shown in A was taken from the same membrane after a longer exposure than that used for the quantitative analysis.
Isolation of a new CSRA-RNAi transformant
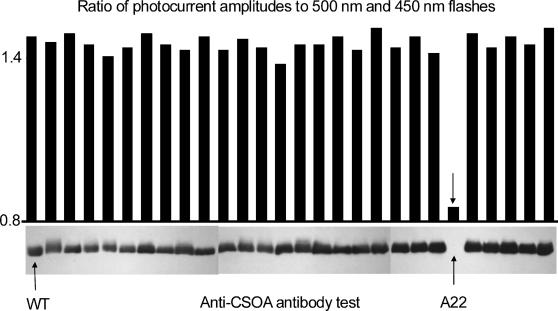
Fast screening of candidate strains, i.e., strains resistant to the selective antibiotic, was performed by measurement of the ratio of photocurrent amplitudes triggered by excitation with long- and short-wavelength flashes. As it was shown earlier (Sineshchekov et al., 2002), CSRA predominantly absorbs long- and CSRB short-wavelength light, so that this ratio of photocurrent amplitudes reflects the ratio of CSRA and CSRB concentrations in the cells. This ratio was greatly reduced in one transformant (A22, Fig. 2, top) out of 27 candidates. CSRA content in the candidates was then probed by immunoblot analysis (Fig. 2, bottom). A significant decrease of CSOA content in A22 was found (Fig. 2). Kinetics, fluence-response dependence, and spectral sensitivity of photocurrents, as well as CSRA and CSRB contents in this newly isolated transformant, were identical within experimental error to those of the first CSRA-RNAi transformant reported in our earlier study (Sineshchekov et al., 2002). Transformation with the plasmid containing only the selection marker, but not the RNAi construct, did not change either of these characteristics (data not shown).
FIGURE 2.
Selection of CSRA-RNAi transformants of C. reinhardtii. (Top) Ratio of amplitudes of photoreceptor currents elicited by flashes of 500 and 450 nm. (Bottom) Immunoblots of cell extracts treated with the anti-CSOA antibody.
Cellular content of CSOB in the wild-type and of CSOA and CSOB in the CSRA-deficient transformant A22
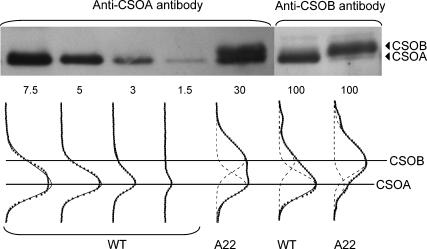
The amount of protein recognized by the anti-CSOA antibody was significantly reduced in RNAi-transformed strains compared to the wild-type in the previous study (Sineshchekov et al., 2002) and in this current report. Further electrophoresis analysis showed that the immunoblot density in the receptor band region in vegetative cells of the anti-CSOA transformant is resolved into two bands by the anti-CSOA antibody (Fig. 3). A lower band at 78.5 kDa Mr is evident both in the wild-type and in the A22 transformant. An upper band at 79.8 kDa is evident only in the transformant (Fig. 3). The reduced intensity of the lower band by CSRA-RNAi and the larger predicted molecular mass of CSOB (77.2 kDa) compared to CSOA (76.5 kDa) strongly suggested that the higher band in the transformant is CSOB, which we expect to be recognized by the anti-CSOA antibody from our analysis of the CSOA and CSOB C-terminal polypeptides. This interpretation is confirmed by the increase in the relative intensity of the upper band observed when identical samples were treated with the anti-CSOB antibody (Fig. 3). The anti-CSOB antibody also detects CSOB in the wild-type, although the intensity of this band there is much lower than in the transformant.
FIGURE 3.
Comparative immunoblot analysis of CSOA and CSOB in the wild-type and CSRA-RNAi transformant A22. (Top) Immunoblots of cell extracts treated with the anti-CSOA or anti-CSOB antibody; the amount of total protein per lane in micrograms is indicated below the image. (Bottom) Density profiles of the blots (solid squares) and their fit with asymmetric Gaussian functions (dashed lines, individual peaks; solid lines, superposition of the peaks).
The relative content of CSOA in the A22 transformant was determined by comparison with serial dilutions of the wild-type whole-cell lysate. Since electrophoretic bands of CSOA and CSOB overlap, for quantitative analysis the density profiles were decomposed by fitting individual peaks with asymmetric Gaussian functions, which out of several functions tested were found to provide the best fit to electrophoretic bands (Vohradsky and Panek, 1993). These functions also provided the best fit to our data, as judged by the χ2 criterion. The areas under fitted peaks were calculated, and a linear portion of the wild-type plot was used for construction of a calibration curve as was done for quantitation of CSOA in Fig. 2. The CSOA content in the A22 sampled 7 months after the transformation was 5% of that in the wild-type and increased to 12% 3 months after that, indicating a partial loss of the transformant phenotype. This was observed in cells maintained on both selective and nonselective medium. The mean CSOA content in data collected during the 3-month period was 9 ± 4% (mean ± SE) of the wild-type cellular concentration.
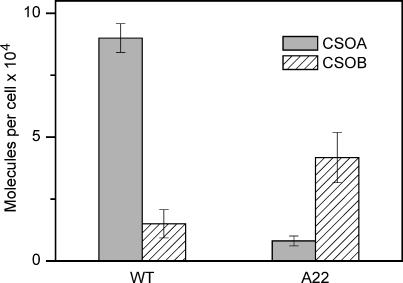
The CSOB/CSOA ratio was determined by applying a similar fitting procedure to the band densities obtained with the anti-CSOB antibody, which detects both CSOA and CSOB in both the wild-type and A22 transformant (Fig. 3). The density ratio corrected for relative specificity of the antibody toward CSOA and CSOB was 0.17 in the wild-type and 5.2 in the transformant, showing a 30-fold enrichment of CSOB relative to CSOA in the A22 transformant. Absolute concentrations of CSOB in the wild-type and CSOA and CSOB in the A22 transformant were calculated as products of the respective ratios by the absolute amount of CSOA in the wild-type calibrated with the C-terminal polypeptide (Fig. 4).
FIGURE 4.
The absolute amounts of CSOA and CSOB in the wild-type and CSRA-RNAi transformant A22. Error bars represent mean ± SE of three to six independent measurements.
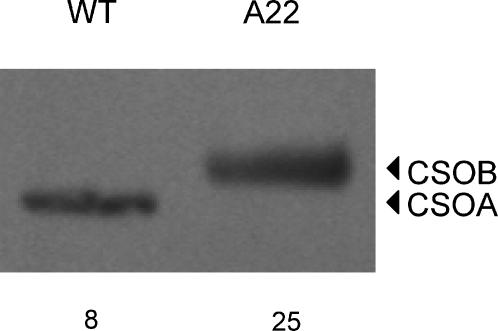
In cell lysates made from gametes of the A22 transformant instead of from vegetative cells, only the CSOB band was detected with the anti-CSOA antibody (Fig. 5). Evidently the CSOB/CSOA ratio in this strain further increases during gametogenesis. Therefore, measurements of the photophobic response were carried out in gametes.
FIGURE 5.
Immunodetection of CSOA and CSOB in gametes of the wild-type and CSRA-RNAi transformant A22 with the anti-CSOA antibody. The amount of total protein loaded per lane in micrograms is indicated below the image.
Photophobic responses
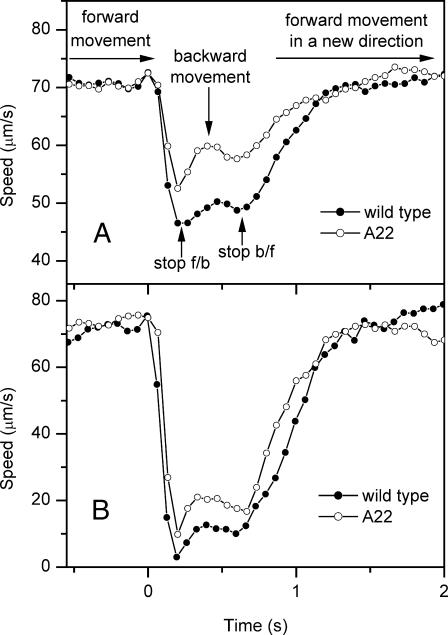
The time course of changes in average velocity of a cell population during photophobic responses in the wild-type cells shows two minima of the flash-induced swimming speed decrease. Analysis of video recordings of individual responding cells showed that the first minimum corresponds to a cessation of forward movement. A slight transient increase in speed during the next ∼300 ms corresponds to a slow backward movement of the cells. The second decrease in speed corresponds to a transition from the backward to forward movement in a new direction (Fig. 6). The CSRA-RNAi transformant A22 undergoes photophobic responses, kinetically similar to those of the wild-type. The transformants are, however, less sensitive. Under equal intermediate stimuli the amplitude of the speed decrease in the transformants is smaller than in the wild-type (Fig. 6 A). Upon increasing stimulus intensity, the photophobic response approaches 100% in both the wild-type and the transformant (Fig. 6 B). The kinetics of the saturated photophobic responses are almost identical in the transformant and the wild-type.
FIGURE 6.
Kinetics of changes in average velocity of cell movement during photophobic responses in the wild-type (solid symbols) and CSRA-RNAi transformant A22 (open symbols). Excitation with a nonsaturating flash (A) and at the maximal available fluence of the flash (B) at zero time.
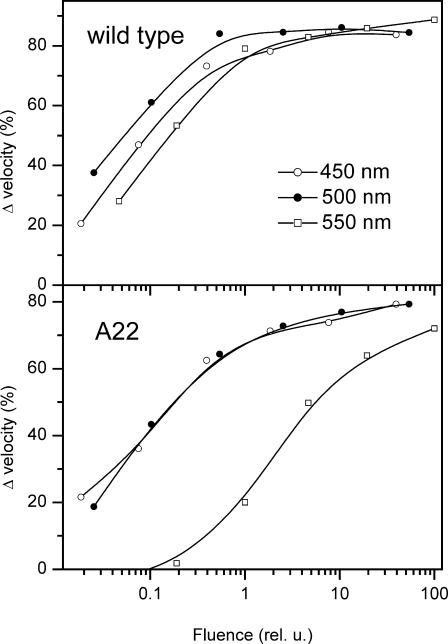
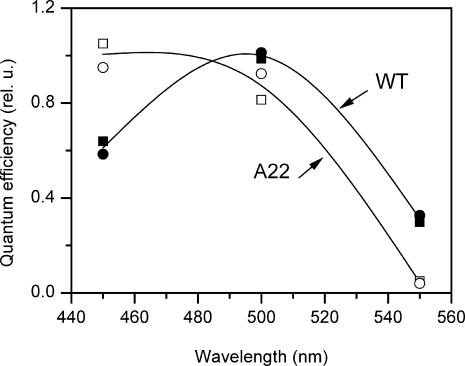
To distinguish whether the photophobic response in the CSRA-RNAi transformant A22 is mediated by CSRB or alternatively by the residual amount of CSRA, we measured the spectral sensitivity of the photophobic responses in the wild-type and the A22. Fluence-response curves were measured for three broad spectral bands: 450 ± 20 nm, 500 ± 20 nm, and 550 ± 20 nm (Fig. 7). The relative spectral sensitivity was calculated as the reciprocal of the number of quanta that produces a criterion (50%) photophobic response. The results of two independent experiments are presented in Fig. 8.
FIGURE 7.
Fluence-response curves for photophobic responses to stimulation with three broad spectral bands in the wild-type (top panel) and CSRA-RNAi transformant A22 (bottom panel).
FIGURE 8.
Spectral sensitivity of the photophobic response in the wild-type (solid symbols) and CSRA-RNAi transformant A22 (open symbols). Results of two independent experiments for each strain are indicated by the symbol type. Data were normalized to the mean sensitivity at the most efficient spectral band.
In the wild-type cells that are enriched in CSRA compared to the A22 strain (Fig. 4), the 500-nm band is most effective, whereas in the transformant with greatly reduced CSRA 450 nm light is equally or even more efficient. The sensitivity of 550 nm light relative to that at 450 nm drops in the transformant more than an order of magnitude. These data show that the photophobic response is mediated by both CSRA and CSRB.
DISCUSSION
All previously reported estimates of the concentration of photoreceptor molecules in C. reinhardtii cells were not only indirect, but did not take into account the presence of two distinct receptor species in this organism. In this study the CSRA and CSRB apoproteins were directly assessed by immunoblot detection. According to our data, vegetative cells of C. reinhardtii wild-type strain 495 contain ∼9 × 10⁴ molecules per cell of CSRA apoprotein and ∼1.5 × 10⁴ of CSRB apoprotein.
The total amount of CSRA and CSRB estimated by this study is more than three times higher than that derived from retinal extraction (Beckmann and Hegemann, 1991; Hegemann et al., 1991). This might reflect the fact that C. reinhardtii strain 495 used in our experiments was initially isolated for its higher phototaxis sensitivity, so that it might have an increased concentration of phototaxis receptors. On the other hand, the immunoblot technique does not distinguish the retinal-bound photoreceptor protein from the apoprotein, and this might also account for a higher value of the total receptor concentration as compared to previously reported results. An upper limit for the receptor concentration can be calculated based on the assumption that the proteins are imbedded in the membrane patch underlying the eyespot with a diameter of 1.5 μm (Foster and Smyth, 1980). The maximum number of rhodopsin proteins in the patch can be calculated from the density of bacteriorhodopsin molecules in the purple membrane of Halobacterium salinarium where the proteins form a tightly packed two-dimensional crystal lattice (Henderson and Unwin, 1975), which for a 1.5 μm patch would contain 1.5 × 10⁵ rhodopsin molecules (Foster and Smyth, 1980). Our estimate of total CSRA and CSRB content is close to this upper limit.
The isolation of a new independent CSRA-RNAi transformant with a phenotype identical to that of the earlier reported one (Sineshchekov et al., 2002) confirms that the observed decrease in CSOA concentration is indeed due to suppression of its biosynthesis by the RNAi construct. Only a small fraction of clones that express the selection marker showed a reduced content of CSOA, similar to results obtained upon transformation of Chlamydomonas in other studies (Fischer and Rochaix, 2001; Huang and Beck, 2003). Possible reasons could be a partial digestion of the transforming DNA by cellular nucleases and/or a low efficiency of the RNAi construct at most sites of integration in the genome. A partial recovery of CSRA suppression in RNAi transformants with time indicates the importance of using freshly isolated transformants for experiments. A clear correlation between the ratio of amplitudes of photocurrents elicited by long- and short-wavelength flashes and CSOA concentration in the candidate strains proves the validity of the electrophysiological test for transformant selection.
Using improved resolution of electrophoretic bands and application of two antibodies with preferential affinity to CSOA or CSOB we have shown that suppression of CSOA in the CSRA-RNAi transformant is accompanied by an overexpression of CSOB. Assuming that both CSRA and CSRB are localized to the eyespot region, one possibility is that the two receptor species compete for membrane sites available in this specialized portion of the membrane.
According to previously suggested schemes photophobic responses in green flagellate alga result from a threshold current through voltage-gated calcium channels (Litvin et al., 1978; Sineshchekov, 1991; Harz and Hegemann, 1991; Beck and Uhl, 1994). Since CSRA- and CSRB-mediated currents both lead to membrane depolarization we suggested that photophobic responses (like phototaxis) could be initiated by either one of the receptors (Sineshchekov et al., 2002). Here we directly proved this by quantitative comparison of the photophobic response in cells enriched in each of the pigments, using a motion analysis/tracking system and video-recording of cell behavior.
The sensitivity of the A22 transformant is decreased compared to the wild-type; however, under sufficiently strong stimulation ∼100% of the transformant cells exhibit a photophobic response (Fig. 6). The shift of the spectral sensitivity (Fig. 8), which persists up to nearly complete response levels (Fig. 7), shows that the photophobic response in the transformant is mediated primarily by CSRB. Therefore, in the CSRB-enriched transformant the photophobic response to the stimulus intensities used and under the conditions of our experiment (1 min dark adaptation before the flash stimulus) is not limited by the saturation of CSRB-mediated signal transduction. The similarity of the kinetics of the photophobic responses by the wild-type and the A22 transformant, which differ 30-fold in their CSRA/CSRB ratios, rules out the possibility that CSRA and CSRB control different components of the photophobic response.
In the transformant, 450 nm light, which is near the absorption maximum of CSRB, is nearly equally efficient in triggering the photophobic response to 500 nm light, which is close to the absorption maximum of CSRA (Fig. 8). Electrophysiological characterization of the CSRA-RNAi transformant revealed nearly equal depolarizing currents from CSRA and CSRB (Sineshchekov et al., 2002). Our interpretation is that the receptors contribute to the photophobic response in proportion to their contribution to membrane depolarization.
In the wild-type 500 nm light is twice as effective as 450 nm light for eliciting photophobic responses (Fig. 8). The 500:450 nm efficiency ratio, however, only qualitatively reflects the relative contributions of CSRA and CSRB to the photophobic response, because the absorption bands of CSRA and CSRB overlap greatly in this spectral region. The relative sensitivity of the response to 550 nm light (absorbed mostly by CSRA), as compared to 450 nm light (absorbed by both pigments), is more than an order of magnitude higher in the wild-type than in the transformant, which roughly corresponds to the change in the CSOA/CSOB ratio detected by immunoblot (Fig. 4). Therefore, at wild-type concentrations CSRA is the dominant photoreceptor for the photophobic response.
The more than fivefold higher cellular content of CSRA relative to CSRB in wild-type cells makes it the dominant receptor for photophobic behavior under the conditions of our experiment (dark adaptation between flashes). Under natural conditions, i.e., under background illumination, the photophobic response is desensitized (Hegemann and Marwan, 1988; Zacks and Spudich, 1994), which means that the threshold for the photophobic response shifts to higher light intensities, where membrane depolarization is mostly driven by CSRA. Therefore, under natural conditions CSRA would even more strongly dominate over CSRB in mediating photophobic responses.
The absorption of CSRA is red-shifted not only relative to the absorption of CSRB, but also relative to the combined absorption of the eyespot and the blue band of the chloroplast, the major screening objects in the cell (Crescitelli et al., 1992; Schaller and Uhl, 1997). This increases the sensitivity of the photophobic response and helps the cell to avoid harmful irradiation. Thus, the dual-receptor photoreception in Chlamydomonas shows that functionally significant color sensing occurs in unicellular flagellates.
Acknowledgments
This work was supported by National Science Foundation grant 0091287 and the Robert A. Welch Foundation.
Elena G. Govorunova and Oleg C. Sineshchekov are on leave from Moscow State University, Moscow, Russia.
Abbreviations used: CSRA and CSRB, Chlamydomonas sensory rhodopsins A and B, respectively; CSOA and CSOB, CSRA and CSRB apoproteins, respectively; RNAi, RNA interference.
References
- Beck, C., and R. Uhl. 1994. On the localization of voltage-sensitive calcium channels in the flagella of Chlamydomonas reinhardtii. J. Cell Biol. 125:1119–1125. [DOI] [PMC free article] [PubMed] [Google Scholar]
- Beckmann, M., and P. Hegemann. 1991. In vitro identification of rhodopsin in the green alga Chlamydomonas. Biochemistry. 30:3692–3697. [DOI] [PubMed] [Google Scholar]
- Crescitelli, F., T. W. James, J. M. Erickson, E. R. Loew, and W. N. McFarland. 1992. The eyespot of Chlamydomonas reinhardtii: a microspectrophotometric study. Vision Res. 32:1593–1600. [DOI] [PubMed] [Google Scholar]
- Ebrey, T. G. 2002. A new type of photoreceptor in algae. Proc. Natl. Acad. Sci. USA. 99:8463–8464. [DOI] [PMC free article] [PubMed] [Google Scholar]
- Fischer, N., and J.-D. Rochaix. 2001. The flanking regions of PsaD drive efficient gene expression in the nucleus of the green alga Chlamydomonas reinhardtii. Mol. Genet. Genomics. 265:888–894. [DOI] [PubMed] [Google Scholar]
- Foster, K.-W., J. Saranak, N. Patel, G. Zarrilli, M. Okabe, T. Kline, and K. Nakanishi. 1984. A rhodopsin is the functional photoreceptor for phototaxis in the unicelullar eukaryote Chlamydomonas. Nature. 311:756–759. [DOI] [PubMed] [Google Scholar]
- Foster, K.-W., and R. D. Smyth. 1980. Light antennas in phototactic algae. Microbiol. Rev. 44:572–630. [DOI] [PMC free article] [PubMed] [Google Scholar]
- Harris, E. 1989. The Chlamydomonas Source Book: A Comprehensive Guide to Biology and Laboratory Use. Academic Press, San Diego.
- Harz, H., and P. Hegemann. 1991. Rhodopsin-regulated calcium currents in Chlamydomonas. Nature. 351:489–491. [Google Scholar]
- Hegemann, P. 1997. Vision in microalgae. Planta. 203:265–274. [DOI] [PubMed] [Google Scholar]
- Hegemann, P., W. Gaertner, and R. Uhl. 1991. All-trans retinal constitutes the functional chromophore in Chlamydomonas rhodopsin. Biophys. J. 60:1477–1489. [DOI] [PMC free article] [PubMed] [Google Scholar]
- Hegemann, P., and W. Marwan. 1988. Single photons are sufficient to trigger movement responses in Chlamydomonas reinhardtii. Photochem. Photobiol. 48:99–106. [Google Scholar]
- Henderson, R., and P. N. Unwin. 1975. Three-dimensional model of purple membrane obtained by electron microscopy. Nature. 257:28–32. [DOI] [PubMed] [Google Scholar]
- Holland, E.-M., H. Harz, R. Uhl, and P. Hegemann. 1997. Control of phobic behavioral responses by rhodopsin-induced photocurrents in Chlamydomonas. Biophys. J. 73:1395–1401. [DOI] [PMC free article] [PubMed] [Google Scholar]
- Huang, K., and C. F. Beck. 2003. Phototropin is the blue-light receptor that controls multiple steps in the sexual life cycle of the green alga Chlamydomonas reinhardtii. Proc. Natl. Acad. Sci. USA. 100:6269–6274. [DOI] [PMC free article] [PubMed] [Google Scholar]
- Jung, K.-H., E. N. Spudich, V. D. Trivedi, and J. L. Spudich. 2001. An archaeal photosignal-transducing module mediates phototaxis in Escherichia coli. J. Bacteriol. 183:6365–6371. [DOI] [PMC free article] [PubMed] [Google Scholar]
- Jung, K.-H., and J. L. Spudich. 2004. Microbial rhodopsins: transport and sensory proteins throughout the three domains of life. In CRC Handbook of Organic Photochemistry and Photobiology. W. H. Horspool and F. Lenci, editors. CRC Press, Boca Raton, FL. Chapter 124, 1–12.
- Kreimer, G. 1994. Cell biology of phototaxis in flagellate algae. Int. Rev. Cytol. 148:229–310. [Google Scholar]
- Lawson, M. A., D. N. Zacks, F. Derguini, K. Nakanishi, and J. L. Spudich. 1991. Retinal analog restoration of photophobic responses in a blind Chlamydomonas reinhardtii mutant. Biophys. J. 60:1490–1498. [DOI] [PMC free article] [PubMed] [Google Scholar]
- Litvin, F. F., O. A. Sineshchekov, and V. A. Sineshchekov. 1978. Photoreceptor electric potential in the phototaxis of the alga Haematococcus pluvialis. Nature. 271:476–478. [DOI] [PubMed] [Google Scholar]
- Melkonian, M., and H. Robenek. 1980. Eyespot membranes of Chlamydomonas reinhardtii: a freeze-fracture study. J. Ultrastruct. Res. 72:90–102. [DOI] [PubMed] [Google Scholar]
- Nagel, G., D. Ollig, M. Fuhrmann, S. Kateriya, A. M. Musti, E. Bamberg, and P. Hegemann. 2002. Channelrhodopsin-1: a light-gated proton channel in green algae. Science. 296:2395–2398. [DOI] [PubMed] [Google Scholar]
- Ridge, K. D. 2002. Algal rhodopsins: phototaxis receptors found at last. Curr. Biol. 12:R588–R590. [DOI] [PubMed] [Google Scholar]
- Schaller, K., and R. Uhl. 1997. A microspectrophotometric study of the shielding properties of eyespot and cell body in Chlamydomonas. Biophys. J. 73:1573–1578. [DOI] [PMC free article] [PubMed] [Google Scholar]
- Sineshchekov, O. A. 1991. Electrophysiology of photomovements in flagellated algae. In Biophysics of Photoreceptors and Photomovements in Microorganisms. F. Lenci, F. Ghetti, G. Colombetti, D.-P. Haeder, and P.-S. Song, editors. Plenum Press, New York. 191–202.
- Sineshchekov, O. A., and E. G. Govorunova. 2001. Electrical events in photomovements of green flagellated algae. In Comprehensive Series in Photosciences, Vol. 1. D.-P. Haeder and M. Lebert, editors. Elsevier, Amsterdam, The Netherlands. 245–280.
- Sineshchekov, O. A., E. G. Govorunova, A. Der, L. Keszthelyi, and W. Nultsch. 1992. Photoelectric responses in phototactic flagellated algae measured in cell suspension. J. Photochem. Photobiol. B, Biol. 13:119–134. [Google Scholar]
- Sineshchekov, O. A., E. G. Govorunova, A. Der, L. Keszthelyi, and W. Nultsch. 1994. Photoinduced electric currents in carotenoid-deficient Chlamydomonas mutants reconstituted with retinal and its analogs. Biophys. J. 66:2073–2084. [DOI] [PMC free article] [PubMed] [Google Scholar]
- Sineshchekov, O. A., K.-H. Jung, and J. L. Spudich. 2002. Two rhodopsins mediate phototaxis to low- and high-intensity light in Chlamydomonas reinhardtii. Proc. Natl. Acad. Sci. USA. 99:8689–8694. [DOI] [PMC free article] [PubMed] [Google Scholar]
- Sineshchekov, O. A., F. F. Litvin, and L. Keszthelyi. 1990. Two components of photoreceptor potential of the flagellated green alga Haematococcus pluvialis. Biophys. J. 57:33–39. [DOI] [PMC free article] [PubMed] [Google Scholar]
- Sineshchekov, O. A., V. A. Sineshchekov, and F. F. Litvin. 1978. Photoinduced bioelectrical responses in phototaxis of a unicellular flagellated alga. Dokl. Akad. Nauk SSSR. 239:471–474. [Google Scholar]
- Suzuki, T., K. Yamasaki, S. Fujita, K. Oda, M. Iseki, K. Yoshida, M. Watanabe, H. Daiyasu, H. Toh, and E. Asamizu. 2003. Archaeal-type rhodopsins in Chlamydomonas: model structure and intracellular localization. Biochem. Biophys. Res. Commun. 301:711–717. [DOI] [PubMed] [Google Scholar]
- Takahashi, T., K. Yoshihara, M. Watanabe, M. Kubota, R. Johnson, F. Derguini, and K. Nakanishi. 1991. Photoisomerization of retinal at 13-ene is important for phototaxis of Chlamydomonas reinhardtii: simultaneous measurements of phototactic and photophobic responses. Biochem. Biophys. Res. Commun. 178:1273–1279. [DOI] [PubMed] [Google Scholar]
- Vohradsky, J., and J. Panek. 1993. Quantitative analysis of gel electrophoregrams by image analysis and least squares modeling. Electrophoresis. 14:601–612. [DOI] [PubMed] [Google Scholar]
- Witman, G. B. 1993. Chlamydomonas phototaxis. Trends Cell Biol. 3:403–408. [DOI] [PubMed] [Google Scholar]
- Zacks, D. N., and J. L. Spudich. 1994. Gain setting in Chlamydomonas reinhardtii: mechanism of phototaxis and the role of the photophobic response. Cell Motil. Cytoskeleton. 29:225–230. [DOI] [PubMed] [Google Scholar]


