Abstract
A Monte Carlo analysis has been made of the phenomenon of facilitation, whereby a conditioning impulse leaves nerve terminals in a state of heightened release of quanta by a subsequent test impulse, this state persisting for periods of hundreds of milliseconds. It is shown that a quantitative account of facilitation at the amphibian neuromuscular junction can be given if the exocytosis is triggered by the combined action of a low-affinity calcium-binding molecule at the site of exocytosis and a high-affinity calcium-binding molecule some distance away. The kinetic properties and spatial distribution of these molecules at the amphibian neuromuscular junction are arrived at by considering the appropriate values that the relevant parameters must take to successfully account for the experimentally observed amplitude and time course of decline of F1 and F2 facilitation after a conditioning impulse, as well as the growth of facilitation during short trains of impulses. This model of facilitation correctly predicts the effects on facilitation of exogenous buffers such as BAPTA during short trains of impulses. In addition, it accounts for the relative invariance of the kinetics of quantal release due to test-conditioning sequences of impulses as well as due to change in the extent of calcium influx during an impulse.
INTRODUCTION
The complexity of the processes underlying quantal release at a synapse are such as to require modeling to elucidate significant factors controlling the exocytosis of transmitter from vesicles (Simon and Llinás, 1985; Yamada and Zucker, 1992; Winslow et al., 1994; Cooper et al., 1996; Zucker and Fogelson, 1986). To accomplish this task, a Monte Carlo description has been provided of the spatial distribution of calcium ions within an active zone after they move out of open channels due to an impulse, subsequently bind to both fixed and mobile buffers as well as to the calcium-ATPase pump, and are eventually removed from the synaptic terminal by this pump (Bennett et al., 2000a). This approach was applied to synapses with different active zone structures to determine the probability of quantal secretion after an impulse, as well as test-conditioning pairs of such impulses, at these synapses (Bennett et al., 2000b). Such an analysis has shown, among other things, that some facilitation of release occurs at short intervals of test-conditioning pairs (∼10 ms) if exocytosis is triggered by a calcium-sensor molecule with relatively low affinity. This happens because a conditioning impulse momentarily depletes the fixed and mobile buffers in the center of the array of calcium channels within an active zone, a phenomenon that lasts for ∼15 ms and therefore will contribute to facilitation (Klingauf and Neher, 1997; Neher, 1998). However, experimentally facilitation lasts for several hundreds of milliseconds and its decay can be described by a double exponential function with a fast time constant (termed the F1 time constant) with a value of ∼30 ms at the amphibian neuromuscular junction and a slow time constant (termed the F2 time constant) with a value of ∼300 ms (Mallart and Martin, 1967; Magleby, 1973; Bennett and Fisher, 1977; Zengel and Magleby, 1980). Thus a single low-affinity calcium sensor molecule cannot account for the relatively long time course of facilitation. This has necessitated the introduction of schemes in which two calcium sensor molecules, one with low and the other with high affinity, must work synergistically to trigger secretion (Llinás et al., 1992; Lando and Zucker, 1994; Kamiya and Zucker, 1994; Bain and Quastel, 1992; Blundon et al., 1993; Atluri and Regehr, 1996).
The concept of a secretory unit has arisen from the discovery that there is tight coupling between the voltage-dependent calcium channel that gates the entry of calcium for triggering exocytosis (whether N-type or PQ-type) and a complex consisting of the vesicle-associated proteins synaptotagmin, synaptobrevin, as well as syntaxin (O'Connor et al., 1993; Yoshida et al., 1992; el Far et al., 1995; Martin-Moutot et al., 1996). This secretory unit is probably associated with the “calcium microdomain,” namely the region of high calcium concentration (of the order of 100 μM) that is thought to trigger exocytosis (Simon and Llinás, 1985; Zucker and Fogelson, 1986). The properties of this unit have been explored in a recent Monte Carlo analysis of secretion (Bennett et al., 2000a). However, there is evidence that at some synapses there is a slower accumulation of calcium contributed by many channels in the vicinity of the calcium sensors within the unit. In this case, the contribution of calcium from many channels at the presynaptic membrane forms a “submembraneous calcium domain” that extends over the region of calcium entry into the terminal (Klingauf and Neher, 1997), the consequences of which have also been explored in a Monte Carlo analysis (Bennett et al., 2000b). It is therefore necessary in any study of the origins of facilitation to use a model that is flexible enough to incorporate both “calcium microdomains” as well as “submembraneous microdomains.”
Tang et al. (2000) have studied the properties of a molecular facilitation scheme in which one calcium-sensor molecule has a stoichiometry of 3, a relatively low affinity for calcium ions and is located 20 nm from the calcium channel in the secretory unit. Another calcium-sensor molecule has a stoichiometry of 1, a much higher affinity for calcium ions than the other molecule and is located 100 nm from the vesicle. Secretion of the contents of a vesicle then depends on interaction between these two molecules once they have bound calcium. We have extended our Monte Carlo model of secretion at synapses possessing arrays of secretory units and calcium channels in the active zone (Bennett et al., 2000a,b), to incorporate a molecular facilitatory scheme similar to that used by Tang et al. (2000). This work determines the extent to which this model can account for observations of facilitation made at the amphibian neuromuscular junction.
METHODS
The diffusion and binding of the calcium in the terminal is treated using both a deterministic approach, based on solving the relevant differential equations (Matveev et al., 2002) and also simulated numerically using a Monte Carlo (MC) scheme. This latter scheme is basically the same as that used previously in a study of quantal secretion (Bennett et al., 2000a,b) and full details of the method can be found there. Here, we briefly summarize the main aspects, and point out the changes that have been made to incorporate a high-affinity calcium binding site.
Geometry
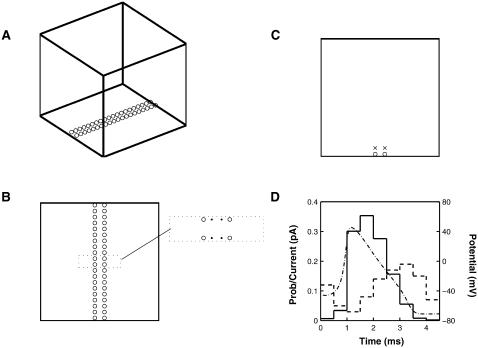
The nerve terminal is modeled as a cube of side 1 μm (Fig. 1 A); vesicles and calcium channels are arranged in a double line on one face of the cube, this being the most likely arrangement for the amphibian motor nerve terminal (Heuser and Reese, 1973; Robitaille et al., 1990), with a channel-vesicle distance of 25 nm (Fig. 1 B). The low-affinity calcium binding site is taken to be at the position of the vesicle and the high-affinity site associated with it is placed 100 nm directly above it (Fig. 1 C).
FIGURE 1.
Geometry for the Monte Carlo simulation. (A) The simulation takes place in a cubic box with a side length of 1 μm. The presynaptic membrane is represented by the base where vesicles, represented by circles, are placed in an array consisting of two parallel lines in the central area; the low-affinity calcium sensor molecule is taken to be at the position of the vesicle. Calcium pumps are placed on all six walls. (B) Shows the placement of vesicles (○) and calcium channels (•) on the presynaptic membrane. The 80 vesicles are in two lines 80 nm apart; the 80 calcium channels are also in two parallel lines 30 nm apart, thus giving a minimum channel-vesicle separation of 25 nm (see dotted box). (C) A cross section of the terminal perpendicular to the presynaptic membrane, showing the placement of a high-affinity calcium sensor molecule (×) at a distance of 100 nm directly above each vesicle (○). (D) Shows the single-channel current and mean open times for a Ca2+ channel. The time course of the Hodgkin-Huxley impulse for a temperature of 6.3°C (dot-dashed line; right scale in mV) is subdivided into nine intervals each of length 0.5 ms. In each subinterval the dashed line gives the single-channel current (left scale in pA) and the solid line gives the probability that a given channel is open (left scale). The single-channel current is based on Delcour et al. (1993) and has been adjusted to allow for the fact that a channel may not be open for all of a subinterval. (See Table 1 in Bennett et al. (2000b) and the discussion surrounding it.)
Entry and diffusion of calcium
Under an impulse, many calcium channels can open. If the impulse takes the form of an action potential then, as well as the channel open times being random, the single channel calcium current, i(V), depends on the membrane potential V, which is also time dependent. An approximate scheme has been devised for including both these effects in the MC simulation: the duration of a single action potential (∼4 ms) is divided into subintervals of length 0.5 ms and in each subinterval a certain number of channels, chosen at random, open and admit the appropriate single-channel current (Fig. 1 D; full details are given in Bennett et al., 2000b).
Once the calcium is in the synaptic terminal, its motion is followed by a Monte Carlo simulation method in which the motion of each calcium ion is tracked. In the time interval Δt each ion moves from point (x, y, z) to point (x + Δx, y + Δy, z + Δz) where the increments Δx, Δy, Δz are chosen from a Gaussian distribution in such a way as to simulate diffusion. Both a fixed and a mobile buffer are included in the simulation. Calcium pumps are placed in all six walls of the terminal (Fig. 1 A); details of how buffers and pumps are included in the Monte Carlo scheme are given in Bennett et al. (2000a).
Exocytosis and facilitation
Calcium ions bind to the vesicle-associated proteins at the exocytotic sites according to the scheme (Heinemann et al., 1994)
 |
(1) |
where Si, i=1, … , 4, denotes the state with i sites occupied, Sex denotes the state with four sites occupied after the conformational change, μi(t) (νi) are the rates of attachment (detachment) of a calcium ion at the ith step, and β is the rate for the final step. These attachment rates μi are taken to be proportional to the excess calcium concentration at the position of the vesicle-associated protein and the detachment rates νi are taken to be constants, independent of time:
 |
(2) |
 |
(3) |
This scheme will be called the “exocytosis molecular scheme.”
A modification of this scheme has been proposed by Zucker and collaborators (Tang et al., 2000; Matveev et al., 2002) in which, in addition to the low-affinity site described above, there is also a high-affinity calcium-binding site situated some distance from the presynaptic membrane. Labeling these sites X and Y, respectively, the scheme is described by the equations (Tang et al., 2000)
 |
(4) |
 |
(5) |
 |
(6) |
The first of these equations describes the sequential binding of three calcium ions to the low-affinity site, the second the binding of a single calcium ion to the high-affinity site, and the last shows that release only occurs when both sites are fully bound. We refer to this scheme as the “facilitation molecular scheme.” These equations lead to differential equations governing the concentrations of the various molecules, to which must be added the differential equations governing diffusion, pumping, and buffering. A program for solving this system is available on the web (http://mrb.niddk.nih.gov/matveev) and we have used this, incorporating our geometry and parameter values, to obtain solutions that will be referred to as “deterministic solutions.”
We have also implemented an MC version of this facilitation molecular scheme, in which the low-affinity X-site and its corresponding Y-site must each be fully bound with calcium ions before a configurational step, governed by parameter β as in Eq. 1, leads to exocytosis. Binding of calcium to both low- and high-affinity sites is incorporated into the MC scheme by representing each site as a disk of radius rV placed at the appropriate location. A calcium ion hitting the disk binds with probability
 |
(7) |
where k+ is the appropriate forward binding rate,  and Dc is the diffusion coefficient for calcium. Unbinding in each time step Δt occurs with probability
 |
(8) |
where k− is the appropriate unbinding rate.
There is accord that the stoichiometry of the facilitation process for calcium ions is somewhat less than that for exocytosis. This is the case for nerve terminals as disparate as the giant terminal in the stellate ganglion of the squid (Stanley, 1986), synapses between CA3 and CA1 pyramidal neurones in the hippocampus (Wu and Saggau, 1994), synapses on the R15 neuron in Aplysia (Carlson and Jacklet, 1986) and of the crayfish excitor and inhibitor terminals (Wright et al., 1996; Vyshedskiy and Lin, 1997). This stoichiometry is ∼1.0, so in our analysis the high calcium-affinity molecule was given a stoichiometry of 1 and this quantitatively predicted the relation between measured calcium influx and facilitation for the amphibian neuromuscular junction.
As we are considering the mechanism of facilitation, the depletion of vesicles that would give rise to depression has been obviated by introducing an instantaneous replacement of vesicles. Facilitation in this work is simply defined as Pn/P1 where Pn is the quantal release due to the nth impulse (n > 1) and P1 is the quantal release by the first impulse.
A general discussion of the advantages and disadvantages of using an MC approach to modeling synaptic transmission, as compared to a differential-equation-based deterministic approach, is given in Bartol et al. (1991). In this context, the main advantage of the MC method is that it allows incorporation of the stochastic nature of the various processes, from the opening of the voltage-gated calcium channels under an action potential to the binding of calcium ions to buffer molecules and exocytosis molecules. In this sense, it is closer to the physiology than differential equation methods, giving insights into the magnitude of the fluctuations that occur and in particular allowing computation of delay histograms for quantal release. However, the MC method is not so convenient for calculating decay times of facilitation, because at relatively long times the number of excess calcium ions is small and the stochastic fluctuations in the MC runs make it difficult to calculate meaningful time constants, so the deterministic method has been used to supplement the MC method in these cases. Due to some intrinsic differences in modeling details, the deterministic results are not in exact agreement with the MC averages. These differences concern the implementation of the calcium plasmalemma pump, given as a boundary condition on the diffusion differential equation in the Matveev et al. (2002) case but modeled as a kinetic process, essentially equivalent to Michaelis-Menten kinetics, in the MC case (Bennett et al., 2000a). The other principal difference concerns the exocytotic process: in the deterministic method the quantity calculated is R (see Eq. 6), which is proportional to the excitatory junction potential amplitude; in the MC method the actual number of exocytotic events is computed.
Parameter choice
The basic parameter values used in the calculations are listed in Table 1; if other values are used this is explicitly stated. The single-channel calcium current is taken from Delcour et al. (1993) (see also Bennett et al., 1997, for fits to the data). However, because the measurements there were made using Ba2+ as the charge carrier the current found is almost certainly larger than that for Ca2+ so in the present calculations the values found by Delcour et al. (1993) have been reduced by a factor of 2.
TABLE 1.
Values of the parameters used in the numerical calculations
| Quantity | Symbol | Value | Cell type | Notes |
|---|---|---|---|---|
| Calcium | ||||
| Diffusion coefficient | DCa | 220 μm2 s−1 | Neuroendocrine | Klingauf and Neher (1997) |
| Background concentration | c0 | 0.1 μM | – | – |
| Fixed buffer | ||||
| Total concentration | [Bf]T | 5000 μM | – | See text |
| Dissociation constant | Kf | 10 μM | Neuroendocrine | Klingauf and Neher (1997) |
| Forward binding rate |  |
5 × 10⁸ M−1 s−1 | Neuroendocrine | Klingauf and Neher (1997) |
| Mobile buffer | ||||
| Total concentration | [Bm]T | 100 μM | Neuroendocrine | Klingauf and Neher (1997) |
| Dissociation constant | Km | 10 μM | Neuroendocrine | Klingauf and Neher (1997) |
| Forward binding rate |  |
5 × 10⁸ M−1 s−1 | Neuroendocrine | Klingauf and Neher (1997) |
| Diffusion coefficient |  |
15 μm2 s−1 | Neuroendocrine | Klingauf and Neher (1997) |
| BAPTA | ||||
| Dissociation constant | KB | 0.167 μM | – | Smith et al. (1996) |
| Forward binding rate |  |
6 × 10⁸ M−1 s−1 | – | Smith et al. (1996) |
| Diffusion coefficient | DB | 95 μm2 s−1 | – | Smith et al. (1996) |
| Calcium pumps | ||||
| Pump density | σP | 2000 μm−2 | Hair cell stereocilia | Yamoah et al. (1998) |
| Maximum pumping rate | VP | 3.2 × 10⁻¹¹ mol cm−2 s−1 | – | Bennett et al. (2000a) |
| Dissociation constant | KP | 0.2 μM | Smooth muscle | Kargacin and Fay (1991) |
| Exocytosis molecular scheme | ||||
| Attachment rate | ka | 15 × 106 M−1 s−1 | Chromaffin, bipolar | Bennett et al. (1997) |
| Detachment rate | kd | 750 s−1 | Range of cell types | Bennett et al. (1997) |
| Conformational change rate | β | 2000 s−1 | Range of cell types | Bennett et al. (1997) |
| Facilitation molecular scheme | ||||
| Low-affinity attachment rate | kon | 15 × 106 M−1 s−1 | Chromaffin, bipolar | Bennett et al. (1997) |
| Low-affinity detachment rate | koff | 750 s−1 | Range of cell types | Bennett et al. (1997) |
| Release rate | k2 | 1 × 10³ M−1 s−1 | – | Tang et al. (2000) |
| Inactivation rate | k3 | 1 × 10⁴ s−1 | – | Tang et al. (2000) |
| High-affinity attachment rate | qon | 1.85 × 10⁸ M−1 s−1 | – | Tang et al. (2000) |
| High-affinity detachment rate | qoff | 555 s−1 | – | Tang et al. (2000) |
| Monte Carlo | ||||
| Time step | Δt | 0.25 μs | – | – |
| Vesicle disk radius | rV | 10 nm | – | – |
The choice of parameters governing the pumping rate is discussed in Bennett et al. (2000a). This leads to the cytoplasmic Ca2+ being all removed in a time of <1 s. For other motor-nerve terminals, such as that of the lizard (David et al., 1998), removal is slower and there is still residual Ca2+ after 1 s.
RESULTS
Exocytosis molecular scheme
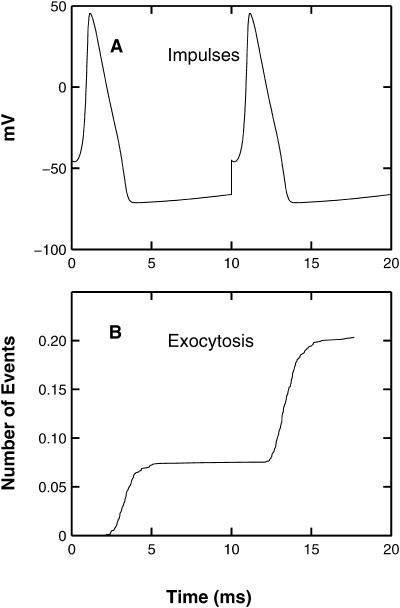
As mentioned in the Introduction, the opening of multiple calcium channels in the presynaptic membrane gives rise to a submembranous calcium domain in which there is nonindependence of exocytosis from the secretory units. This occurs because there is a superposition of effects arising from the summed contributions of calcium from several open channels within secretory units (Bennett et al., 2000b). In this section, an analysis of exocytosis in such submembranous domains, due to pairs of test and conditioning impulses, is carried out to explore if the exocytosis molecular scheme given in the Methods section can account for the enhanced exocytosis. The conditioning impulse is a Hodgkin-Huxley action potential for a temperature of 6.3°C and this is followed 10 ms later by an identical test impulse (Fig. 2 A). The consequences of this for the exocytosis of quanta are shown in Fig. 2 B: there is a facilitation involving an increase from 0.08 for the cumulative exocytosis due to the first pulse, to 0.20 − 0.08 = 0.12 for the cumulative exocytosis due to the second pulse, this being an increase of 50%.
FIGURE 2.
The exocytosis due to a conditioning impulse followed by a test impulse 10 ms later, according to the MC model exocytosis molecular scheme. (A) The impulses (Hodgkin-Huxley action potentials) with the conditioning impulse occurring at t = 0 and the test impulse at t = 10 ms; the ordinate shows potential in mV. (B) The extent and timing of exocytosis that occurs as a result of these two impulses, with the ordinate now showing the cumulative number of exocytotic events; results are the average of 1500 simulations.
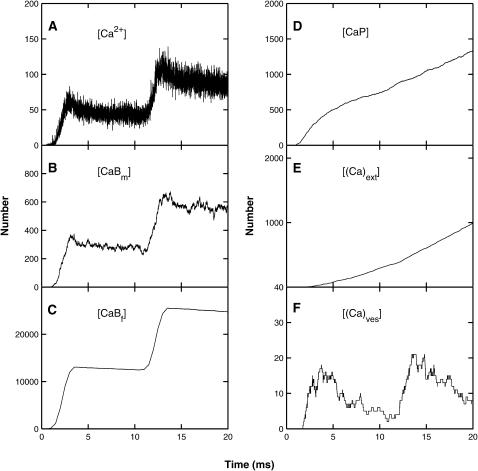
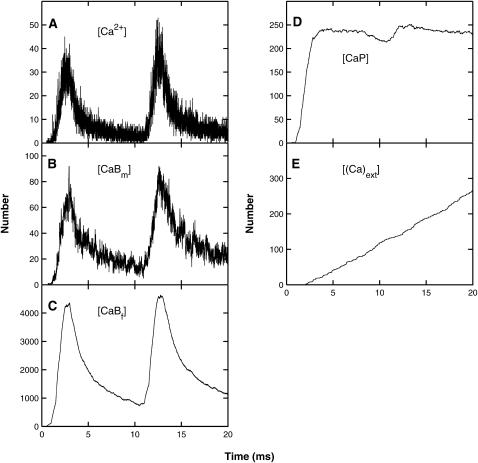
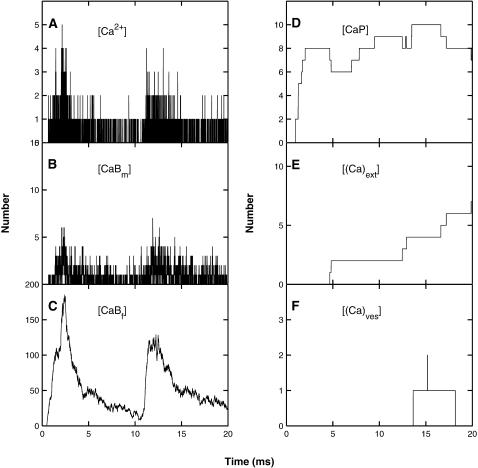
These results were obtained using the MC simulation method using the parameter values given in Table 1; details are shown for the whole terminal (Fig. 3), the submembraneous region surrounding the active zone, this being a box of dimensions 1-μm long, 120-nm wide, and 30-nm high sitting on the presynaptic membrane and surrounding the active zone (Fig. 4) and for a box of dimensions 60 nm × 60 nm × 30 nm high surrounding a single vesicle, with the lower face on the presynaptic membrane (Fig. 5). After an impulse, there is both residual free calcium in the terminal and in the submembranous region around the active zone. This is removed from the terminal by calcium pumps and from the submembraneous region primarily by the endogenous buffers (Figs. 3, A–E, and 4, A–E). There can be an increase in the free calcium ions in the terminal and in the submembranous region of the active zone after a subsequent impulse (10 ms later), compared with that for the conditioning impulse, if the former occurs during the transient occupation of the endogenous buffers by calcium (Figs. 3 A and 4 A). The resulting facilitation is mainly due to the increase in free calcium in the submembraneous region (Fig. 4 A) and this in turn is primarily due to the partial saturation of both the mobile (Fig. 4 B) and fixed (Fig. 4 C) buffers at the time of the test impulse. There is also some contribution to facilitation from the residual free calcium remaining after the conditioning pulse (Fig. 4 A), which manifests itself in residual binding of calcium to the exocytotic molecule (Fig. 3 F).
FIGURE 3.
The distribution of calcium in the whole terminal, as a function of time, due to a conditioning impulse followed by a test impulse 10 ms later (Fig. 2 A), according to the MC model exocytosis molecular scheme; each graph is the result of a single simulation. (A) The number of free calcium ions. (B) The number of calcium ions bound to the mobile buffer. (C) The number of calcium ions bound to the fixed buffer. (D) The number of calcium ions bound to the pumps in the terminal walls. (E) The number of calcium ions pumped out through the terminal walls. (F) The number of calcium ions bound to the low-affinity molecules for vesicles that have not yet undergone exocytosis.
FIGURE 4.
As for Fig. 3, except that the volume considered is now the submembraneous region surrounding the active zone; that is, a box of dimensions 1-μm long, 120-nm wide, and 30-nm high sitting on the presynaptic membrane and surrounding the active zone. Panels D and E now refer to pumps in the presynaptic membrane only.
FIGURE 5.
As for Fig. 3, except that the volume considered is now a box of dimensions 60 nm × 60 nm × 30 nm high surrounding a single vesicle. (The vesicle chosen is one of the four closest to the center of the presynaptic membrane.) Panels D and E now refer to pumps in the presynaptic membrane only. Panel F shows that one calcium ion is bound to the low-affinity molecule for a period of ∼5 ms during which time a second binds instantaneously.
The calcium profile about a single calcium channel at a site of exocytosis, after a conditioning-test pair of impulses, depends on the site chosen. Fig. 5 gives the results for one site, according to the MC model. After each impulse (Fig. 2 A) both the local fixed and mobile buffers at the site remove calcium ions (Fig. 5, B and C), as do the local pumps (Fig. 5, D and E). However, in the case of this site in this particular trial, there is no clear increase in the extent of calcium ions after the test impulse (Fig. 5 A). Indeed, the vesicle at this site has no calcium ions bound to its exocytotic molecule during the conditioning impulse and only one (and very briefly, two) during the test (Fig. 5 F), so there is no exocytosis.
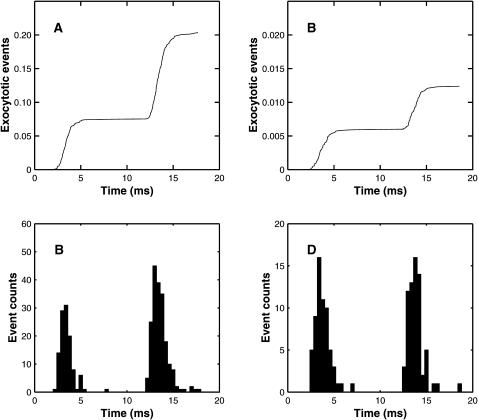
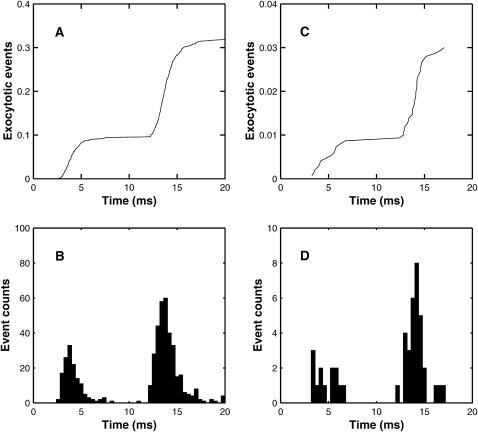
It is known that the kinetics of quantal release after an impulse are not much altered by a prior conditioning impulse (Van der Kloot, 1988). Fig. 6, A and B, show the results of MC simulations using the exocytosis molecular scheme. There is little change in the time course of synaptic delays of quantal exocytosis between conditioning and test pulses, the time to peak being about the same in each case. Using the standard definition of synaptic delay (Katz and Miledi, 1965a) as being the time from the maximum rate of rise of the action potential (taken to be 1 ms in this case) to the onset of quantal release, the mean delay for the first pulse is 2.58 ms and for the second it is 2.78 ms (Fig. 6 B). These distributions are comparable with that for the frog sartorius muscle at 7°C (Fig. 3 in Katz and Miledi, 1965b). Fig. 6 A shows a minimum synaptic delay of ∼1.5 ms, which is shorter than the experimental value of ∼2 ms for the frog sartorius muscle at 7°C (Fig. 4 in Katz and Miledi, 1965b). This difference may be partly accounted for by the way in which the stochastic opening of calcium channels is incorporated into the MC scheme: channels that open in the interval 0.5–1.0 ms after the start of the stimulation are assumed to open at the beginning of this interval, rather than at some point during the interval (see Fig. 1 D).
FIGURE 6.
The extent and timing of exocytosis that occurs as a result of a conditioning impulse followed by a test impulse 10 ms later (see Fig. 2 A), according to the MC model exocytosis molecular scheme. (A) Shows the cumulative release averaged over 1500 runs. (B) Gives the histograms of the corresponding delays in quantal release. For the first pulse there are 112 exocytotic events, with mean delay 2.464 ms and mean ± SD 0.763 ms; for the second pulse the corresponding values are 193 events, 2.585 ms, and 0.896 ms. Panels C and D repeat panels A and B for the case where the calcium influx is reduced by one-half and the number of runs is increased to 10,500. For the first pulse there are 62 events, the mean delay is 2.776 ms and the mean ± SD is 0.803 ms; for the second pulse the corresponding values are 68 events, 2.846 ms, and 0.918 ms. In both cases, a two-tailed t-test indicated no significant difference between the distributions for the first and second pulses.
It is also known that changing the external calcium concentration, and hence the calcium influx due to an impulse, does not change the kinetics of quantal release (Van der Kloot, 1988). Fig. 6, C and D, shows that reducing the calcium influx by 50% did not significantly affect the distribution of synaptic delays, although the number of exocytotic events fell dramatically.
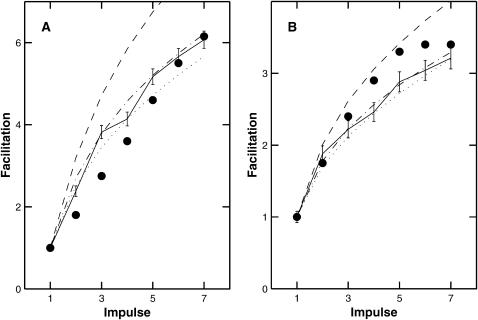
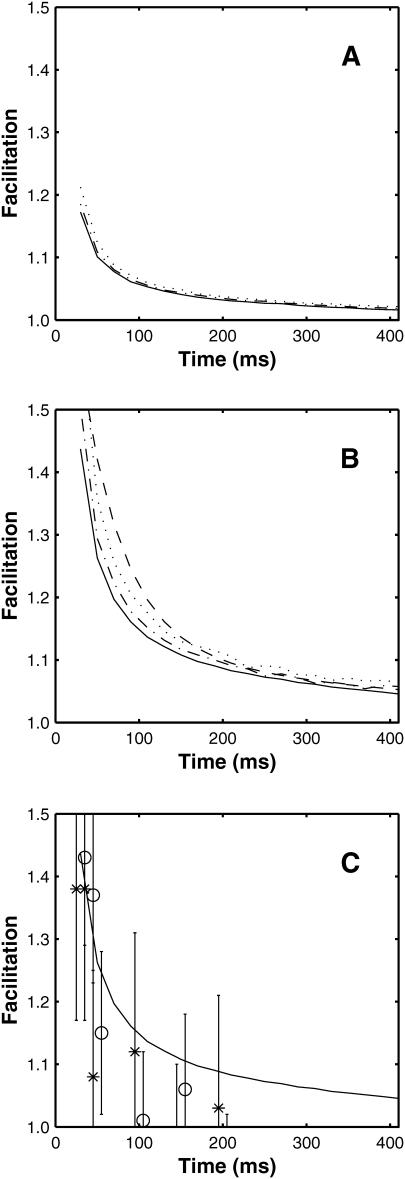
Although the exocytosis molecular scheme correctly describes the kinetics of quantal release it fails to account for either the magnitude of facilitation at the amphibian neuromuscular junction, or for the decay time of F2 facilitation. In this scheme, facilitation is mainly due to buffer saturation and for any reasonable parameter values this cannot give results in agreement with experiment: for a train of seven impulses at 50 Hz total predicted facilitation is <2, whereas experimentally it is >3 (see Fig. 12 B); moreover, the decay is much too fast (see Fig. 13 A).
FIGURE 12.
Comparison between the calculated facilitation Pn/P1 resulting from each impulse in a train and experimental observations. The facilitation molecular scheme was used with parameter values as given in Table 1. The solid lines give the average results of 1500 MC simulations at (A) 100 Hz and (B) 50 Hz. Experimental results are given by the solid circles, from Fig. 7 in Bennett and Fisher (1977). Shown also are the corresponding calculations using the deterministic version of the facilitation molecular scheme. In this case, three different fixed buffer concentrations were used: 5000 μM (dashed line), 4000 μM (dot-dashed line), and 3500 μM (dotted line).
FIGURE 13.
Comparison between the facilitation of quantal release as a function of the time interval between the conditioning and test impulses. In A the deterministic version of the exocytosis molecular scheme is used and the line is calculated as P2/P1 where P1 is the number of releases resulting from the conditioning pulse and P2 is the number of releases resulting from the test pulse. Shown are the results for three fixed buffer concentrations: 3500 μM (solid line), 4000 μM (dot-dashed line), and 5000 μM (dotted line). The fit of a double exponential to the solid line gives time constants of decay of 32 ms and 286 ms. Panel B repeats panel A, but now using the facilitation molecular scheme. Here, the fit of a double exponential to the solid line gives time constants of decay of 35 ms and 330 ms and the dashed line is the function f(t) + 1 where f(t) = 0.8e−t/50 + 0.12e−t/300 + 0.025e−t/3000, this being the curve of best fit to the experimental observation as given by Magleby (1973). Panel C shows again the deterministic result of B, together with points each giving the results of 1500 MC runs, with * being for P2/P1 and ○ for  where
where  is the mean value of P1 over all the runs (the * points have been displaced slightly to allow the standard deviation error bars to be distinguished); for the longer times the stochastic variation in the MC values make results unreliable so the deterministic solution is to be preferred. Parameter values used are given in Table 1.
Facilitation molecular scheme
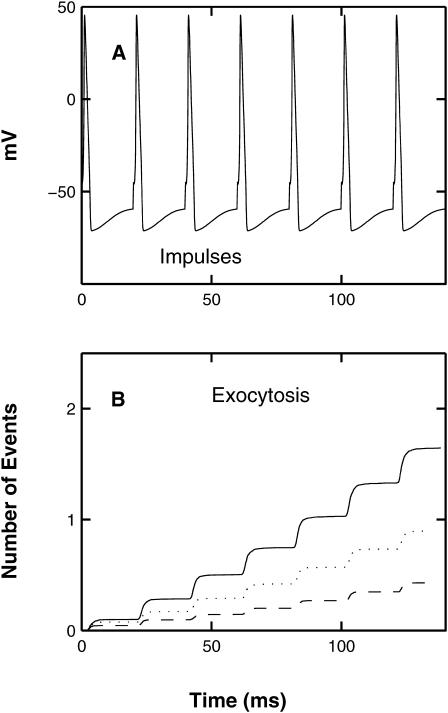
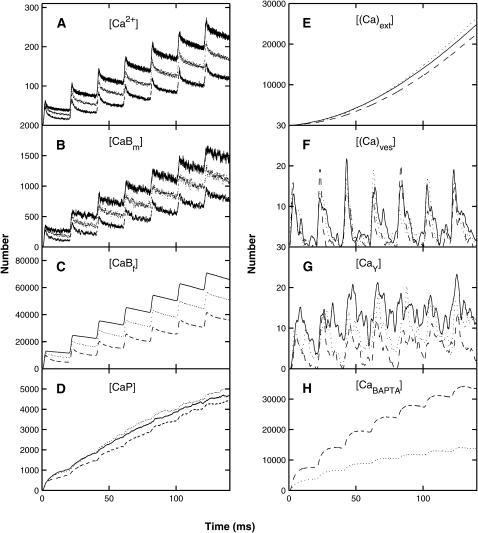
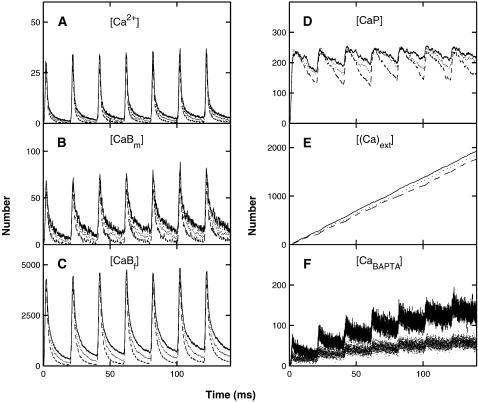
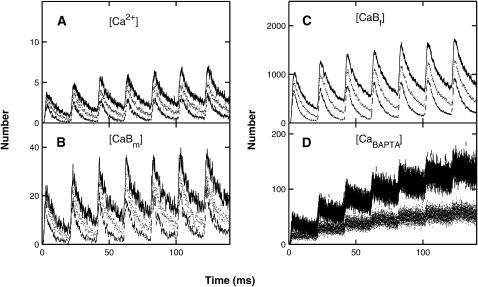
Because the exocytosis molecular scheme cannot account for the observed facilitation at the amphibian neuromuscular junction, we turn to consideration of the facilitation molecular scheme, as described in the “Exocytosis and facilitation” section. This time, a train of seven impulses at 50 Hz is used (Fig. 7 A) and the resulting exocytosis is shown in Fig. 7 B, solid line. (The other curves show the effects of BAPTA and will be discussed below.) Again, the MC simulation method has been used and the effect of the train of impulses on the distribution of calcium ions was determined for the whole terminal (Fig. 8; cf. Fig. 3), in the submembraneous region surrounding the active zone (Fig. 9; cf. Fig. 4) and in a box surrounding the high-affinity calcium binding sites (Fig. 10). The changes in calcium in the terminal, in the submembraneous region surrounding the active zone and in the region immediately surrounding the high-affinity sites are given in Figs. 8 A, 9 A, and 10 A, respectively. At 50 Hz the free calcium accumulates in the whole terminal (Fig. 8 A) and, more significantly, around the high-affinity site (Fig. 10 A). There is an increasing extent to which the mobile and fixed buffers bind calcium in the terminal throughout the train (Fig. 8, B and C), which is reflected in a slight increase in these in the submembraneous region (Fig. 9, B and C) as well as around the high-affinity sites (Fig. 10, B and C). The plasmalemma calcium pump within the terminal is largely saturated toward the end of the train (Fig. 8 D), with discrete fluctuations being evident in the binding of calcium to the pumps in the submembraneous region (Fig. 9 D). Only a relatively small number of calcium ions are buffered by the calcium-sensor proteins (Fig. 8 F). The increased occupancy of the high-affinity site (Fig. 8 G) then gives rise to increased exocytosis by each impulse in the train (Fig. 7 B). As is clear from Fig. 10 A, the underlying cause is the increase in free calcium ions in the vicinity of the high-affinity sites; their binding to these sites increases the probability of exocytosis of the corresponding vesicles. This is to be contrasted with the exocytosis molecular scheme, where there were no high-affinity sites and facilitation arose mainly as a consequence of buffer saturation in the neighborhood of the low-affinity sites.
FIGURE 7.
The exocytosis due to a train of seven impulses at a frequency of 50 Hz in the absence or presence of an endogenous buffer with the properties of BAPTA, according to the MC model and the facilitation molecular scheme. (A) The 50-Hz train of impulses (Hodgkin-Huxley action potentials); the ordinate shows potential in mV. (B) The extent and timing of exocytosis that occurs as a result of this train of impulses, with the ordinate showing the cumulative number of exocytotic events, averaged over 1500 runs. Results are shown for three concentrations of BAPTA: 0 μM (solid line), 65 μM (dotted line), and 196 μM (dashed line).
FIGURE 8.
The distribution of calcium in the whole terminal, as a function of time, during a train of seven impulses at a frequency of 50 Hz (Fig. 7 A) in the absence or presence of an endogenous buffer with the properties of BAPTA, according to the MC model and the facilitation molecular scheme; the ordinate gives the number of ions or molecules involved (cf. Fig. 3). (A) The number of free calcium ions. (B) The number of calcium ions bound to the mobile buffer. (C) The number of calcium ions bound to the fixed buffer. (D) The number of calcium ions bound to the pumps in the terminal walls. (E) The number of calcium ions pumped out through the terminal walls. (F) The number of calcium ions bound to the low-affinity sites for vesicles that have not yet undergone exocytosis. (G) The number of calcium ions bound to molecules in the high-affinity sites. (H) The number of calcium ions bound to BAPTA. Results are shown for three concentrations of BAPTA: 0 μM, 65 μM, and 196 μM; in panels A and B, the upper curve is for 0 μM, the middle curve for 65 μM, and the lower curve for 196 μM; in panels C–H, the solid line is for 0 μM, the dotted line for 65 μM, and the dashed line for 196 μM. For clarity, some of the data have been time averaged.
FIGURE 9.
As for Fig. 8, except that the volume considered is now the submembraneous region surrounding the active zone; that is, a box of dimensions 1-μm long, 120-nm wide, and 30-nm high sitting on the presynaptic membrane and surrounding the active zone. Panels D and E now refer to pumps in the presynaptic membrane only.
FIGURE 10.
As for Fig. 8, except that the volume considered is now a box of dimensions 1-μm long, 120-nm wide, and 30-nm high situated 85 nm above the presynaptic membrane and hence surrounding all the high-affinity sites. Because the box includes pumps only on its ends and does not include the low calcium-affinity site, panels corresponding to D and E in Fig. 8 have been omitted.
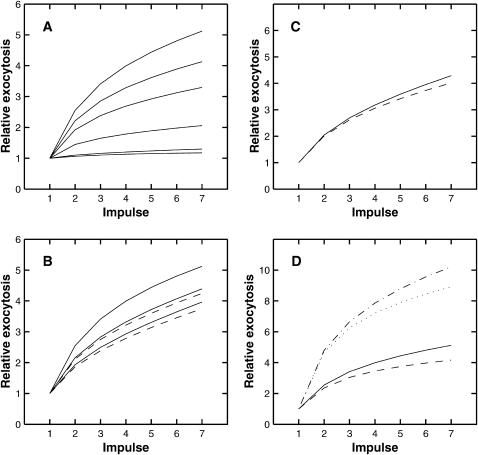
We now investigate the properties of the facilitation molecular scheme to see if it can account for F1 and F2 facilitation. Fig. 11 shows the effects of various parameter values on the exocytosis resulting from a train of seven impulses at 50 Hz. The amplitude of facilitation was greatly increased by increasing the fixed buffer concentration (Fig. 11 A) but increasing the mobile buffer gave the opposite effect (Fig. 11 B). This effect of the fixed buffer may be attributed to the increase in residual calcium at the membrane as a consequence of the fixed buffer bound with calcium acting as a calcium source (see Sala and Hernandez-Cruz, 1990; Nowycky and Pinter, 1993). Changing the pumping rate had little effect (Fig. 11 C), but changing the kinetics of calcium binding to the low-affinity molecular site greatly affected facilitation (Fig. 11 D). This latter observation does not mean that the high-affinity site is not important, because in its absence changing the parameters on the low-affinity site would have little effect on the small amount of facilitation present.
FIGURE 11.
Effect of parameter variation on facilitation. Shown is the facilitation occurring during a train of seven impulses at 50 Hz, normalized to 1 for the first impulse. Calculations are performed using the deterministic version of the facilitation molecular scheme and all parameters, except the one being varied, are given the values in Table 1. (A) Shows the effect of changing the fixed buffer concentration, the values used being (from lowest curve to highest) 310, 1500, 4000, 6000, 7000, and 8000 μM, respectively. (B) Shows the effect of changing the mobile buffer concentration. The solid lines, from lowest curve to highest, are for mobile buffer concentrations of 500, 300, and 100 μM, respectively, the fixed buffer concentration being 8000 μM in each case; the dashed lines show the effect of changing the fixed buffer so that the total buffer concentration is 8100 μM, the lower dashed line being for a mobile buffer concentration of 500 μM and the upper for a concentration of 300 μM. (C) Shows the effect of doubling the pumping rate (dashed line). (D) Shows the effect of changing the binding parameters for the high-affinity molecule: solid line, values as in Table 1; dashed line, qon × 3; dot-dashed line, qoff × 3; dotted line, qon × 3 and qoff × 3.
Given the above qualitative observations, the buffer concentrations were given values (Table 1) that best approximated the experimentally observed rate of facilitation at 100 Hz (Fig. 12 A) and 50 Hz (Fig. 12 B). The best fit gave calculated values at 100 Hz (solid line) that fall above the observations of Bennett and Fisher (1977; see their Fig. 7 A) whereas the calculated values at 50 Hz (solid line) are below the observations of Bennett and Fisher (1977; see their Fig. 7 B). Shown also are the results of calculating the facilitation using the deterministic version of the facilitation molecular scheme. As discussed in the Methods section, because of certain intrinsic differences between the MC and deterministic models, the results are not in strict agreement; however, the trends are the same and as shown in Fig. 12 changing the fixed buffer concentration from 5000 μM to 4000 μM in the deterministic model gives results that are compatible with the MC model.
Next, calculations were made of the effects of a conditioning impulse on quantal release due to a subsequent test impulse at different intervals, using the same parameter values arrived at for the trains of impulses (Table 1), and amplitudes and time constants of F1 and F2 facilitation similar to those observed experimentally were obtained (Fig. 13 B; compare with Fig. 13 A for the exocytosis molecular scheme). The decay rates τ1 and τ2 of ∼35 ms and 330 ms, respectively, (calculated using the solid curve in Fig. 13 B) may be compared with the experimentally determined values of 35–50 ms for τ1 and 259–300 ms for τ2 (Bennett and Fisher, 1977; Mallart and Martin, 1967; Magleby, 1973; Zengel and Magleby, 1980). The calculated values of the amplitudes F1(0) and F2(0) (again, using the solid curve in Fig. 13 B) are 0.55 and 0.15, respectively, and may be compared with those from experiments of 0.8 and 0.12, respectively (Magleby, 1973). Fig. 13 C shows the results of MC calculations; especially for longer time intervals there are large stochastic fluctuations and it would require more runs to smooth these. Experimentally, each observation involves the order of hundreds of active zones and many such observations are performed; the MC method only simulates one active zone.
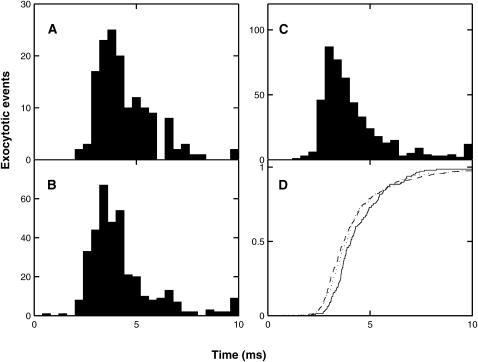
Fig. 14 shows the results of the same calculations as presented in Fig. 6, except that the molecular facilitation scheme is now used. Again, it is found that the kinetics of quantal release are not much altered by a prior conditioning impulse and that reducing the calcium influx by 50% also has little effect.
FIGURE 14.
The extent and timing of exocytosis that occurs as a result of a conditioning impulse followed by a test impulse 10 ms later according to the facilitation molecular scheme and the MC model (cf. Fig. 6). (A) Shows the cumulative release averaged over 1500 MC runs. (B) Gives the histograms of the corresponding delays in quantal release. For the first pulse there are 142 exocytotic events, with mean delay 3.146 ms and mean ± SD 1.029 ms; for the second pulse the corresponding values are 338 events, 3.053 ms, and 1.349 ms. Panels C and D repeat A and B for the case where the calcium influx is reduced by one-half and the number of runs increased to 10,500. For the first impulse there are 42 events, the mean delay is 3.424 ms and the mean ± SD is 1.193 ms; for the second impulse the corresponding values are 125 events, 3.383 ms, and 1.280 ms. In both cases, a two-tailed t-test indicated no significant difference between the distributions for the first and second pulses.
The distribution of synaptic delays for the first, fourth, and seventh impulses in the train of Fig. 7 A is shown in Fig. 15, A–C. There is a relatively constant distribution of quantal delays over the impulses even though quantal release increases more than threefold during the train. Fig. 15 D shows the normalized cumulative release for the second (solid line), fourth (dotted line), and seventh (dashed line) impulses. The tendency may be noted for later impulses to give rise to peak cumulative releases at later times. This has been observed to be the case experimentally (Van der Kloot, 1988).
FIGURE 15.
The frequency of secretion of quanta at different intervals after several impulses in a train of seven impulses at 50 Hz according to the MC model and the facilitatory molecular scheme. Panels A, B, and C are histograms of the number of releases in 50 runs, after the first, fourth, and seventh impulses, respectively; the bin width is 0.5 ms. (D) Shows the average cumulative quantal release after the second (P2, solid line), fourth (P4, dotted line), and seventh (P7, dashed line) impulse, all normalized to unity. Note that the time to peak is slightly longer for the later pulses (compare P4 and P7 with P1).
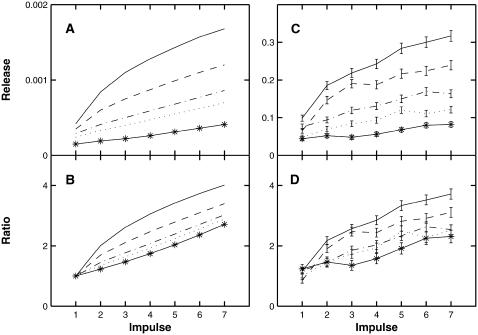
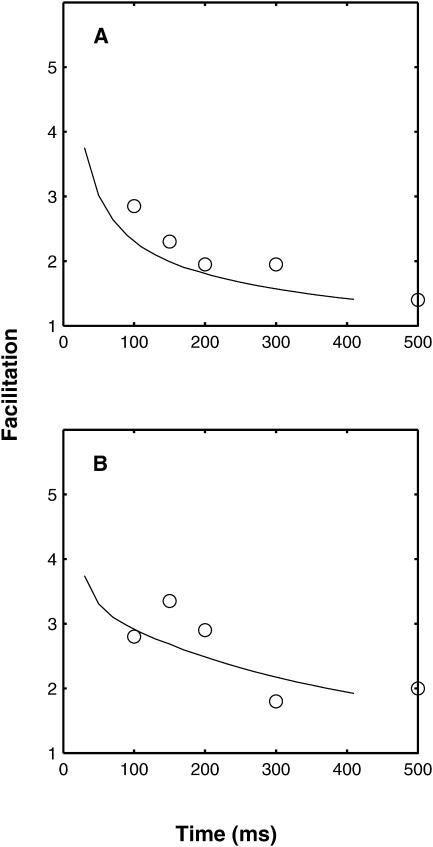
BAPTA decreases the extent of facilitation during 100-Hz trains of impulses at the amphibian neuromuscular junction (Tanabe and Kijima, 1992). The facilitating molecular scheme predicts this effect. Increasing exogenous buffer with the characteristics of BAPTA progressively decreases free calcium ion concentration for successive impulses, this decrease being greater with higher concentrations of BAPTA (Fig. 8 A). The result is a decrease in the calculated extent of exocytosis (Figs. 7 B and 16, A and C). The decrease in quantal release is relatively greater for successive impulses in the train in a given concentration of BAPTA (Fig. 16, A and C). This then results in a decrease in facilitation (Fig. 16, B and D), as is observed experimentally. BAPTA also increases the time course of decay of F2 facilitation observed at the frog neuromuscular junction (Tanabe and Kijima, 1992). The facilitation molecular scheme also predicts this effect. Fig. 17 shows that the increase in τ2 is from 308 ms (Fig. 17 A) to ∼433 ms (Fig. 17 B). This increase gives reasonable fits to the experimental observations of Tanabe and Kijima (1992). Also the amplitude of the fast component of facilitation decreases substantially in the presence of BAPTA, from 2.89 to 0.3, again in agreement with experiment. The other effect, shown in both the theoretical and experimental results in Fig. 17, is that BAPTA increases the amplitude of facilitation in the period after the termination of stimulation. This increase can be attributed to the slow release of calcium that has bound to BAPTA during the stimulation period.
FIGURE 16.
Effects of different concentrations of BAPTA on the cumulative quantal release Pn by each action potential during a train of seven impulses at 50 Hz, according to the facilitatory molecular scheme. (A) Gives the release (peak R in Eq. 6) for each impulse in the following concentrations of BAPTA: continuous line, 0 μM; dashed line, 30 μM; dot-dashed line, 70 μM; dotted line, 100 μM; asterisk line, 200 μM. (B) Gives the extent of facilitation, Pn/P1, for the same concentrations of BAPTA. Panels A and B are produced using the deterministic model; panels C and D repeat the calculations using the MC model, the results shown being the average of 1500 runs; note that C now gives the average number of quantal releases. Because of the stochastic variability in the release due to the first pulse (compare C with A), rather than dividing by the amplitude of the first pulse in D the curves have been normalized by dividing by an average ratio of C/A. Specifically, if bi is the amplitude of the ith pulse in B and ci is the amplitude of the ith pulse in C, then define α = meani(ci/bi) and use ci/α instead of ci/c1 to calculate D; this is done independently for each BAPTA level.
FIGURE 17.
Comparison between the predicted and experimental effects of BAPTA on the decay time course of facilitation. (A) Gives the control. (B) After the application of BAPTA (100 μM). Open circles are experimental results from Tanabe and Kijima (1992; see their Fig. 3), reduced by 0.5 to allow for augmentation and potentiation, and the continuous line the theoretical values calculated using the deterministic version of the facilitation molecular scheme. Theoretical values are not given for very short times as it is only for 100 ms and longer that accurate experimental values are available. The stimulation protocol for the theoretical curves was 10 pulses at 100 Hz, as this gave the best agreement with the experimental results during the rising phase (not shown). A double exponential fit to the solid line in panel A gives time constants of decay of 37 ms and 308 ms, with corresponding amplitudes of 2.89 and 1.52; for panel B the corresponding values are 50 ms and 433 ms, with amplitudes of 0.3 and 2.36. Experimentally, Tanabe and Kijima (1992) give F2 time constants of 325 ms for the control and 451 ms in the presence of BAPTA.
DISCUSSION
A Monte Carlo model, in which both a low- and a high-affinity calcium sensor molecule interact to trigger secretion within a submembraneous calcium microdomain, can account for a wide range of observations on secretion at the amphibian neuromuscular junction. These include the magnitude and time course of F1 and F2 facilitation (Magleby, 1973), the development of facilitation during short trains of impulses at different frequencies (Bennett and Fisher, 1977), the relative invariance of the distribution of synaptic delays between conditioning and test impulses (Van der Kloot, 1988), the tendency for later impulses in a short train to give rise to peak cumulative release at later times (Van der Kloot, 1988), and the effects of BAPTA in decreasing quantal release by a single impulse, as well as decreasing facilitation in a short train of impulses (Tanabe and Kijima, 1992). In this regard, it is interesting to note that a similar scheme cannot account for facilitation during trains of different frequencies at the crayfish neuromuscular junction. Tang et al. (2000) were able to predict the magnitude of facilitation but not its rate of growth during a train of impulses. In a subsequent article (Matveev et al., 2002) it was pointed out that there was a numerical error in the Tang et al. (2000) calculations. When this error was corrected, and in addition a tortuous diffusion pathway was introduced between the point of calcium entry and the high calcium-affinity molecule, their model was able to predict the time course of facilitation during a short 100-Hz train (Matveev et al., 2002). However, using their program for this model, we have been unable to predict the observed facilitation at the crayfish neuromuscular junction at other frequencies, such as 50 Hz. (See Appendix for details.)
A possible argument against the necessity of a high calcium-affinity molecule necessary for facilitation rests on the recent discovery that the relatively low calcium-affinity molecule may operate with affinities as high as 10–20 μM (Bollmann et al., 2000; Schneggenburger and Neher, 2000) rather than the value of ∼100 μM taken to be the case for this molecule in most nerve terminals (Rozov et al., 2001). We have tested this possibility by changing the affinities of the exocytotic molecule so that it triggers exocytosis if the submembraneous calcium reaches 10 μM in the absence of the high-affinity molecule. The residual calcium that remains from the first impulse, together with the partial saturation of the endogenous buffers in the submembraneous region (see Fig. 4), are not adequate to extend facilitation for longer than ∼50 ms and this is clearly insufficient to explain F2 facilitation. For the case of no BAPTA the peak free calcium increases by ∼200% in the terminal (Fig. 8 A) and by ∼10% in the submembraneous box (Fig. 9 A) between the first and fifth impulses in a train at 50 Hz. This increase in calcium concentration is insufficient to give facilitation of the order of 4 with a low calcium-affinity molecule alone and reasonable calcium concentrations for activating this molecule.
The question arises as to the extent to which an exogenous buffer such as BAPTA may contribute to facilitation simply by the conditioning impulse leading to partial saturation of BAPTA in the submembraneous region, so that the test impulse gives rise to relatively greater free calcium in this region, just as has been argued above in relation to facilitation and the endogenous buffers. (This phenomenon has been termed “pseudofacilitation” by Rozov et al., 2001.) However, this does not seem to be a significant factor according to our calculations. For the simulations presented in Fig. 9, the ratio of the peak free calcium concentration for the second impulse to that of the first impulse remains almost constant (at ∼1.05) for the three BAPTA concentrations of 0, 65, and 196 μM.
The question arises as to the molecular identity of the low calcium affinity and high calcium affinity sites in this model. Synaptotagmin I is a core protein in the SNARE complex that controls exocytosis (Südhof, 1995). Recent research points strongly to the C2A domain of synaptotagmin I as the low calcium affinity site that triggers exocytosis (Sorenson et al., 2003). The identity of the high calcium affinity site is not known. However, the superfamily of calcium binding molecules in neurons (Paterline et al., 2000), that has the capacity to modulate exocytosis (Pongs et al., 1993), may provide the high calcium affinity site. (See also Sippy et al., 2003; Zucker, 2003).
Acknowledgments
This work was supported by a University of Sydney Sesqui grant. Some results were generated using the computing facilities of ac3, which are supported by the New South Wales state government, Australian Partnership for Advanced Computing, and New South Wales universities.
APPENDIX: FACILITATION AT THE CRAYFISH NEUROMUSCULAR JUNCTION
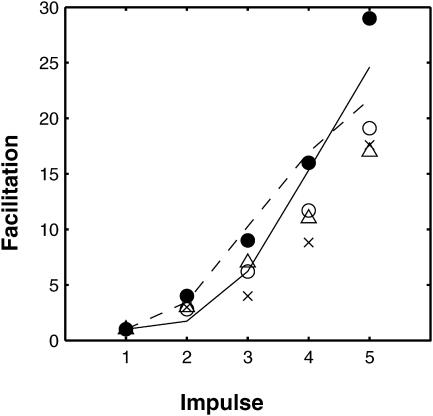
We have used the program of Matveev et al. (2002) (available on the web at http://mrb.niddk.nih.gov/matveev) to calculate the facilitation at the crayfish neuromuscular junction. For a train of five impulses at 100 Hz the calculated result (Fig. 18, solid line) agrees with that of Matveev et al. (control simulation in their Fig. 2 D; note that they plot Pn/P1 − 1 whereas we plot Pn/P1) and is in approximate agreement with 100-Hz experimental data, as plotted in Fig. 18. However, when the stimulation frequency is changed to 50 Hz the Matveev et al. scheme predicts more facilitation than at 100 Hz for the first few impulses (Fig. 18, dashed line) and this is in marked disagreement with the experimental data of Zucker (1974), which gives less facilitation.
FIGURE 18.
Facilitation at the crayfish neuromuscular junction, according to the model of Matveev et al. (2002). Theoretical results are shown for a stimulation train of five impulses at 100 Hz (solid line) and at 50 Hz (dashed line). Also shown is experimental data for the 100-Hz case: •, Tang et al. (2000), Fig. 1 C (Control); ○, Tang et al. (2000), Fig. 2 C (Control); ▵, Winslow et al. (1994), Fig. 2 C (Control); and for the 50-Hz case: ×, Zucker (1974), Table 3 (top line).
This is in contrast to our model for the amphibian neuromuscular junction, which gives less facilitation at the lower frequency, in agreement with the experimental data (Fig. 12). The reason for the different behavior in the Matveev et al. (2002) model is probably related to the slow diffusion that they have introduced into a 200-nm-wide layer around the active zone, causing the calcium to take more time to reach the high-affinity sites; at the lower frequency, the increased time interval between pulses allows more calcium to reach these sites and hence cause more facilitation.
References
- Atluri, P. P., and W. G. Regehr. 1996. Determinants of the time course of facilitation at the granule cell to Purkinje cell synapse. J. Neurosci. 16:5661–5671. [DOI] [PMC free article] [PubMed] [Google Scholar]
- Bain, A. I., and D. M. Quastel. 1992. Multiplicative and additive Ca(2+)-dependent components of facilitation at mouse endplates. J. Physiol. 455:383–405. [DOI] [PMC free article] [PubMed] [Google Scholar]
- Bartol, T. M. Jr., B. R. Land, E. E. Salpeter, and M. M. Salpeter. 1991. Monte Carlo simulation of miniature endplate current generation in the vertebrate neuromuscular junction. Biophys. J. 59:1290–1307. [DOI] [PMC free article] [PubMed] [Google Scholar]
- Bennett, M. R., and C. Fisher. 1977. The effects of calcium on the binomial parameters that control acetylcholine release during trains of nerve impulses at amphibian neuromuscular synapses. J. Physiol. 271:673–698. [DOI] [PMC free article] [PubMed] [Google Scholar]
- Bennett, M. R., W. G. Gibson, and J. Robinson. 1997. Probabilistic secretion of quanta and the synaptosecretosome hypothesis: evoked release at active zones of varicosities, boutons and endplates. Biophys. J. 73:1815–1829. [DOI] [PMC free article] [PubMed] [Google Scholar]
- Bennett, M. R., L. Farnell, and W. G. Gibson. 2000a. The probability of quantal secretion near a single calcium channel of an active zone. Biophys. J. 78:2201–2221. [DOI] [PMC free article] [PubMed] [Google Scholar]
- Bennett, M. R., L. Farnell, and W. G. Gibson. 2000b. The probability of quantal secretion within an array of calcium channels of an active zone. Biophys. J. 78:2222–2240. [DOI] [PMC free article] [PubMed] [Google Scholar]
- Blundon, J. A., S. N. Wright, M. S. Brodwick, and G. D. Bittner. 1993. Residual free calcium is not responsible for facilitation of neurotransmitter release. Proc. Natl. Acad. Sci. USA. 90:9388–9392. [DOI] [PMC free article] [PubMed] [Google Scholar]
- Bollmann, J. H., B. Sakmann, J. Gerard, and G. Borst. 2000. Calcium sensitivity of glutamate release in a calyx-type terminal. Science. 289:953–957. [DOI] [PubMed] [Google Scholar]
- Carlson, C. G., and J. W. Jacklet. 1986. The exponent of the calcium power function is reduced during steady-state facilitation in neuron R15 of Aplysia. Brain Res. 376:204–207. [DOI] [PubMed] [Google Scholar]
- Cooper, R. L., J. L. Winslow, C. K. Govind, and H. L. Atwood. 1996. Synaptic structural complexity as a factor enhancing probability of calcium-mediated transmitter release. J. Neurophysiol. 75:2451–2466. [DOI] [PubMed] [Google Scholar]
- David, G., J. N. Barrett, and E. F. Barrett. 1998. Evidence that mitochondria buffer physiological Ca2+ loads in lizard motor nerve terminals. J. Physiol. 509:59–65. [DOI] [PMC free article] [PubMed] [Google Scholar]
- Delcour, A. H., D. Lipscombe, and R. W. Tsien. 1993. Multiple modes of N-type calcium channel activity distinguished by differences in gating kinetics. J. Neurosci. 13:181–194. [DOI] [PMC free article] [PubMed] [Google Scholar]
- el Far, O., N. Charvin, C. Leveque, N. Martin-Moutot, M. Takahashi, and M. J. Seagar. 1995. Interaction of synaptobrevin (VAMP)-syntaxin complex with presynaptic calcium channels. FEBS Lett. 361:101–105. [DOI] [PubMed] [Google Scholar]
- Heinemann, C., R. H. Chow, E. Neher, and R. S. Zucker. 1994. Kinetics of the secretory response in bovine chromaffin cells following flash photolysis of caged Ca2+. Biophys. J. 67:2546–2557. [DOI] [PMC free article] [PubMed] [Google Scholar]
- Heuser, J. E., and T. S. Reese. 1973. Evidence for recycling of synaptic vesicle membrane during transmitter release at the frog neuromuscular junction. J. Cell Biol. 57:315–344. [DOI] [PMC free article] [PubMed] [Google Scholar]
- Kamiya, H., and R. S. Zucker. 1994. Residual Ca2+ and short-term synaptic plasticity. Nature. 371:603–606. [DOI] [PubMed] [Google Scholar]
- Kargacin, G., and F. S. Fay. 1991. Ca2+ movement in smooth muscle cells studied with one- and two-dimensional diffusion models. Biophys. J. 60:1088–1100. [DOI] [PMC free article] [PubMed] [Google Scholar]
- Katz, B., and R. Miledi. 1965a. The measurement of synaptic delay, and the time course of acetylcholine release at the neuromuscular junction. Proc. R. Soc. Lond. B Biol. Sci. 161:483–495. [DOI] [PubMed] [Google Scholar]
- Katz, B., and R. Miledi. 1965b. The effect of temperature on the synaptic delay at the neuromuscular junction. J. Physiol. 181:656–670. [DOI] [PMC free article] [PubMed] [Google Scholar]
- Klingauf, J., and E. Neher. 1997. Modeling buffered Ca2+ diffusion near the membrane: implications for secretion in neuroendocrine cells. Biophys. J. 72:674–690. [DOI] [PMC free article] [PubMed] [Google Scholar]
- Lando, L., and R. S. Zucker. 1994. Ca2+ cooperativity in neurosecretion measured using photolabile Ca2+ chelators. J. Neurophysiol. 72:825–830. [DOI] [PubMed] [Google Scholar]
- Llinás, R., M. Sugimori, D. E. Hillman, and B. Cherksey. 1992. Distribution and functional significance of the P-type voltage dependent Ca2+-channels in the mammalian central nervous system. Trends Neurosci. 15:351–355. [DOI] [PubMed] [Google Scholar]
- Magleby, K. L. 1973. The effect of repetitive stimulation on facilitation of transmitter release at the frog neuromuscular junction. J. Physiol. 234:327–352. [DOI] [PMC free article] [PubMed] [Google Scholar]
- Mallart, A., and A. R. Martin. 1967. An analysis of facilitation of transmitter release at the neuromuscular junction of the frog. J. Physiol. 193:679–694. [DOI] [PMC free article] [PubMed] [Google Scholar]
- Martin-Moutot, N., N. Charvin, C. Leveque, K. Sato, T. Nishiki, S. Kozaki, M. Takahashi, and M. Seagar. 1996. Interaction of SNARE complexes with P/Q-type calcium channels in rat cerebellar synaptosomes. J. Biol. Chem. 271:6567–6570. [DOI] [PubMed] [Google Scholar]
- Matveev, V., A. Sherman, and R. S. Zucker. 2002. New and corrected simulations of synaptic facilitation. Biophys. J. 83:1368–1373. [DOI] [PMC free article] [PubMed] [Google Scholar]
- Neher, E. 1998. Usefulness and limitations of linear approximations to the understanding of Ca++ signals. Cell Calcium. 24:345–357. [DOI] [PubMed] [Google Scholar]
- Nowycky, M. C., and M. J. Pinter. 1993. Time courses of calcium and calcium-based buffers following calcium influx in a model cell. Biophys. J. 64:77–91. [DOI] [PMC free article] [PubMed] [Google Scholar]
- O'Connor, V. M., O. Shamotienko, E. Grishin, and H. Betz. 1993. On the structure of the ‘synaptosecretosome.’ Evidence for a neurexin/synaptotagmin/syntaxin/Ca2+ channel complex. FEBS Lett. 326:255–260. [DOI] [PubMed] [Google Scholar]
- Paterline, M., V. Revilla, A. L. Grant, and W. Wisden. 2000. Expression of the neuronal calcium sensor protein family in the rat brain. Neuroscience. 99:205–216. [DOI] [PubMed] [Google Scholar]
- Pongs, O., J. Lindemeier, X. R. Zhu, T. Thiel, D. Engelkamp, I. Krah-Jentgens, H. G. Lambrecht, K. W. Kuch, J. Schwemer, and R. Rivosecchi. 1993. Frequenin - a novel calcium-binding protein that modulates synaptic efficacy in the Drosophila nervous system. Neuron. 11:15–28. [DOI] [PubMed] [Google Scholar]
- Robitaille, R., E. M. Adler, and M. P. Charlton. 1990. Strategic location of calcium channels at transmitter release sites of frog neuromuscular synapses. Neuron. 5:773–779. [DOI] [PubMed] [Google Scholar]
- Rozov, A., N. Burnashev, B. Sakmann, and E. Neher. 2001. Transmitter release modulation by intracellular Ca2+ buffers in facilitating and depressing nerve terminals of pyramidal cells in layer 2/3 of the rat neocortex indicates a target cell-specific difference in presynaptic calcium dynamics. J. Neurophysiol. Lond. 531:807–826. [DOI] [PMC free article] [PubMed] [Google Scholar]
- Sala, F., and A. Hernandez-Cruz. 1990. Calcium diffusion modeling in a spherical neuron. Relevance of buffering properties. Biophys. J. 57:313–324. [DOI] [PMC free article] [PubMed] [Google Scholar]
- Schneggenburger, R., and E. Neher. 2000. Intracellular calcium dependence of transmitter release rates at a fast central synapse. Nature. 406:889–893. [DOI] [PubMed] [Google Scholar]
- Simon, S. M., and R. R. Llinás. 1985. Compartmentalization of the submembrane calcium activity during calcium influx and its significance in transmitter release. Biophys. J. 48:485–498. [DOI] [PMC free article] [PubMed] [Google Scholar]
- Sippy, T., A. Cruz-Martin, A. Jeromin, and F. E. Schweizer. 2003. Acute changes in short-term plasticity at synapses with elevated levels of neuronal calcium sensor-1. Nat. Neurosci. 6:1031–1038. [DOI] [PMC free article] [PubMed] [Google Scholar]
- Smith, G. D., J. Wagner, and J. Keizer. 1996. Validity of the rapid buffering approximation near a point source of calcium ions. Biophys. J. 70:2527–2539. [DOI] [PMC free article] [PubMed] [Google Scholar]
- Sorenson, J. B., R. Fernandez-Chacon, T. C. Südhof, and E. Neher. 2003. Examining synaptotagmin I function in dense core vesicle exocytosis under direct control of Ca2+. J. Gen. Physiol. 122:265–276. [DOI] [PMC free article] [PubMed] [Google Scholar]
- Stanley, E. F. 1986. Decline in calcium cooperativity as the basis of facilitation at the squid giant synapse. J. Neurosci. 6:782–789. [DOI] [PMC free article] [PubMed] [Google Scholar]
- Südhof, T. C. 1995. The synaptic vesicle cycle: a cascade of protein-protein interactions. Nature. 375:645–653. [DOI] [PubMed] [Google Scholar]
- Tanabe, N., and H. Kijima. 1992. Ca(2+)-dependent and -independent components of transmitter release at the frog neuromuscular junction. J. Physiol. 455:271–289. [DOI] [PMC free article] [PubMed] [Google Scholar]
- Tang, Y., T. Schlumpberger, T. Kim, M. Lueker, and R. S. Zucker. 2000. Effects of mobile buffers on facilitation: experimental and computational studies. Biophys. J. 78:2735–2751. [DOI] [PMC free article] [PubMed] [Google Scholar]
- Van der Kloot, W. 1988. The kinetics of quantal release during end-plate currents at the frog neuromuscular junction. J. Physiol. 402:605–626. [DOI] [PMC free article] [PubMed] [Google Scholar]
- Vyshedskiy, A., and J-W Lin. 1997. Activation and detection of facilitation as studied by presynaptic voltage control at the inhibitor of the crayfish opener muscle. J. Neurophysiol. 77:2300–2315. [DOI] [PubMed] [Google Scholar]
- Winslow, J. L., S. N. Duffy, and M. P. Charlton. 1994. Homosynaptic facilitation of transmitter release in crayfish is not affected by mobile calcium chelators: implications for the residual ionized calcium hypothesis from electrophysiological and computational analyses. J. Neurophysiol. 72:1769–1793. [DOI] [PubMed] [Google Scholar]
- Wright, S. N., M. S. Brodwick, and G. D. Bittner. 1996. Calcium currents, transmitter release and facilitation of release at voltage-clamped crayfish nerve terminals. J. Physiol. 496:363–378. [DOI] [PMC free article] [PubMed] [Google Scholar]
- Wu, L. G., and P. Saggau. 1994. Presynaptic calcium is increased during normal synaptic transmission and paired-pulse facilitation, but not in long-term potentiation in area CA1 of hippocampus. J. Neurosci. 14:645–654. [DOI] [PMC free article] [PubMed] [Google Scholar]
- Yamada, W. M., and R. S. Zucker. 1992. Time course of transmitter release calculated from simulations of a calcium diffusion model. Biophys. J. 61:671–682. [DOI] [PMC free article] [PubMed] [Google Scholar]
- Yamoah, E. N., E. A. Lumpkin, R. A. Dumont, P. J. Smith, A. D. Hudspeth, and P. G. Gillespie. 1998. Plasma membrane Ca2+-ATPase extrudes Ca2+ from hair cell stereocilia. J. Neurosci. 18:610–624. [DOI] [PMC free article] [PubMed] [Google Scholar]
- Yoshida, A., C. Oho, A. Omore, R. Kuwahara, T. Ito, and M. Takahashi. 1992. HPC-1 is associated with synaptotagmin and omega-conotoxin receptor. J. Biol. Chem. 267:24925–24928. [PubMed] [Google Scholar]
- Zengel, J. E., and K. L. Magleby. 1980. Differential effects of Ba2+, Sr2+ and Ca2+ on stimulation-induced changes in transmitter release at the frog neuromuscular junction. J. Gen. Physiol. 76:175–211. [DOI] [PMC free article] [PubMed] [Google Scholar]
- Zucker, R. S. 1974. Characteristics of crayfish neuromuscular facilitation and their calcium dependence. J. Physiol. 241:91–110. [DOI] [PMC free article] [PubMed] [Google Scholar]
- Zucker, R. S., and A. L. Fogelson. 1986. Relationship between transmitter release and presynaptic calcium influx when calcium enters through discrete channels. Proc. Natl. Acad. Sci. USA. 83:3032–3036. [DOI] [PMC free article] [PubMed] [Google Scholar]
- Zucker, R. S. 2003. NCS-1 stirs somnolent synapses. Nat. Neurosci. 6:1006–1008. [DOI] [PubMed] [Google Scholar]


