Abstract
Directed and Brownian movement of class I major histocompatibility complex (MHC) molecules on cell membranes is implicated in antigen presentation. Previous studies indicated that the class I MHC cytoplasmic tail imposes constraints on the molecule's diffusion. Here we used single particle tracking to study the mobility of the wild-type mouse H-2Ld class I MHC molecule and of seven cytoplasmic tail variants. Six of the variants have cytoplasmic tails of four or seven residues (differing in net charge), and one is tailless, yet all are susceptible to confinement in membrane domains. However, truncation of the cytoplasmic tail to 0–4 residues decreases the proportion of particles exhibiting confined diffusion and increases the proportion exhibiting simple diffusion. Particularly for the truncated mutants (tail length of 0–7 residues), many of the particles have complex trajectories and do not move at a constant speed or in the same mode of diffusion throughout the observation period. Several particles of the tailless H-2Ld mutant display a type of directed diffusion that is rarely observed for other H-2Ld mutants. Taken together, these data show that even short cytoplasmic tails can influence markedly class I MHC mobility and that cytoplasmic tail length and sequence affect the molecule's diffusion in the membrane.
INTRODUCTION
The movement of membrane proteins into and out of dynamic membrane microdomains has been well documented (Edidin, 2001). This dynamic behavior of membrane proteins may affect their biological activities and thus almost certainly is regulated. We are interested in the relationship between the lateral mobility and the biological activity of class I major histocompatibility complex (MHC) molecules. These glycoproteins present antigenic peptides to cytotoxic T-cells and natural killer (NK) cells (Smith et al., 1997; Williams et al., 2002). During antigen presentation class I MHC molecules and adhesion molecules are recruited to a specialized junction (the immunological synapse) between the MHC-presenting cell and the T-cell or NK cell (Davis, 2002; Fassett et al., 2001; Potter et al., 2001). Recruitment of class I MHC molecules into this intercellular junction must involve lateral mobility: either stochastic Brownian diffusion or directed mobility. In either case, to accumulate at the site of contact with the T-cell or NK cell, class I MHC molecules must cross the barriers imposed by membrane corrals in the submembrane cytoskeleton and/or by membrane picket fences formed by transmembrane proteins that are tethered to the membrane skeleton (Fujiwara et al., 2002).
The diffusion of class I MHC molecules in the plasma membrane has been studied in various cell types (Edidin et al., 1991, 1994; Edidin and Stroynowski, 1991; Edidin and Zúñiga, 1984; Georgiou et al., 2002; Smith et al., 1997, 1999). Structural features of the class I MHC molecule influence its behavior on the membrane. The glycosylation of the ectodomain affects the measured diffusion coefficient, D, (Wier and Edidin, 1988), perhaps due to the large exclusion volume of carbohydrate side chains (Kusumi and Sako, 1996). Early studies on truncation mutants showed an influence of the cytoplasmic tail on the fraction of molecules observed to be mobile in fluorescence photobleaching and recovery (FPR) experiments (Edidin and Stroynowski, 1991) and on the barrier-free path (BFP) of molecules moved across the cell surface by a laser trap (Edidin et al., 1991). In an earlier study employing FPR or a laser trap to measure the D and BFP of mouse H-2Ld class I MHC molecules having cytoplasmic tails of varying length, we found that an H-2Ld mutant having a cytoplasmic tail of seven amino acids was as restricted in its lateral mobility as was the wild-type (WT) H-2Ld molecule with a full-length (31 amino acid) cytoplasmic tail (Edidin et al., 1994). In contrast, H-2Ld mutants with a cytoplasmic tail of four residues or no cytoplasmic tail had a higher mobile fraction and a longer barrier-free path than did the wild-type H-2Ld molecule. The differences in mobility of molecules with the four-residue versus the seven-residue cytoplasmic tail suggested that a membrane skeleton sited 2–3 nm below the plasma membrane limits class I MHC movement on the cell surface (Edidin et al., 1994).
In this article, we revisit the role of the cytoplasmic domain in class I MHC mobility on the plasma membrane. We were motivated to do so by two concerns. First, the four- and seven-residue cytoplasmic tails examined in our earlier studies differ from each other in charge as well as in length (Edidin et al., 1994). This made it impossible to distinguish effects of mechanical confinement by the membrane skeleton (corralling) or by membrane pickets (caging) from effects of electrostatic interactions between class I MHC molecules and the submembrane cytoskeleton (anchoring). Secondly, our earlier studies were performed with a laser trap that could drag particles through low energy barriers (Edidin et al., 1994); this may have exaggerated the differences between molecules with four-residue tails and those with seven-residue tails. We now have created a series of four additional homologous four- and seven-residue mutants of the cytoplasmic tail of the H-2Ld molecule that differ in charge. We have used antibody-coated gold particles and single particle tracking (SPT) methods (Saxton and Jacobson, 1997; Sheets et al., 1995) to track their diffusion on the surfaces of transfected HEPA-OVA cells. Mean square displacement (MSD) analyses confirm that cytoplasmic tail length influences the proportion of molecules that exhibit confined, directed, and simple diffusion. Thus, 65–75% of the particles tracked for the H-2Ld variants having cytoplasmic tails of seven or 31 residues exhibit confined diffusion, whereas only 49–53% of the particles tracked for the zero- or four-residue tailed H-2Ld mutants exhibit confined diffusion. These results support our previous conclusion that a submembrane barrier, perhaps cytoskeletal in nature, constrains H-2Ld diffusion across the membrane. However, differences in the proportion of particles exhibiting confined, simple, and directed diffusion were observed for H-2Ld mutants whose cytoplasmic tails are of identical length but of different net charge. Dissection of individual particle trajectories showed, as reported previously for other membrane proteins (Kusumi et al., 1993; Sheetz et al., 1989; Simson et al., 1995, 1998), that particles frequently exhibit more than one mode of diffusion. Taken together, our data on the eight cytoplasmic tail variants of H-2Ld indicate that both the length and the charge of the class I MHC cytoplasmic tail play a role in constraining the molecule's diffusion on the membrane. The variety of constraints observed suggests that antigen-presenting cells can optimize engagement of T-cell receptors by modulating modes of lateral mobility of the class I MHC molecules and so enhance T-cell immune responses focused on class I MHC.
MATERIALS AND METHODS
Generation of cytoplasmic tail mutants
The 221, 911, and C48 cytoplasmic tail mutants of H-2Ld were described previously (Zúñiga and Hood, 1986; Zúñiga et al., 1983). The Z1, Z2, Z3, and Z4 mutants were generated by polymerase chain reaction (PCR), using an H-2Ld cDNA in pBS (Stratagene, La Jolla, CA) as the template. A common 5′ primer (GCGCGGATCCCAGATGGGG) was used to generate all four mutants. The 3′ primers were as follows: CCGGAATTCTTATCTCCTTCTCTTCATCAC (Z1), TTATTCTTCTTCTGTGTTTCTCTTCATCACAAAAGC (Z2), TTATTCTTCTGTGTTCCTTCTCTTCATCACAA (Z3), and CCCGGAATTCTTATTCTGTGTTTCTCCTTCTCTT (Z4). PCR was performed on 200 ng template in a 100-μl reaction containing the following: 20 mM Tris-Cl (pH 8.5), 10 mM (NH4)2SO4, 2 mM MgCl2, 100 μg/ml bovine serum albumin (BSA), 0.1% Triton X-100, 0.11mM of each of the deoxynucleoside triphosphates (dNTPs), 5% dimethyl sulfoxide (DMSO), 1 μM each of 3′- and 5′-primers, and 2.5 units of thermostable Pfu DNA polymerase (Stratagene). The program used for PCR reactions involving the Z1 and Z3 primers includes a denaturing step of 94°C for 4 min; five cycles of 94°C for 1 min, 50°C for 2 min, 60°C for 3 min; 30 cycles of 94°C for 1 min, 65°C for 2 min, 72°C for 3 min; and a final extension step of 72°C for 7 min. The PCR program used for reactions using the Z2 and Z4 primers has a denaturing step of 94°C for 4 min; 50°C for 2 min, 60°C for 3 min; 30 cycles of 94°C for 1 min, 65°C for 2 min, 72°C for 3 min; and a final extension step of 72°C for 7 min. The mutant genes were subsequently reamplified, using the same PCR conditions to produce enough DNA for ligations. The PCR products were ligated into the EcoRV site of PBS, and the mutations were confirmed by DNA sequencing. The mutant H-2Ld cDNAs were then purified on a HindIII-XbaI fragment and cloned directionally into the pRc/CMV plasmid (Invitrogen, Carlsbad, CA), which had been cut with HindIII and XbaI.
Generation of stable transfectant cell lines
HEPA-OVA cells were transfected with Qiagen-purified plasmids using the Superfect transfection reagent (Qiagen, Valencia, CA) according to the manufacturer's protocol. Stable transfectant cell lines were generated by selection in G418 (400 μg/ml). Transfectants expressing equivalent amounts of H-2Ld were selected by flow cytometry on a Coulter EPICS 752 cytometer equipped with Cytomation Cyclops software (Beckman Coulter, Fullerton, CA) after staining with monoclonal antibody (mAb) 30.5.7, specific for H-2Ld (Ozato et al., 1980), followed by Cy-3-labeled goat anti-mouse immunoglobulin (Jackson ImmunoResearch Laboratories, West Grove, PA).
Coating of 40-nm gold particles with mAbs
mAb 30.5.7 was purified by affinity chromatography (Zúñiga et al., 1983) on protein A Sepharose (Sigma, St. Louis, MO). A quantity of 0.5 ml mAb 30.5.7 (0.2 mg/ml) was mixed with 0.5 ml 40-nm gold particles (EY Laboratories, San Mateo, CA) and incubated on ice for 10 min. BSA was added to a final concentration of 5 mg/ml in PBS. The sample was centrifuged in a refrigerated microcentrifuge at 6000 rpm for 15 min. The gold particle pellet was washed three times with 1 ml PBS containing 5 mg/ml BSA and finally was resuspended in 0.25 ml of the same solution. The gold particle suspension was sonicated on ice immediately before use to disrupt aggregates.
Incubation of cells with mAb 30.5.7-colloidal gold particles
HEPA-OVA cells transfected with the various H-2Ld constructs were grown on coverslips. Coverslips were rinsed with HEPES-buffered Hanks containing 2% fetal bovine serum (FBS) and incubated with 20 μl freshly sonicated mAb 30.5.7-gold suspension at 4°C for ∼35 min. The coverslips were washed gently with HEPES-buffered Hanks containing 2% fetal bovine serum and analyzed immediately as described below.
Electron microscopy
Cells labeled with mAb 30.5.7-coated gold particles were fixed in gluataraldehyde and processed to epon embedding. Sections of cells were examined on a Philips 410 microscope (Philips Electronics, Eindhoven, Netherlands).
Gold particle tracking and data analysis
Coverslips were mounted onto microscope slides and visualized by differential interference contrast microscopy with a 63× NA 1.4 objective on a Zeiss Axiovert Microscope (Carl Zeiss Microimaging, Thornwood, NY), the microscope stage of which was warmed to ∼36°C. Video sequences were captured with a fast charge-coupled device (CCD) camera (CCD72S model, DAGE-MTI, Michigan City, IN) with a time resolution of 33 ms and were recorded to tape on a SONY EVO-9650 Hi8 VCR (SONY Electronics, Parkridge, NJ). MetaMorph 4.0 software (Universal Imaging, Downingtown, PA) was used to control the capture. Video sequences were digitized to AVI movies with a video capture card (Maruel 6400-TV, Matrox Graphics, Dorval, Canada). AVI movies were then exported to TIFF image sequences with QuickTime software (Apple Computer, Cupertino, CA).
The TIFF images were converted to an ISee image list, and the NanoTrack module in ISee software (version 5.0, ISee Imaging System, Raleigh, NC) was used to track individual gold particles. This software tracks the centroid of a given particle through the sequence of images and outputs the x-y coordinates of the particle in successive images. These data were used to calculate the mean square displacement versus time (MSD versus Δt) for each particle. A microscopic diffusion coefficient (Dmicro) was determined by a linear fit of the MSD at 2δt, 3δt, and 4δt (Kusumi et al., 1993). The MSD-Δt plot of a particle undergoing simple diffusion in two dimensions is a straight line with a slope of 4D, where D is the diffusion coefficient. The MSD versus Δt plot for directed diffusion deviates from the straight line positively (i.e., curves upward), whereas the MSD versus Δt plot for restricted (confined) diffusion deviates negatively, curving downward (Kusumi et al., 1993). The relative deviation, RD(N,n) = MSD(N,n)/(4Dmicronδt), where MSD(N,n) represents MSD measured at a time interval nδt from a sequence of N video frames, and 4Dmicronδt is the expected average value of MSD for particles undergoing simple diffusion with a diffusion coefficient of Dmicro in two-dimensional space (Kusumi et al., 1993), was calculated to obtain a quantitative parameter for the observed deviation from a straight line (i.e., deviation from RD(N,n) = 1). To minimize erroneous assignment of particles as having directed or confined diffusion, the RD(N,n) values of the outlying 2.5% of the particles at each end of the distribution, referred to as RDmin(N,n) and RDmax(N,n), were determined (Kusumi et al., 1993). Using a fixed n of 90 time points we classified any particle having an RD(N,n) value greater than RDmax (N,n) as having directed diffusion and any particle having an RD(N,n) smaller than RDmin (N,n) as exhibiting restricted diffusion (Kusumi et al., 1993). In the case of particularly long trajectories (N > 1200), we used a combination of extrapolation of the plots in Fig. 7 of Kusumi's seminal article on this method (Kusumi et al., 1993) and visual examination of the trajectories to assign the diffusional mode. We endeavored to minimize tracking artifacts (Martin et al., 2002; Saxton, 1995) by confining our analysis to particles that were tracked for 300 video frames or more (average of 827 video frames per trajectory) and by analyzing data from 345 different time sequences spanning a total of 8-h tracking time obtained on several cell preparations examined in six experiments. The drift velocity of particles exhibiting directed diffusion (as defined by RD analysis) was calculated from the following equation: V2 = (MSD(N,n) − 4D2–4nδt)/(nδt)2, where N = 1000, n = 90, and δt = 33 ms. Solving this equation at the point of motional mode assignment provides a value for velocity, which when then used to calculate MSD at other time points, yields a value that is in agreement with the MSD of the actual particle trajectory.
FIGURE 7.
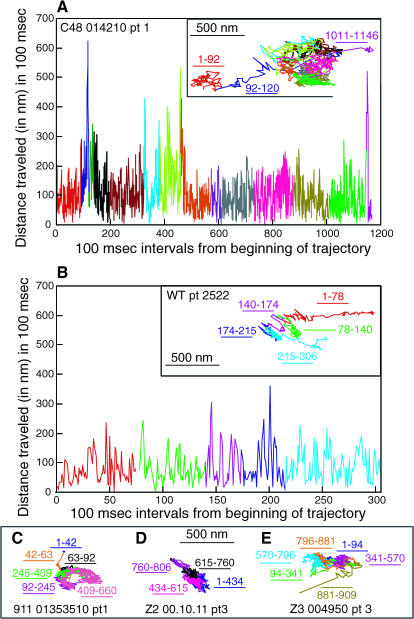
Examples of particle trajectories of the C48, 911, Z2, and Z3 H-2Ld variants exhibiting confined diffusion and of a WT particle exhibiting simple diffusion. Diffusional modes were assigned by RD analysis. The distance traveled in 100-ms time intervals across the entire trajectory is plotted for a C48 particle (A) and for a WT particle (B), both of which were observed to have large 100-ms jump sizes. The time frame is shown on the abscissa and the distance traveled (in nanometers) is shown on the ordinate. In the case of the C48 particle only the initial and final components of the trajectory are marked because of space limitations. Dissected trajectories of a 911 particle, a Z2 particle, and a Z3 particle are shown in C, D, and E, respectively, without 100-ms step analysis, because of space limitations. The 500-nm scale bars shown allow a direct comparison of the range of the trajectories shown.
Generation of simulated random walks
To control for fluctuations inherent in random walks (Saxton and Jacobson, 1997), 1000 simulated random walks were generated with a Gaussian Random Deviate Generator Program provided to us by Drs. Akihiro Kusumi and Ken Ritchie (Dept. of Biological Sciences, Nagoya University, Nagoya, Japan). In this system trajectories are built by the addition of randomly sized steps in the x and y directions based on a Gaussian distribution (Ken Ritchie, personal communication). These simulated trajectories were analyzed in the same manner as the experimental particles as described above and below.
Dissection of particle trajectories and data analysis
To dissect the trajectories we first plotted the distance traveled by a particle from its origin over all 33-ms frames of the trajectory. This made it possible to follow the thread of the trajectory and to discern features that might otherwise be difficult to distinguish, such as backtracking. To determine if particle velocity varied during the observation period, change in the relative particle position was calculated at 100-ms intervals. Specifically, the displacement across video frames 1–4, 2–5, 3–7, etc., was calculated by applying the Pythagorean theorem to generate a separate data bank for each variant. This step distance was plotted with respect to the total observation period, allowing an evaluation of particle speed throughout the trajectory.
To compare quantitatively the range of velocities experienced throughout the particle trajectories, a trajectory-specific average 100-ms jump size was calculated for 30 trajectories for each H-2Ld variant and for 50 simulated random walks. Each 100-ms step in a trajectory was normalized to the average step for that variant (simulated random walk or H-2Ld variant), giving a quotient QT. Similarly, each 100-ms step for a given variant was normalized to the average for all 100-ms steps in all trajectories of that given variant to give a quotient QV. The normalized QV data were sorted into bins differing from each other in a geometric progression of 1.2. The modal bin of 100-ms steps was then used as a reference, RMAX, against which the QV ranges were compared. The number of 100-ms jumps with a given QV range was divided by the number of jumps that fell within the RMAX range to give the quotient QR. This treatment allowed a comparison of each of the H-2Ld variants to simulated random walks on the basis of jump size.
Statistical analysis
For the data shown in Figs. 2 and 8, the standard deviations and SEs of the mean were calculated according to standard methods (Sokal and Rohlf, 1995). SEs were calculated for a confidence level of 99% (i.e., p = 0.01).
FIGURE 2.
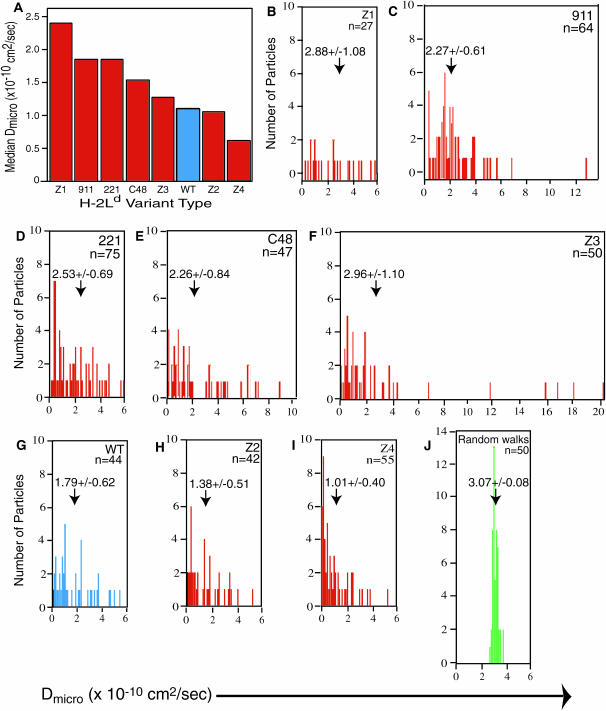
Microscopic diffusion coefficients (Dmicro) for the particles tracked for the eight H-2Ld variants on HEPA-OVA cell membranes. Dmicro was calculated for each particle tracked from SPT data by a linear fit of the MSD at 2δt, 3δt, and 4δt using the methods of Kusumi (Kusumi et al., 1993). The median Dmicro values for each of the H-2Ld variants are shown in A, and the mean Dmicro value and the SE of the mean (p = 0.01) for each variant are provided in each panel, with an arrow indicating its position on the plot of the distribution of Dmicro values for each of the H-2Ld variants (B–I) and for 50 simulated random walks (J). The name of the variant and the number of particles (n) analyzed are provided in the upper right hand corner of each panel. The data for wild-type H-2Ld (WT) are in blue (one column in A and all data in G), whereas those for the simulated random walks are colored green (J).
FIGURE 8.
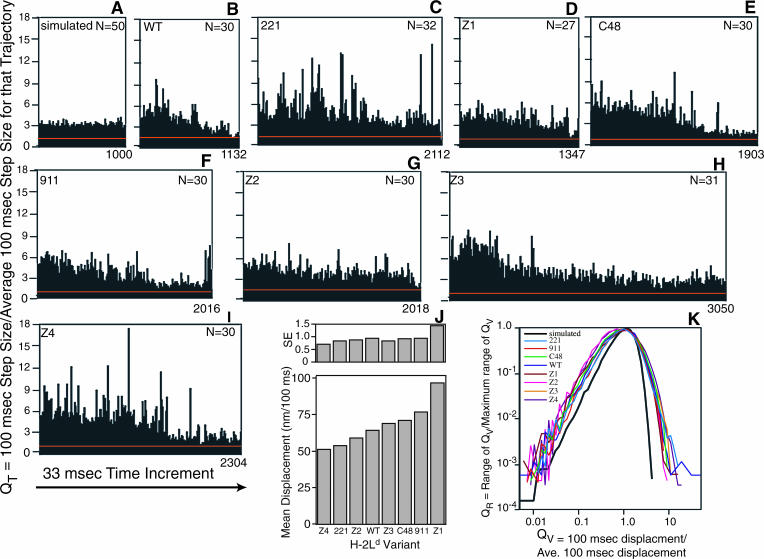
Distance traveled by particles in 100-ms time increments. The distances in the x and y directions were calculated for 100-ms time intervals for 50 simulated random walks (A) and for the indicated number of particles per H-2Ld variant (B–I), for a total of 290 particles. (A–I) QT is the quotient of the 100-ms step of a trajectory divided by that trajectory's average step size. The mean 100-ms jump size ± SE of the mean (p = 0.01) for simulated random particles is shown as a red line on each of the plots. (J) The mean displacement (nm/100 ms) and the standard error (SE) of the mean (p = 0.01) were calculated for each of the eight H-2Ld variants. The SE value for each variant is displayed directly above the mean displacement data for that variant. (K) The 100-ms jump size data of each trajectory were collated into variant-specific banks, and a variant-specific average was calculated for each. QV represents the quotient of each 100-ms step of a variant divided by that variant's average 100-ms step size. Each data set of QV values was sorted into categories of QV that differ from each other by a geometric progression of 1.2, and the QV range that returned the highest proportion of QV values was determined. RMAX, the number of 100-ms jumps that fell within this range, was tabulated and was used as a reference against which the QV ranges were compared. The number of 100-ms jumps with a given QV was divided by the number of jumps that fell within the RMAX range to give the quotient QR. Refer to Materials and Methods for further details and to Results for interpretation.
RESULTS
Single particle tracking of wild-type H-2Ld and cytoplasmic tail mutants on the cell surface
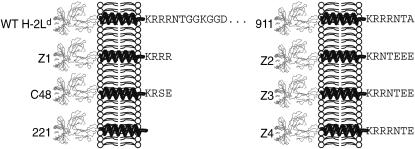
To study the effects of cytoplasmic tail length and sequence on the diffusion of class I MHC on the cell membrane we used SPT methods on HEPA-OVA cells transfected with either the WT H-2Ld class I MHC molecule or with one of seven different cytoplasmic tail mutants of H-2Ld (Fig. 1). These variants include four seven-residue cytoplasmic tail mutants differing in the charge of the tail (911, Z2, Z3, and Z4), two four-residue cytoplasmic tail mutants, also differing in the charge of the tail (C48 and Z1), and one mutant having no cytoplasmic tail (221). WT H-2Ld and three of the variants in this study, the seven-residue tailed 911, the four-residue tailed C48, and the tailless 221 mutant (Fig. 1), were analyzed in our previous FPR and BFP studies (Edidin et al., 1994). For the SPT studies reported herein, cells were incubated with mAb 30.5.7 (anti-H-2Ld)-coated 40-nm gold particles as described in Materials and Methods. Electron microscopic analysis showed that under our conditions of incubation each cell had ∼100 mAb 30.5.7-coated gold particles bound to it and that most of the bound gold occurred as single particles and not as aggregates (data not shown). Addition of excess unconjugated mAb 30.5.7 abolished binding of the gold particles, whereas addition of excess amounts of antibodies specific for other class I MHC molecules did not (data not shown), demonstrating the specificity of binding of antibody-coated gold to cells. A total of 404 experimental particles were tracked for the results described herein.
FIGURE 1.
Cytoplasmic tail mutants of the H-2Ld class I MHC molecule examined in this study. H-2Ld variants were generated as described in Materials and Methods and in previous publications (Zúñiga and Hood, 1986; Zúñiga et al., 1983). The ectodomains are depicted in a ribbon model of the class I MHC molecule associated with the β2-microglobulin light chain, as predicted from structural studies (Speir et al., 1998). The hydrophobic membrane spanning region of the H-2Ld molecule is depicted as a helical structure. The cytoplasmic tail sequence of each of the seven H-2Ld mutants is provided in single letter code in its entirety. In the case of WT H-2Ld, only the first 12 residues of the 31 residue-long cytoplasmic tail are shown.
Cytoplasmic tail length and sequence both affect class I MHC mobility on the cell membrane
The diffusion of four of the H-2Ld variants (WT, 911, C48, and 221) has been analyzed previously either by FPR, BFP, or both (Edidin and Zúñiga, 1984; Edidin et al., 1994). The scale of the measurements is similar for BFP and SPT experiments (on the order of a few μ2; Edidin et al., 1994). The median Dmicro values for the eight H-2Ld variants are shown in Fig. 2 A, and the histograms of the Dmicro values obtained for individual variants are displayed in Fig. 2, B–I, whereas the Dmicro values for 50 simulated random walks (a number comparable to the average number of experimental particles per H-2Ld variant) are displayed in Fig. 2 J. The arrow in each of B–J of Fig. 2 indicates the position of the mean Dmicro, the value of which and its SE are also provided above the arrow. The individual Dmicro values for simulated random walks fall into a relatively tight Gaussian distribution (Fig. 2 J), whereas those of the various eight H-2Ld variants are generally more heterogeneous (Fig. 2, B–I). Only the Z4 mutant has a smaller median Dmicro value than does the wild-type H-2Ld (Fig. 2 A). The narrowest range of Dmicro values was obtained for the Z4 H-2Ld mutant with a cytoplasmic tail sequence of KRRRNTE (Fig. 2 I), whereas the Z3 mutant, having the cytoplasmic tail sequence KRRNTEE, has the broadest range of Dmicro (Fig. 2 F). These differences are reflected in the SEs of the mean for these two variants (Fig. 2, F and I). Broad distributions of Dmicro values also have been reported in SPT studies on other cell-surface glycoproteins (Kusumi et al., 1993; Sako and Kusumi, 1994). The broad distributions of Dmicro obtained for all of the H-2Ld mutants are most consistent with a heterogeneous membrane structure with a wide distribution of what Saxton refers to as well depths (Saxton, 1997).
Diffusional modes of H-2Ld variants vary with cytoplasmic tail length and composition
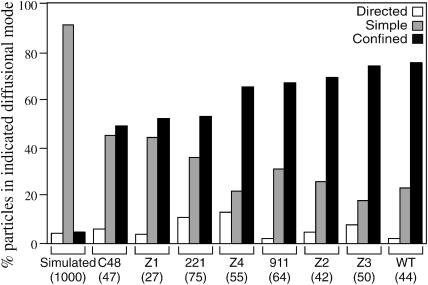
To determine if changes in the cytoplasmic tail affect the diffusional mode of the H-2Ld molecule, we used the mathematical methods that have been applied to analyze single particle tracking data of other membrane glycoproteins (Kusumi et al., 1993). As discussed in Materials and Methods, the value for the RD from predicted simple diffusion allows an assignment of diffusional mode. RD values, calculated for the entire set of 404 particles, are summarized in Fig. 3. Immobile particles were not tracked in this study. For comparison the same type of analysis was performed on 1000 simulated random walks tracked for a fixed time of 1000 33-ms frames (Fig. 3). As expected, the vast majority (91%) of the simulated random walks exhibited simple diffusion, whereas only 4.2% and 5%, respectively, exhibited directed and confined diffusion (Fig. 3). In agreement with our earlier BFP and FPR studies (Edidin and Zúñiga, 1984; Edidin et al., 1994), the RD data indicate that the WT H-2Ld and the 911 mutant have a more restricted mobility than does either the C48 or the tailless 221 H-2Ld variant. Thus, whereas 75% of the WT H-2Ld and 67% of the 911 mutant particles have RD values consistent with confined diffusion, only 49% of C48 particles and 53% of the 221 particles exhibit confined diffusion (Fig. 3). These new studies go beyond our earlier observations by showing that the proportion of particles that exhibit a particular diffusional mode is affected by tail length. For example, the C48 mutant (cytoplasmic tail sequence = KRSE) and Z1 mutant (cytoplasmic tail sequence = KRRR) have the highest proportion of particles exhibiting simple diffusion (45 and 44%, respectively; Fig. 3). Interestingly, the tailless 221 mutant has a lower frequency of particles exhibiting simple diffusion (36%) than do these two four-residue tailed variants (Fig. 3). Conversely, the three new seven-residue cytoplasmic tail mutants (Z2, Z3, and Z4) have approximately the same proportion of particles with confined diffusion as do the WT and 911 mutants (Z2 = 69%, Z3 = 74%, and Z4 = 65%; Fig. 3). Truncation of the cytoplasmic tail also affects the incidence of directed diffusion, but not in a straightforward manner. Thus, the 221 tailless mutant, the Z4 mutant (cytoplasmic tail = KRRRNTE), and the Z3 mutant (cytoplasmic tail = KRRNTEE) have 11%, 13%, and 8% of particles exhibiting directed diffusion (Fig. 3). The proportions of particles whose RD values are consistent with directed diffusion for the other mutants are similar to that observed for the simulated random walks (Fig. 3). In summary, these SPT studies support our previous conclusion that truncation of the cytoplasmic tail of the H-2Ld class I MHC molecule to four residues or fewer relieves constraints on its lateral mobility, whereas truncation to seven residues does not have such an effect (Edidin et al., 1994).
FIGURE 3.
Diffusional modes of the eight H-2Ld variants and of 1000 simulated random walks. The modes of particle diffusion were determined by applying the methods of Kusumi (Kusumi et al., 1993) over the entire trajectory of each of a total of 404 experimental particles and 1000 simulated random walks as described in Materials and Methods. The percentage of particles for the simulated random walks and for any given H-2Ld variant exhibiting a particular diffusional mode is shown, with the open bars representing directed diffusion, the shaded bars representing simple diffusion, and the solid bars representing confined diffusion. The data are grouped by variant type, the name of which is indicated below, with the total number of particles analyzed for each variant given in parentheses below the name of the variant.
Detailed trajectory analysis of H-2Ld variants allows identification of distinct diffusional modes within a single trajectory
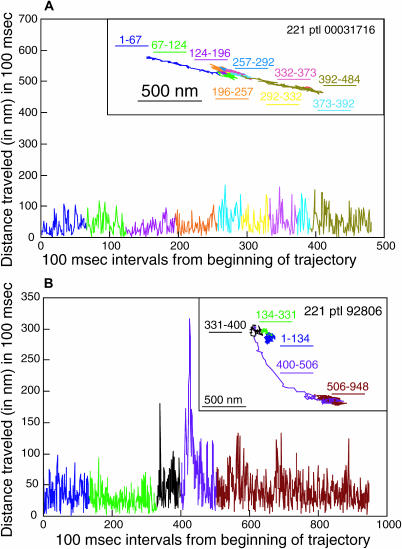
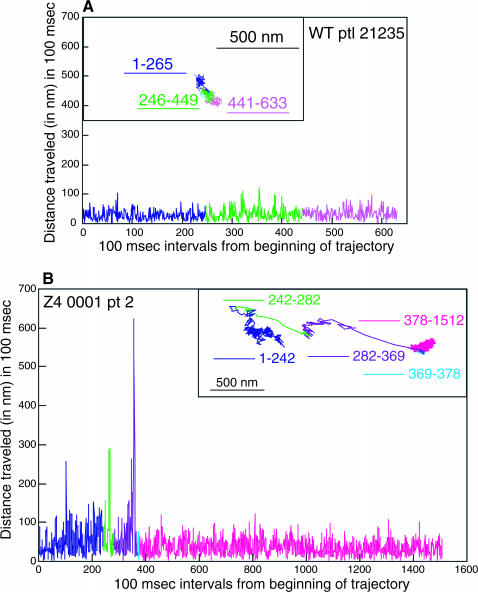
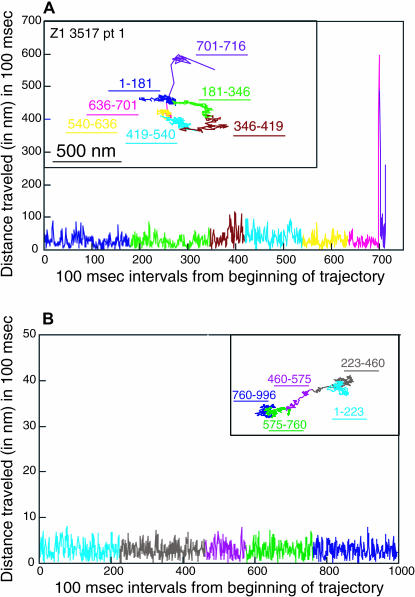
Sample trajectories for the eight H-2Ld variants are shown in Figs. 4–7. All three types of diffusional mode are represented in these figures. The 221 and the Z4 particle trajectories shown in the insets in Figs. 4 B and Fig. 5 B, respectively, have RD values consistent with directed diffusion. The 221 particle trajectory shown in the inset in Fig. 4 A, the WT particle trajectory in the inset of Fig. 5 A and the Z1, C48, 911, Z2, and Z3 particle trajectories shown in Figs. 6 A (inset) and 7, A (inset) and C–E, respectively, all have RD values consistent with confined diffusion. Finally, the WT particle trajectory in inset in Fig. 7 B and the simulated particle trajectory in the inset in Fig. 6 B have RD values consistent with simple diffusion. The 500-nm scale bar provides a measure of the variation in the area explored by each of the particles in Figs. 4, A and B, 5, A and B, 6 A, and 7, A–E.
FIGURE 4.
Comparison of the trajectories of two 221 particles that appear to exhibit different types of directed diffusion. The distance traveled in 100-ms time intervals across the entire trajectory shown in the inset is plotted. The time frame is shown on the abscissa and the distance traveled (in nanometers) is shown on the ordinate. RD analysis assigned the particle in A a confined diffusional mode and that in B a directed diffusional mode. The constant drift velocity of the particle shown in A is 81 nm/s. The relative sizes of the two plots in A and B can be compared by virtue of the 500-nm scale bar.
FIGURE 5.
Examples of a WT particle assigned a confined diffusional mode (A) and a Z4 particle assigned a directed diffusional mode (B) by RD analysis. The insets show the trajectories. In the larger graph the distance traveled in 100-ms time intervals across the entire trajectory is plotted, with the time frame on the abscissa and the distance traveled (in nanometers) on the ordinate. The relative sizes of the two plots in A and B can be compared by virtue of the 500-nm scale bar.
FIGURE 6.
Dissection of a Z1 trajectory and a simulated random walk. The distance traveled in 100-ms time intervals across the entire trajectory is plotted for a Z1 particle whose RD predicts confined diffusion (A) and for a simulated random walk (B). The time frame is shown on the abscissa and the distance traveled (in nanometers) is shown on the ordinate. The random walk shown in B was the one example out of a set of 50 that exhibited the least random-appearing behavior, although it did have an RD consistent with simple diffusion (RD = 1.01). A scale bar of 500 nm is shown for the Z1 particle.
Figs. 4–7 show that the particle trajectories of the H-2Ld variants are complex. To resolve this complexity we traced the particle trajectories from beginning to end and dissected them into individual segments. To do this we first analyzed the distance traveled by particles over various time increments. We found that a time interval of 100 ms (i.e., three frames of 33 ms each) afforded the best distinction between actual x-y displacement and noise. Next we plotted the distances in the x and y directions for 100-ms time intervals across the entire trajectory of a particle. This analysis was applied to 160 experimental particles (40% of the entire data set). Graphic representations of the 100-ms intervals across individual trajectories for the seven particles mentioned above are shown in Figs. 4–7. The 221, Z4, Z1, and C48 particles shown in Figs. 4, A and B, 5 B, 6 A, and 7 A, respectively, are representative of particles whose trajectories have short stretches of dramatic change in the distance traveled in 100 ms. Similarly, the trajectory of the Z3 particle shown in Fig. 7 E has a sharp increase in the 100-ms step size at the very end of the observation period (100-ms step data not shown, but corresponding to the portion of the trajectory labeled 881–909). The use of different colors for different segments of the trajectory and of the same color for the corresponding region of the profile of distance traveled in 100 ms allows one to see that the sharp increase in jump size corresponds to a relatively extended segment in the trajectory (Figs. 4, A and B, 5 B, and 6 A). The C48 particle shown in Fig. 7 A also has at least two sharp jumps, one near the beginning of the trajectory and a second at the end of the trajectory. For comparison we show the 100-ms step profiles of a WT particle whose RD is consistent with confined diffusion (Fig. 5 A), a WT particle whose RD is consistent with simple diffusion (Fig. 7 B), and a trajectory of the one random walk in our collection of 50 random walks that, by visual inspection, looked most directed in its diffusion (Fig. 6 B). None of the 50 simulated random walks that were examined by this analysis had jump sizes of the type observed for the particles whose trajectories are shown in Figs. 4, A and B, 5 B, 6 A, and 7 A (data not shown). Taken together, the data in Figs. 4–7 indicate that the changes in jump size observed in individual trajectories can reflect changes in diffusional mode rather than the stochastic fluctuations inherent to random walks. Thus, these methods of trajectory dissection provide a powerful means of analyzing complex trajectories.
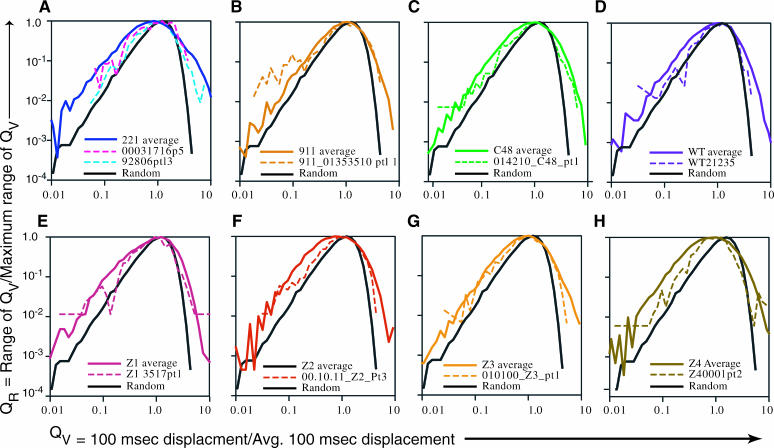
To gain a quantitative assessment of the behavior of each of the eight H-2Ld variants the 100-ms step size analysis was applied to 50 simulated particles and to 240 experimental particles (∼30 trajectories each of the eight H-2Ld variants). We calculated a quotient, QT, which is the displacement in 100 ms for a given variant divided by the average 100-ms step size of that trajectory (see Materials and Methods). The QT data are displayed as a plot of the 33-ms time increments (for the indicated number of particles) on the abscissa and QT on the ordinate. These data are displayed in Fig. 8, A–I. This allows us to determine if differences in peak amplitude in the 100-ms step size analysis shown in Figs. 4–7 are due to fluctuations inherent in random walks and also to compare in a single figure the data for all of the eight H-2Ld variants. (Note that these are line graphs, not histograms. In this regard this analysis differs from that of Cherry and his colleagues (Smith et al., 1999), who have used distance histograms to create a probability-dependent curve-defining D.) The mean 100-ms jump size ± SE of the mean for the 50 simulated random walks is shown as a red line on each of the plots for the simulated random walks (Fig. 8 A) and for the eight H-2Ld variants (Fig. 8, B–I). A–I in Fig. 8 are drawn to the same scale, but the abscissa is not the same length for all of the panels because, with the exception of the random walks, the various particle trajectories are of different lengths. The data obtained from this analysis indicate that there is greater variation in step size for all of the eight H-2Ld variants than there is for the simulated random walks and that this variation is both for step sizes larger than average and for step size smaller than average. The larger step sizes are readily apparent in the displays shown in Fig. 8, A–I. However, the smaller step sizes are not evident in these plots because the data for multiple particles are superimposed so that small steps are hidden by large steps. Thus, for example, QT values smaller than 1 cannot be seen in any of the plots shown in Fig. 8, A–I. To address this problem we calculated two other quotients, QV, which is the ratio of displacement in 100 ms for a variant divided by the average distance traveled in 100 ms by all particles of that variant, and QR, which is the range of QV for a variant divided by the maximal range of QV. The derivation of these values and the rationale for this approach is presented in Materials and Methods. A plot of QR versus QV for all of the variants and for the simulated random walks is shown in Fig. 8 K. This treatment allows a comparison of step size variation of all of the H-2Ld variants to the step size variation of simulated random walks. The 8 H-2Ld variants and the simulated random walks all have most of their QV values at or near 1 because of the way in which QV is defined (see Materials and Methods). However, in comparison to simulated random walks all of the H-2Ld variants have QV values that deviate more from the average (both in the larger and smaller step sizes). This indicates that the experimental particles have a larger percentage of step sizes that deviate from the average step size than is the case for the random walks. Consistent with this are the mean displacement values for the eight H-2Ld variants (Fig. 8 J). For example, it is evident from Fig. 8 C that particles of the 221 variants have large step sizes, and yet the mean displacement value for 221 of 54.2 nm/100 ms (Fig. 8 J) is the second lowest mean displacement observed amongst the 8 H-2Ld variants. We note that there is greater variability at QV values smaller than 0.1 than there is at larger QV values (Fig. 8 K). This may be an artifact resulting from our time resolution of 33 ms. A finer time resolution may allow more precise resolution of the smaller QV values. Nevertheless, this analysis suggests that the trajectories of H-2Ld molecules are characterized by significantly distinct changes in jump size that cannot be accounted for the fluctuations inherent to random walks.
The presentation of data for all of the H-2Ld variants in Fig. 8 K obscures the QV versus QR data for any given variant. We therefore generated separate plots of the QV versus QR data for each of the eight H-2Ld variants (Fig. 9, A–H) and displayed them with the QV versus QR data for the simulated random walks. Also included in these plots are the QV versus QR data for the individual particle trajectories shown in A and B of Figs. 4–7, thus allowing a visualization of the frequency of larger and smaller step sizes occurring in a given trajectory relative to the entire population of particles analyzed for that variant and relative to simulated random walks. This analysis shows that individual experimental particles take step sizes that are both larger and smaller than those observed for the average step sizes of simulated random walks and that also can be larger or smaller than the average step sizes for the population of particles of that given H-2Ld variant.
FIGURE 9.
Visualization of the 100-ms steps sizes of individual trajectories of an H-2Ld variant as compared to the average 100-ms step sizes for the population as a whole and for simulated random walks. QV represents the quotient of each 100-ms step of a given H-2Ld variant divided by that variant's average 100-ms step size. QR is the quotient of the number of 100-ms steps with a given QV divided by the number of steps that fell within the RMAX range. These QV versus QR plots are made in the same manner as the plot shown in Fig. 8 K, but here an individual plot is shown for each of the variant types. The data for 50 simulated random walks are depicted by the solid black line in each panel. The trajectories of the particles analyzed herein are represented in Figs. 4–7 as follows: dashed red and blue lines in A are in Fig. 4, A and B, respectively; dashed line in B is in Fig. 7 C; dashed line in C is in Fig. 7 A; dashed line in D is in Fig. 5 A; dashed line in E is in Fig. 6 A; dashed line in F is in Fig. 7 D; dashed line in G is in Fig. 7 E; and dashed line in H is in Fig. 5 B. The data for the entire data set for a given H-2Ld variant are in the solid line of the same color as the individual particles, except in the case of 221 (A), in which case the data for the entire 221 data set are depicted by the solid blue line.
DISCUSSION
It is becoming increasingly apparent that the regulation of the diffusion of membrane proteins is complex, being governed by the structure of the membrane itself (including its resident membrane proteins) and by the underlying cytoskeleton (Edidin et al., 1991, 1994; Edidin and Stroynowski, 1991; Sako et al., 1998; Simson et al., 1998; Tomishige et al., 1998). The cytoskeleton may act by direct contact with the cytoplasmic tail or indirectly by constraining the mobility of other membrane proteins that then restrict the mobility of the molecule being studied (Fujiwara et al., 2002). Studies with cytoplasmic tail mutants can inform us of the relative contributions of these various influences on membrane protein diffusion. This study represents the third in a series on the effects of the length and composition of the cytoplasmic tail of the H-2Ld class I MHC molecule on its lateral diffusion on cell membranes. Our previous FPR and BFP measurements showed that the cytoplasmic tail restricts H-2Ld mobility on the membrane (Edidin and Zúñiga, 1984; Edidin et al., 1994), and from these studies we inferred that cytoplasmic tail interactions with the cytoskeletal matrix restrict the molecule's lateral diffusion in the membrane. In this study, we used SPT to analyze the mobility of a larger array of H-2Ld cytoplasmic tail mutants. Analysis of Dmicro and RD values of 404 particles revealed that H-2Ld variants with seven-residue cytoplasmic tails are similar to WT H-2Ld (31-residue cytoplasmic tail) in their diffusional characteristics, whereas the H-2Ld variants with zero- or four-residue cytoplasmic tails have a lower proportion of particles exhibiting confined diffusion and more particles exhibiting simple diffusion.
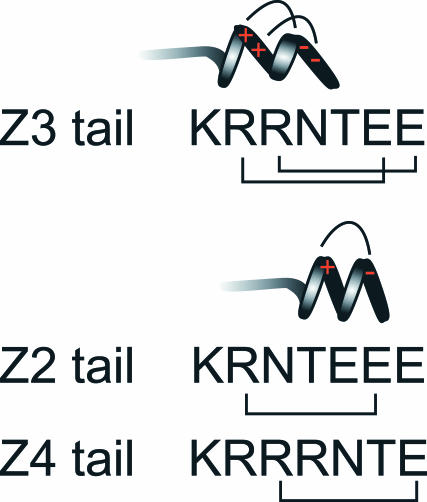
We previously suggested that a more restricted mobility of H-2Ld bearing a seven-residue cytoplasmic tail was consistent with such a tail being long enough to encounter the submembrane skeleton (Edidin et al., 1994). However, charged amino acids could participate in electrostatic interactions. Alternatively, these residues may affect the secondary structure of a short cytoplasmic tail. For example, circular dichroism studies have shown that short synthetic peptides can assume α-helical structures of varying stability. The peptides ETGTKAELLAKYEATHK (i, i + 4 peptide) and ETGKTAELLKAYEATHK (i, i + 3 peptide) can form an α-helix that is stabilized by salt bridges between the K and E residues (Huyghues-Despointes et al., 1993a,b; Zhou et al., 1994) with the charged groups spiraling around the surface of the helix. The i, i + 4 peptide is more stable than is the i, i + 3 peptide (Huyghues-Despointes et al., 1993b). Bearing these observations in mind it is interesting to note the spacing of K and E residues in the Z2, Z3, and Z4 cytoplasmic tails. Two i, i + 4 salt bridges can be formed in the Z3 cytoplasmic tail, whereas one i, i + 4 salt bridge can form in the cytoplasmic tails of Z2 and Z4 (Fig. 10). These salt bridges would be predicted to stabilize an α-helical structure (Olson et al., 2001), which could be an extension of the α-helix formed by the transmembrane segment, perhaps increasing encounters with the cytoskeleton. Indeed, the Z3 mutant, with two potential salt bridges, has a lower proportion of particles exhibiting simple diffusion than do the Z2 and Z4 mutants, and these two variants have a lower proportion of particles exhibiting simple diffusion than does the 911 variant, whose seven-residue cytoplasmic tail lacks acidic residues. Although the cytoplasmic tail of WT H-2Ld is longer than that of the Z3 mutant, it does not have suitably placed lysine and glutamic acid residues. A lysine and aspartic acid are suitably spaced to form a salt bridge, but these are separated by two glycines (Fig. 1), which have been shown to be strong helix breakers (Chakrabartty et al., 1994, 1991). Hence, the cytoplasmic tail of the WT H-2Ld may be less rigid a structure than that of Z3. Moreover, given the differences in the lengths of the Z3 and WT H-2Ld cytoplasmic tails, the arbiters of their mobility may be different. This is suggested by the fact that 8% of Z3 particles exhibit directed diffusion (Fig. 3), whereas an insignificant fraction (3%) of WT H-2Ld particles exhibit directed diffusion.
FIGURE 10.
A possible explanation for differences in the diffusion properties of the Z2, Z3, and Z4 mutants of H-2Ld. Salt bridges stabilize an α-helix between a glutamic acid and an arginine, which are separated from each other by three residues (the so-called i, i + 4 salt bridge). This extends the α-helical structure of the membrane-spanning region further into the cytoplasm. The arginine and glutamic acid residues in the Z3 cytoplasmic tail (KRRNTEE) are spaced such that two i, i + 4 salt bridges can form. In contrast, only one i, i + 4 salt bridge can form in the cytoplasmic tails of the Z2 (KRNTEEE) and Z4 (KRRRNTE) mutants.
H-2Ld variants with four-residue cytoplasmic tails (C48 and Z1) exhibit the lowest proportion of confined diffusion, even less than that of tailless H-2Ld. In fact, Z1 particles are even more mobile than these data indicate. Many of the rapidly moving Z1 particles being tracked came too close to another particle for the tracking software to distinguish between the two, leading to a loss of the data on those particles. This result suggests that susceptibility of the C48, Z1, and 221 (tailless) mutants to confinement is not governed exclusively by mechanical confinement by the membrane skeleton (Sako et al., 1998) and/or membrane pickets (Fujiwara et al., 2002), but rather that electrostatic interactions can also influence diffusion in the membrane.
A significant proportion (11%) of particles of the tailless 221 variant exhibit directed diffusion. Dissection of individual trajectories revealed that for some of these particles the directed diffusion is characterized by large 100-ms step sizes (Fig. 4 B), as might be expected. However, the trajectories of several of the tailless 221 particles that exhibit directed diffusion (typified by the trajectory shown in Fig. 4 A) are characterized by small 100-ms step sizes. (A few trajectories exhibiting this type of diffusion also are observed for the C48 mutant.) RD analysis assigns a confined diffusional mode to particles of this trajectory type, and thus it is likely that the proportion of 221 particles exhibiting directed diffusion is likely to be greater than 11%. These trajectories are reminiscent of a type of diffusional behavior reported previously by Sheetz (Sheetz et al., 1989) and Kusumi and his colleagues (Kusumi et al., 1993; Sako et al., 1998). The velocity of these particles (52–97 nm/s) is too great to be accounted for by membrane flow (Sheetz et al., 1989) and is 2–3 times greater than that reported by others for molecules that are attached to the underlying actin cytoskeleton (Kusumi et al., 1993; Sako et al., 1998; Sheetz et al., 1989). The lack of a cytoplasmic tail on the 221 mutant suggests that any involvement of the actin cytoskeleton in the rapid diffusion of these particles is indirect.
It will be interesting to compare the antigen presenting properties of the various H-2Ld mutants. In preliminary cold target inhibition studies, we observed that cells expressing the 221 mutant are less effective in engaging allogeneic, H-2Ld-specific cytotoxic T-cells than are cells expressing the full length H-2Ld molecule (G. G. Capps and M. C. Zúñiga, unpublished observations). If these observations are borne out, then further analysis of H-2Ld cytoplasmic tail variants may allow an elucidation of the regulated movement via cytoplasmic tail interactions of the class I MHC molecule into a functional immunological synapse.
Acknowledgments
We thank Taiyin Wei, Shane Giles, Michael McCaffery, Andrew Nechkin, and Gerry Sexton for technical assistance, Jesse Haramati, Han Wang, and Qing Tang for assistance with data analysis, Glenn Millhauser for stimulating discussions, and Jesse Haramati and C. Gary Reiness for critical reading of the manuscript. We are indebted to Drs. Akihiro Kusumi and Ken Ritchie for making their Gaussian Random Deviate Generator Program available to us, to Alice Vrelink and Louis Lim for assistance in downloading this program, and to two reviewers for excellent constructive criticism of this manuscript.
This work was supported by National Institutes of Health grants GM58554 to M.E. and AI39055 to M.C.Z.
References
- Chakrabartty, A., T. Kortemme, and R. L. Baldwin. 1994. Helix propensities of the amino acids measured in alanine-based peptides without helix-stabilizing side-chain interactions. Protein Sci. 3:843–852. [DOI] [PMC free article] [PubMed] [Google Scholar]
- Chakrabartty, A., J. A. Schellman, and R. L. Baldwin. 1991. Large differences in the helix propensities of alanine and glycine. Nature. 351:586–588. [DOI] [PubMed] [Google Scholar]
- Davis, D. M. 2002. Assembly of the immunological synapse for T cells and NK cells. Trends Immunol. 23:356–363. [DOI] [PubMed] [Google Scholar]
- Edidin, M. 2001. Shrinking patches and slippery rafts: scales of domains in the plasma membrane. Trends Cell Biol. 11:492–496. [DOI] [PubMed] [Google Scholar]
- Edidin, M., S. C. Kuo, and M. P. Sheetz. 1991. Lateral movements of membrane glycoproteins restricted by dynamic cytoplasmic barriers. Science. 254:1379–1382. [DOI] [PubMed] [Google Scholar]
- Edidin, M., and I. Stroynowski. 1991. Differences between the lateral organization of conventional and inositol phospholipid-anchored membrane proteins. A further definition of micrometer scale membrane domains. J. Cell Biol. 112:1143–1150. [DOI] [PMC free article] [PubMed] [Google Scholar]
- Edidin, M., and M. Zúñiga. 1984. Lateral diffusion of wild-type and mutant Ld antigens in L cells. J. Cell Biol. 99:2333–2335. [DOI] [PMC free article] [PubMed] [Google Scholar]
- Edidin, M., M. C. Zúñiga, and M. P. Sheetz. 1994. Truncation mutants define and locate cytoplasmic barriers to lateral mobility of membrane glycoproteins. Proc. Natl. Acad. Sci. USA. 91:3378–3382. [DOI] [PMC free article] [PubMed] [Google Scholar]
- Fassett, M. S., D. M. Davis, M. M. Valter, G. B. Cohen, and J. L. Strominger. 2001. Signaling at the inhibitory natural killer cell immune synapse regulates lipid raft polarization but not class I MHC clustering. Proc. Natl. Acad. Sci. USA. 98:14547–14552. [DOI] [PMC free article] [PubMed] [Google Scholar]
- Fujiwara, T., K. Ritchie, H. Murakoshi, K. Jacobson, and A. Kusumi. 2002. Phospholipids undergo hop diffusion in compartmentalized cell membrane. J. Cell Biol. 157:1071–1081. [DOI] [PMC free article] [PubMed] [Google Scholar]
- Georgiou, G., S. S. Bahra, A. R. Mackie, C. A. Wolfe, P. O'Shea, S. Ladha, N. Fernandez, and R. J. Cherry. 2002. Measurement of the lateral diffusion of human MHC class I molecules on HeLa cells by fluorescence recovery after photobleaching using a phycoerythrin probe. Biophys. J. 82:1828–1834. [DOI] [PMC free article] [PubMed] [Google Scholar]
- Huyghues-Despointes, B. M., J. M. Scholtz, and R. L. Baldwin. 1993a. Effect of a single aspartate on helix stability at different positions in a neutral alanine-based peptide. Protein Sci. 2:1604–1611. [DOI] [PMC free article] [PubMed] [Google Scholar]
- Huyghues-Despointes, B. M., J. M. Scholtz, and R. L. Baldwin. 1993b. Helical peptides with three pairs of Asp-Arg and Glu-Arg residues in different orientations and spacings. Protein Sci. 2:80–85. [DOI] [PMC free article] [PubMed] [Google Scholar]
- Kusumi, A., and Y. Sako. 1996. Cell surface organization by the membrane skeleton. Curr. Opin. Cell Biol. 8:566–574. [DOI] [PubMed] [Google Scholar]
- Kusumi, A., Y. Sako, and M. Yamamoto. 1993. Confined lateral diffusion of membrane receptors as studied by single particle tracking (nanovid microscopy). Effects of calcium-induced differentiation in cultured epithelial cells. Biophys. J. 65:2021–2040. [DOI] [PMC free article] [PubMed] [Google Scholar]
- Martin, D. S., M. B. Forstner, and J. A. Kas. 2002. Apparent subdiffusion inherent to single particle tracking. Biophys. J. 83:2109–2117. [DOI] [PMC free article] [PubMed] [Google Scholar]
- Olson, C. A., E. J. Spek, Z. Shi, A. Vologodskii, and N. R. Kallenbach. 2001. Cooperative helix stabilization by complex Arg-Glu salt bridges. Proteins. 44:123–132. [DOI] [PubMed] [Google Scholar]
- Ozato, K., T. H. Hansen, and D. H. Sachs. 1980. Monoclonal antibodies to mouse MHC antigens. II. Antibodies to the H-2Ld antigen, the products of a third polymorphic locus of the mouse major histocompatibility complex. J. Immunol. 125:2473–2477. [PubMed] [Google Scholar]
- Potter, T. A., K. Grebe, B. Freiberg, and A. Kupfer. 2001. Formation of supramolecular activation clusters on fresh ex vivo CD8+ T cells after engagement of the T cell antigen receptor and CD8 by antigen-presenting cells. Proc. Natl. Acad. Sci. USA. 98:12624–12629. [DOI] [PMC free article] [PubMed] [Google Scholar]
- Sako, Y., and A. Kusumi. 1994. Compartmentalized structure of the plasma membrane for receptor movements as revealed by a nanometer-level motion analysis. J. Cell Biol. 125:1251–1264. [DOI] [PMC free article] [PubMed] [Google Scholar]
- Sako, Y., A. Nagafuchi, S. Tsukita, M. Takeichi, and A. Kusumi. 1998. Cytoplasmic regulation of the movement of E-cadherin on the free cell surface as studied by optical tweezers and single particle tracking: corralling and tethering by the membrane skeleton. J. Cell Biol. 140:1227–1240. [DOI] [PMC free article] [PubMed] [Google Scholar]
- Saxton, M. J. 1995. Single-particle tracking: effects of corrals. Biophys. J. 69:389–398. [DOI] [PMC free article] [PubMed] [Google Scholar]
- Saxton, M. J. 1997. Single-particle tracking: the distribution of diffusion coefficients. Biophys. J. 72:1744–1753. [DOI] [PMC free article] [PubMed] [Google Scholar]
- Saxton, M. J., and K. Jacobson. 1997. Single-particle tracking: applications to membrane dynamics. Annu. Rev. Biophys. Biomol. Struct. 26:373–399. [DOI] [PubMed] [Google Scholar]
- Sheets, E. D., R. Simson, and K. Jacobson. 1995. New insights into membrane dynamics from the analysis of cell surface interactions by physical methods. Curr. Opin. Cell Biol. 7:707–714. [DOI] [PubMed] [Google Scholar]
- Sheetz, M. P., S. Turney, H. Qian, and E. L. Elson. 1989. Nanometre-level analysis demonstrates that lipid flow does not drive membrane glycoprotein movements. Nature. 340:284–288. [DOI] [PubMed] [Google Scholar]
- Simson, R., E. D. Sheets, and K. Jacobson. 1995. Detection of temporary lateral confinement of membrane proteins using single-particle tracking analysis. Biophys. J. 69:989–993. [DOI] [PMC free article] [PubMed] [Google Scholar]
- Simson, R., B. Yang, S. E. Moore, P. Doherty, F. S. Walsh, and K. A. Jacobson. 1998. Structural mosaicism on the submicron scale in the plasma membrane. Biophys. J. 74:297–308. [DOI] [PMC free article] [PubMed] [Google Scholar]
- Smith, K. D., Z. B. Kurago, and C. T. Lutz. 1997. Conformational changes in MHC class I molecules. Antibody, T-cell receptor, and NK cell recognition in an HLA-B7 model system. Immunol. Res. 16:243–259. [DOI] [PubMed] [Google Scholar]
- Smith, P. R., I. E. Morrison, K. M. Wilson, N. Fernandez, and R. J. Cherry. 1999. Anomalous diffusion of major histocompatibility complex class I molecules on HeLa cells determined by single particle tracking. Biophys. J. 76:3331–3344. [DOI] [PMC free article] [PubMed] [Google Scholar]
- Sokal, R. R., and F. J. Rohlf. 1995. Biometry: The Principles and Practices of Statistics in Biological Research. W. H. Freeman and Co., New York.
- Speir, J. A., K. C. Garcia, A. Brunmark, M. Degano, P. A. Peterson, L. Teyton, and I. A. Wilson. 1998. Structural basis of 2C TCR allorecognition of H-2Ld peptide complexes. Immunity. 8:553–562. [DOI] [PubMed] [Google Scholar]
- Tomishige, M., Y. Sako, and A. Kusumi. 1998. Regulation mechanism of the lateral diffusion of band 3 in erythrocyte membranes by the membrane skeleton. J. Cell Biol. 142:989–1000. [DOI] [PMC free article] [PubMed] [Google Scholar]
- Wier, M., and M. Edidin. 1988. Constraint of the translational diffusion of a membrane glycoprotein by its external domains. Science. 242:412–414. [DOI] [PubMed] [Google Scholar]
- Williams, A., C. A. Peh, and T. Elliott. 2002. The cell biology of MHC class I antigen presentation. Tissue Antigens. 59:3–17. [DOI] [PubMed] [Google Scholar]
- Zhou, H. X., P. Lyu, D. E. Wemmer, and N. R. Kallenbach. 1994. Alpha helix capping in synthetic model peptides by reciprocal side chain-main chain interactions: evidence for an N terminal “capping box”. Proteins. 18:1–7. [DOI] [PubMed] [Google Scholar]
- Zúñiga, M. C., and L. E. Hood. 1986. Clonal variation in cell surface display of an H-2 protein lacking a cytoplasmic tail. J. Cell Biol. 102:1–10. [DOI] [PMC free article] [PubMed] [Google Scholar]
- Zúñiga, M. C., B. Malissen, M. Mcmillan, P. R. Brayton, S. S. Clark, J. Forman, and L. Hood. 1983. Expression and function of transplantation antigens with altered or deleted cytoplasmic domains. Cell. 34:535–544. [DOI] [PubMed] [Google Scholar]


