Abstract
The establishment of specific molecular bonds between a cell and a facing surface is involved in many physiological and technological situations. Using micrometric magnetic particles, we have explored the formation of specific molecular bonds between the cell and surfaces bearing complementary ligands under passive conditions. Streptavidin-coated particles were targeted to the cell surface of a B-cell line through a specific biotinylated antibody against the CD19 receptor. Flow cytometry, optical microscopy, and micropipette experimental techniques have been used. Main findings have been that cell surface receptor density acted like a switch for particle capture with a threshold value found here equal to 1.6 × 10³ receptor/μm2. This led to exclusion from binding of the cells of lowest receptor density. The density threshold was modulated by the length of the binding link and the physics of the cell/particle collision. We suggest that the shear stress is one of the main determinants of the characteristics of binding. We also show that several thousand receptors were involved in the cell particle contact at the end of the binding process, although only eight bonds are required for the initial capture of a particle. A passive binding inhibition process due to link concentration by the initial contact was proposed to account for the small number of particles per cell.
INTRODUCTION
Many crucial biological events depend on specific molecular recognition at the cell surface. Significant progress has been made, in the past few years, toward understanding details of refined receptor-ligand interactions in terms of bond formation between a unique site and the complementary molecule (e.g., Helm et al., 1991; Verkhivker et al, 2002; Pierres et al., 2002; Jung et al., 2000). Ever-increasing amounts of structural data (Stuart and Jones, 1995) and the emergence of single molecule approaches have particularly contributed to enlightening the field of molecular recognition (Merkel et al., 1999; Evans, 2001). However, in many instances, the recognition at the cell surface appears to involve much higher complexity through multiple factors such as cell surface composition and architecture, membrane mechanics, receptor dynamics and complexation, connection with the cytoskeleton network, etc. This becomes of most importance when the ligands themselves are presented to another surface, as is the case for many specific cell interactions such as those of cells in tissues (Gumbiner, 1996) or in immunological complexes such as those formed by T cells and antigen-presenting cells (van der Merwe, 2002). It now clearly appears that cell interactions engage molecular assemblies rather than unique ligand-receptor interaction (Hutchinson et al., 2003). Moreover, the cell surface is covered by the glycocalix—a hydrophilic, negatively charged, carbohydrate polymer layer whose thickness can reach up to several tens of nanometers depending on cell type (Braun and Fromherz, 1998). It very likely supports a steric repulsive barrier that avoids interactions with interfaces lacking specific complementary ligands or a sufficient number of positive charges (Chenevier et al., 2000; Ravaine et al., 2002). This surrounding layer actually creates a surface force field that superimposes the net receptor-ligand binding potential. Because of the high heterogeneity of the cell surface, this potential cannot be described by using the theoretical Derjaguin-Landau-Verwey-Overbeek approach or measured using surface-force techniques, as has been achieved with model surfaces (e.g., Leckband et al., 1994; Wong et al., 1997).
In this article, we report an experimental approach aimed to evidence a few consequences of the complex biological environment offered at the cell surface, on the formation of a well-known key-lock molecular link, the streptavidin-biotin bond. We depict the association characteristics of model macroscopic objects, constituted by streptavidin-covered micrometric beads, with the surface of a B-cell line. We chose to target the CD19 receptor, a B-cell-specific transmembrane glycoprotein of 80 kDa, which is involved in the MHC class II signaling complex (e.g., Lévéille et al., 2002; Bradbury et al., 1993) and the interaction with T cells. The link with streptavidin-covered particles is established through a biotinylated antibody specific for the CD19 receptor. The cell-to-particle binding was analyzed using a flow cytometry technique that allowed statistic and quantitative measurements of the association parameters, in parallel with optical microscopy and micropipette experiments that allowed evaluation of the characteristics of individual events. We found that the binding at the cell surface obeyed a receptor density threshold that depended both on the accessibility of the receptor within the surface layer and on the mechanics of the collision between the hard sphere and the soft material of the cell surface. We also evidenced that in the final stage of the particle adhesion on the cell surface, several thousand links were engaged in the cell-to-particle contact. The obtained results supported the idea of a collective, dynamic binding mechanism, which will be discussed. Above the better understanding of the mechanism of interaction, the question of the molecular recognition at the cell surface is also crucial in more applied situations involving protein-coated synthetic implants or in cell-sorting processes using specific colloids to select a cell subpopulation identified by a surface marker. This will be also considered in light of our results.
MATERIALS AND METHODS
Reagents and particles
Streptavidin and biotin, conjugated both with and without fluorescein, were supplied by Molecular Probes (Eugene, OR). Antibodies, anti-CD19 purified or FITC- or biotin-conjugated, were from BD Biosciences Pharmingen (San Diego, CA) and anti-cytokeratine-FITC was from Miltenyi Biotec (Bergisch Gladbach, Germany). Magnetic latex particles were 2.8-μm diameter, purchased from Dynal (Compiègne, France), either functionalized with carboxylic acid groups or grafted with streptavidin.
Cell culture and labeling
The B-cell lymphoma cell line, line Bernard (LB), EBV-transformed, was a gift from J. Dechanet-Merville (UMR CNRS 5540, Université Bordeaux II, Bordeaux, France). Cells were cultured suspended in Dulbecco's Modified Eagle Medium supplemented with 10% fetal calf serum, 2 mM L-glutamine, 50 U/ml streptomycin, at 37°C in 5% CO2. For particle-binding experiments, the cells were labeled with biotinylated anti-CD19 as follows. The whole procedure was carried out in ice; cells from an exponentially growing culture were washed with PBS and their concentration adjusted to 5 × 10⁶ cells/ml, then incubated with the antibody above saturating concentration (4 μg/ml) for 1 h and washed twice in PBS to remove biotinylated antibody excess. The cells were then ready to be put in contact with streptavidin particles. Titrations with anti-CD19-FITC or anti-cytokeratin-FITC were performed in the same conditions. When required and as stated below, PBS was added with 0.1% sodium azide.
Cell-particle contact
Cells were put into contact at time (t) = 0 by gentle mixing in a tube of 2 ml of cell suspension adjusted at the desired concentration with a few microliters of the particle suspension. To ensure proper mixing of the samples all along the interaction process, the tubes containing the cell-particle suspensions were placed on the radii of a rotating disk spinning at 5 rpm, either at 4°C or ambient temperature. This stirring was interrupted only to carry out regular 10-s flow cytometry acquisitions.
Flow cytometry
Flow cytometry data were acquired using a FACScan (Becton Dickinson, Le Pont de Claix, France) equipped with an air-cooled 488-nm argon-ion laser. Fluorescence measurements were collected using dichroic mirrors and filter sets: a 530/30-nm bandpass on the FL1 channel and a 650-nm longpass on the FL3 channel. Ten-thousand events were the typical number collected, except for the most diluted samples, where only 2000 events were acquired to maintain short time resolution for each sample. Data were analyzed using the multivariate analysis software CellQuest (BD Biosciences, San Diego, CA), except in a few cases where more detailed analysis was performed on list-mode data files stored in flow cytometry standard (FCS) format.
Fluorescence absolute calibration was performed using the following autocalibration method: α, the coefficient giving the proportionality between the mean fluorescence provided by the cytometer photomultiplier and the amount of fluorescent-bound molecules per cell, was obtained directly from the slope of the titration curve giving the fluorescence per cell as a function of increasing fluorescent ligand concentration in the initial linear part. Indeed, for high affinities, the amount of free ligand may be neglected when ligand concentration is low and receptors are in excess. The amount of complex is then very closely equal to the total amount of ligand. In the range-of-affinity constant expected for the binding of an antibody to its receptor, this consisted of a maximum approximation of 1% of the signal and avoided all the drawbacks related to calibration performed with beads having different optical properties than cells.
Binding equilibrium analysis
Equilibrium data were analyzed according to the following Scatchard-like method, wherein the binding affinity of a ligand L, for a receptor R, which is present in a mean number of n copies on a cell C, is considered.
This analysis is performed on the basis of a simple binding equilibrium described by the mass action law,
 |
where [R], [L], and [R−L] are the molar concentrations of ligand, receptor, and receptor-ligand complex. [L] and [R] are given by the mass conservation laws,
 |
where [L]tot is the total ligand molar concentration, and it is the experimental variable
 |
 |
where [C] is the cell molar concentration. [R−L] is given by the fluorescence values obtained by flow cytometry (FL) converted according to the autocalibration method with the proportionality factor α,
 |
Then, it becomes
 |
where [L]tot − α × (FL) is plotted as a function of α × (FL) with Ka and n as adjustable parameters. This method was applied to characterize the binding equilibrium of anti-CD19 on its receptor on the B-cell line, and FITC-coupled anti-CD19 was used.
Micropipette experiments
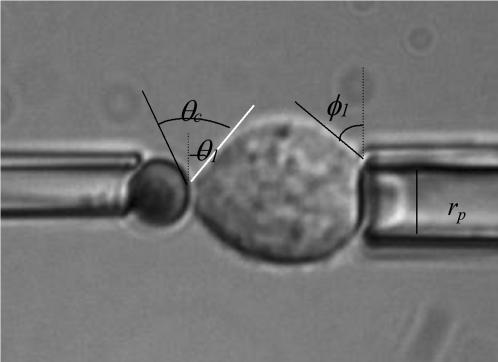
Pipettes with a 0.5–1-μm inner radius, rp, were used to manipulate the cell and the bead. The experimental approach consisted of micromanipulating them to ensure contact and then holding them together for a few seconds to allow bond formation. The pipettes were then moved apart over a few micrometers. During this process, the cell was enduring an axisymmetric stretch. The analysis of the equilibrium geometry allowed us to evaluate the adhesion energy, inasmuch as the local tension γ around the contact line was known. Neglecting the pressure difference between the inside of the cell and the solution, γ can be deduced (Tozeren et al, 1989) from the angle θ1 that the cell makes with the radial direction at the tip of the pipette, as
 |
where ΔP is the aspiration pressure inside the pipette, rc is the contact radius, and φ1 is the angle formed by the cell and the radial direction at particle contact. Assuming adhesion is uniform, the adhesive energy per unit area, wa, is given by Young's equation (Berk and Evans, 1991), as
 |
where θc is the contact angle between the bead and the cell.
RESULTS
CD19 receptors: number, ligand affinity, and distribution
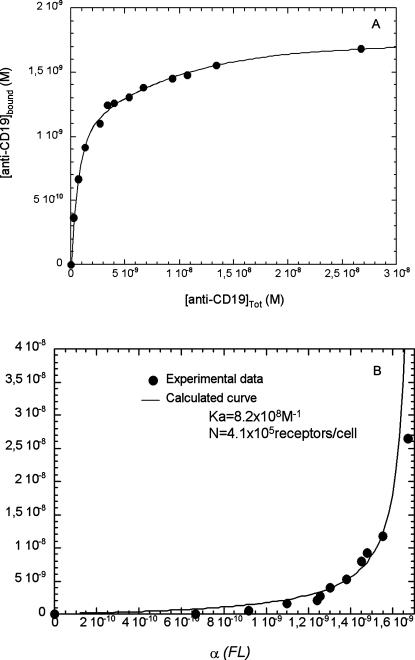
Before entering into the detailed analysis of particle binding, we carried out experiments to precisely quantify the occurrence of the CD19 receptor on the cell surface using FITC-coupled anti-CD19. The equilibrium binding data were collected by incubating a range of anti-CD19–FITC concentrations with the cells and by measuring the fluorescent signal on the flow cytometer. Background due to unspecific binding was evaluated using an anti-cytokeratin-FITC antibody (no receptor on the surface). The data, giving the fluorescence per cell, were converted into bound anti-CD19-FITC according to the autocalibration method explained in Materials and Methods and plotted in Fig. 1 A. Data analysis was performed according to the Scatchard-like method described above. Parameters adjustment (Fig. 1 B) provided a value of (8.2 ± 2) × 108 M−1 for the association constant, Ka, of anti-CD19 with CD19. The number of binding sites was found equal to (4.1 ± 0.9) × 105 per cell.
FIGURE 1.
CD19 receptors titration: the number of CD19 receptors per cell has been determined using increasing concentrations of FITC-labeled anti-CD19 and measuring fluorescence per cell using flow cytometry. The arbitrary values obtained were converted into bound anti-CD19 applying the autocalibration methods described in Materials and Methods and plotted as a function of antibody concentration (A). Experiments were performed at 4°C, in PBS buffer, pH 7.4. Cell concentration for these experiments was equal to 2.5 × 10⁶ cells/ml. Here is a representative experiment of at least three separate titrations. Anti-CD19 binding analysis (B) was performed according to the Scatchard-like method (see Materials and Methods). The adjustment of the experimental points (•) to the analytical formula obtained (—) provided an association constant Ka equal to 8.2 × 10⁸ M−1 and a mean number of sites equal to 4.1 × 10⁵ receptors per cell.
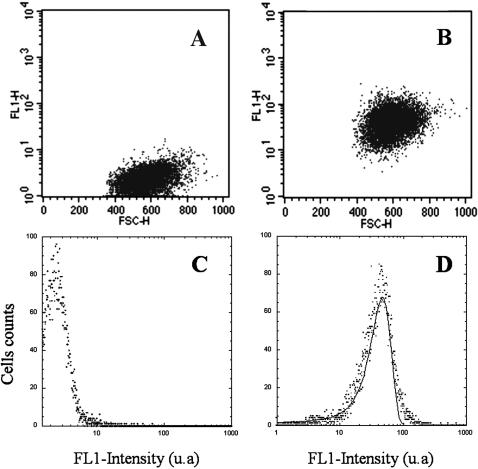
Fig. 2 details the CD19 receptor distribution through the whole cell population. The histogram was acquired in the FL1 channel for a saturating concentration of anti-CD19-FITC. The distribution over the cell population was found to be monomodal, very close to a Gaussian profile with only a slight right skew. The whole distribution (mean fluorescence value = 46) was detached from the background (mean fluorescence value = 2) and the FL1 versus forward-light-scatter dot-plot displayed only one dot cluster, indicating that CD19 protein was present on every cell of the distribution.
FIGURE 2.
Flow cytometry biparametric dot-plots and histograms showing CD19 receptors distribution. LB cells were incubated at 4°C during 1 h with 4 μg/ml FITC-conjugated anti-cytokeratin (A and C) and with FITC-conjugated anti-CD19 (B and D). The fluorescence distribution of the labeled cells clearly displayed only one mode; it has been adjusted to a Gaussian distribution (—) of the form  which provided a mean value of 47.
We also checked using fluorescent streptavidin that these receptors were able to specifically anchor anti-CD19-biotin at the cell surface in a quantitative way. For that, we first incubated cells with saturating concentrations of anti-CD19-biotin at 4°C, washed off antibody excess, and performed the cell-surface cytofluorometric titration of the biotins present using increasing concentrations of streptavidin-FITC. We obtained a mean number of 5 × 10⁵ streptavidin molecules bound per cell, which is close to the number of CD19 receptors measured above, suggesting that, for steric purposes, only one streptavidin was bound per biotinylated antibody fixed on the cell surface.
Cell-particle binding profile: evidence for a subpopulation selection
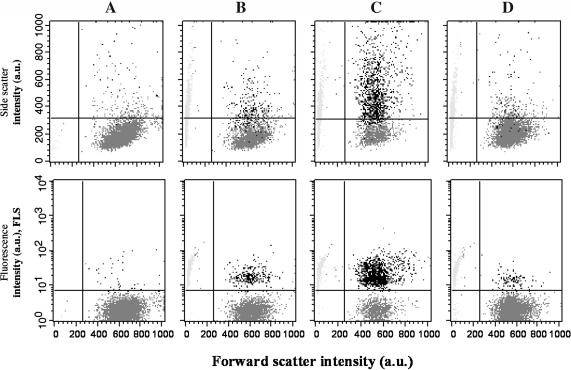
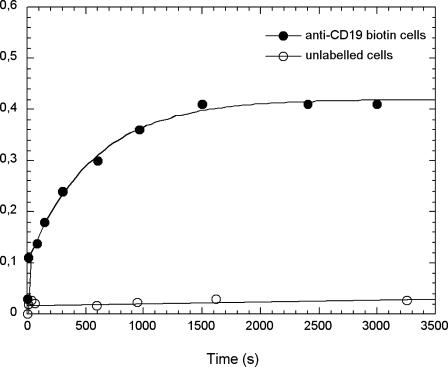
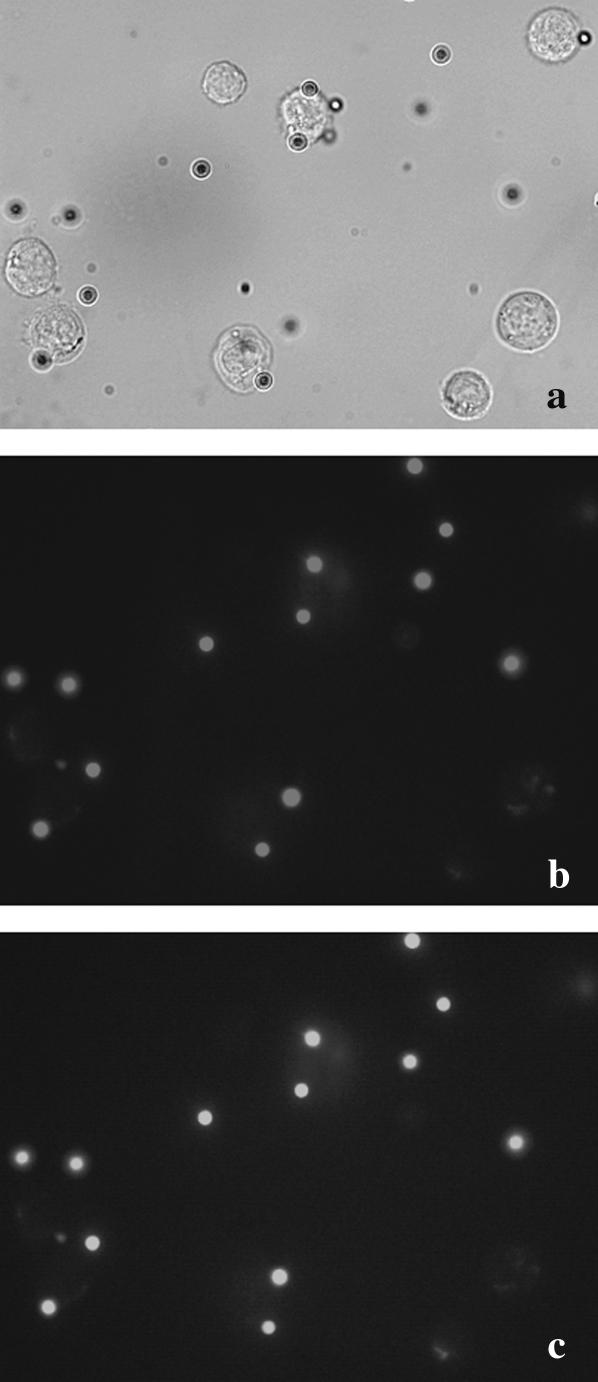
On this basis, our purpose has been to characterize the specific binding on the cell surface of micrometric particles under passive conditions, i.e., low temperature and poor physiological buffer. Cells labeled with biotinylated anti-CD19 were put into contact with streptavidin-grafted particles (t = 0). Immediately 10-s flow cytometry acquisitions were initiated and regularly recorded all along the binding process, providing sequential snapshots of the situation within the cell-particle suspension. Fig. 3 shows the biparametric dot-plots acquired on mixtures of 1.5 × 10⁵ cells/ml and to 1.5 × 10⁶ particles/ml, i.e., 10 particles per cell, at 1 and 30 min of contact, together with the dot-plots acquired before any particle contact and after 30-min contact between unlabeled cells and streptavidin particles. Forward-light scatter (FSC) versus side-light scatter (SSC) and fluorescence emission at the highest wavelength (FL3) are shown. Dead cells and debris were gated out. The dot cluster of the living cells, initially concentrated in the lower-left region of the scatter plot extended toward the region of higher side scatter, revealed the capture of particles by the cells. This particle-bearing cell population was also clearly identified by its higher fluorescence in the FL3 vs. FSC plots. The number of events associated with this cluster increased with time. Control plots did not undergo significant alteration. It can be seen that particle binding onto the cell did not affect their size-related forward-scatter parameter. Unbound particles, at least a fraction, appeared in cytograms at lowest-forward-scatter values as expected from their 2.8-μm diameter. They displayed rather high values of side scatter and FL3, due to their iron oxide payload, which conferred to the particle both a high optical index and a large fluorescence spectrum as confirmed using fluorescence microscopy. Each cytogram also allowed us to discriminate and quantify free particles (small size, high SSC, and FL3), and free cells (defined size and low SSC) from cells having bound particles (same defined size as free cells and increased FL3 and SSC) in any suspension. A crucial point to underline, in these results, was the splitting of the cell population into two classes—cells with bound particles and cells without. The particles actually operated a selection within the cell population, despite the one-mode distribution, in regard to CD19 receptor occurrence for this cell line. In the following, the parameter ƒc, the fraction of cells holding at least one particle, will be used to characterize this selection. On the basis of the fluorescence data, it was determined as the ratio of the events acquired in the upper-left region of the FL3 vs. FSC plot (living cells of higher fluorescence) to the total number of events acquired in both the upper and lower regions (all living cells). The number of events comprised in the upper-left region at t = 0 constituted the background and was subtracted from all numbers. Fig. 4 shows the evolution of the fraction ƒc as a function of time of cell/particle contact. Obviously, the fraction of cells having bound particles reached a plateau value equal to 0.4 after 30 min of cell/particle contact. At this plateau, using optical microscope observations, we checked that the samples still exhibited significant amounts of free cells and free particles together with cells having bound particles (Fig. 5).
FIGURE 3.
Scattering (upper frames) and fluorescence (lower frames) biparametric dot-plots of interacting particles and cells. 1.5 × 10⁵/ml LB cells were labeled (A, B, C) or not (D) with biotinylated anti-CD19 and put into contact with 1.5 × 10⁶/ml streptavidin-coated particles. Flow cytometry data were acquired at various times after particle contact; (A) t = 0, (B) t = 1 min, and (C and D) t = 30 min. Incubation was performed at 4°C, measurements at 20°C, all in PBS buffer, pH 7.4.
FIGURE 4.
Cells and particles interaction kinetic profile. The ratio of the number of cells having acquired enhanced fluorescence, i.e., located in the upper quadrant of the FL3 dot-plot (see Fig. 3), to the total number of living cells has been plotted as a function of time of contact with the particles. Cells had previously been labeled (•) or not (○) with biotinylated anti-CD19. Same experimental conditions as in Fig. 3.
FIGURE 5.
Optical (a) and fluorescence microscopy (b and c) pictures of labeled cells and particles sample. Fluorescence images of particles were recorded under epifluorescence lightening using a FITC (b) or a rhodamine (c) filter setup, showing the large spectra of the particles' fluorescence.
At this point, two parameters were retained to describe this specific cell/particle binding profile: 1), the value ƒc, the fraction of captured cells when the binding is achieved (i.e., binding plateau), and 2), the apparent characteristic time τ (i.e., the time to reach a fraction of captured cells equal to  ). In the previous experimental conditions (1.5 × 10⁵ cells/ml; 1.5 × 10⁶ particles/ml; 5 rpm stirring; standard molecular link), we found ƒc = 0.42 and τ = 210 s.
Density threshold
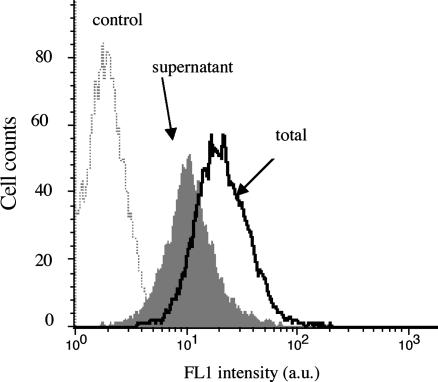
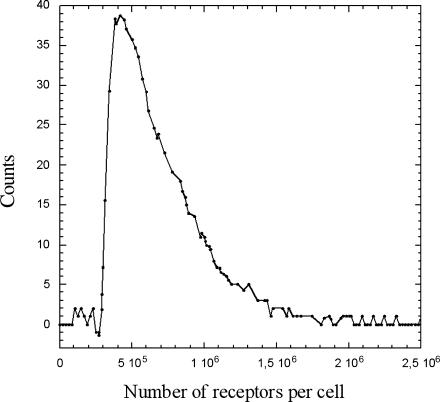
We then aimed to gain more insight into the understanding of the binding profile and focused our interest on the origin of the selection operated by the particles within the cell population. We took advantage of the paramagnetic properties of the particles used in this study to physically separate cells that were without particles from cells with at least one particle under a magnetic field gradient. The streptavidin-binding sites of the particle-free cells were then probed on the flow cytometer using streptavidin-FITC. Fig. 6 shows the fluorescence distribution obtained on these particle-free cells together with the distribution acquired on the initial whole-cell population before any contact with particles. It appeared that those cells (which did not capture particles) displayed a binding-sites distribution that was shifted to the lower values, indicating a lower binding-site density exposed on the cell surface by these cells (Table 1). The histograms were converted into number of binding sites per cell and normalized to the same number of cells. The particle-free cell distribution was then multiplied by 0.6 to account for the fraction of discriminated cells previously measured by flow cytometry. This fraction was also corroborated by the results of the magnetic separation, which gave 43 ± 3% of cells in the pellet and 57 ± 2% of cells remaining in the supernatant. We then subtracted the calculated histogram from the histogram of the entire population. The result is shown in Fig. 7. The ascending part of the curve gives the surface density cutoff for the binding of a particle onto the cell surface. It shows that, below 2.9 × 10⁵ receptors per cell, no particle may adhere steadily onto the cell surface; the probability to stabilize at least one particle on the surface then becomes 1, inasmuch as the mean number of binding sites attains the value of 3.8 × 10⁵ per cell.
FIGURE 6.
Binding sites distribution of particle-free and particle-bound cells. 5 × 10⁵/ml LB cells labeled with biotinylated anti-CD19 were incubated with 5 × 10⁶/ml particles for 60 min. Once the binding process was achieved, cells with particles and cells without particles were physically sorted under magnetic field gradient. The cells in the supernatant, without particles, were then labeled with a saturating (1 μg/ml) FITC-coupled streptavidin and their fluorescence histogram (dark shaded) recorded in the FL1 flow cytometer channel. The same labeling was performed in parallel on biotinylated cells before the incubation with the particles (open black). These are shown together with an unlabeled control cells histogram (dotted line); mean values in Table 1.
TABLE 1.
Mean fluorescence (FL1) and binding site values of cell treated with biotinylated anti-CD19 and labeled with saturating concentrations of streptavidin FITC
| Cell population | Mean fluorescence | Mean number of sites per cell | Mean number of sites/μm2 |
|---|---|---|---|
| Control | 2 | — | — |
| Particle-free | 10.5 | 2.2 × 10⁵ | 1.1 × 10³ |
| All cells | 19.8 | 4.1 × 10⁵ | 2.1 × 10³ |
FIGURE 7.
Receptor density cutoff for the binding of a particle, obtained after subtraction of the particle-free cells distribution to the total cells distribution, normalization of each histogram to the same number of cells, and multiplication of each by their respective mean frequency, i.e., 0.4 and 0.6.
Number of particles per cell and binding order
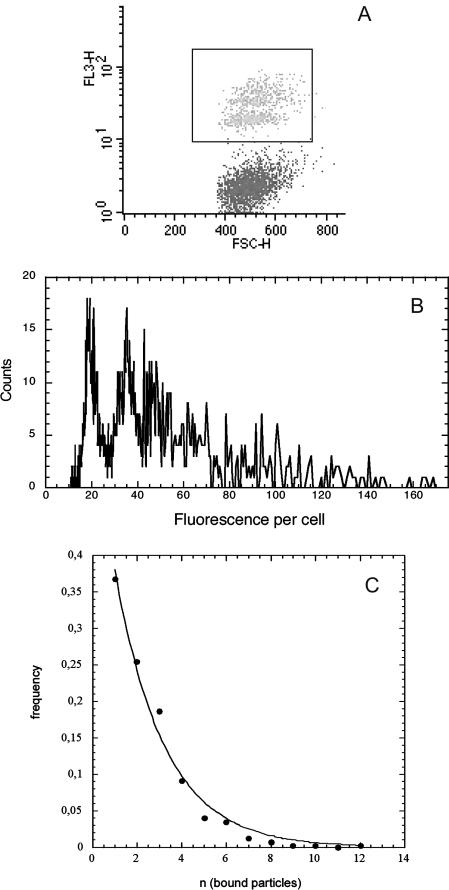
Some experiments were performed using a particle batch displaying a size distribution narrower than the current samples. Because of this small size dispersion, we were able to distinguish, inside the particle-bearing cells cluster, subclusters of cells characterized by n (the number of particles per cell); see Fig. 8. Then, we plotted ν, the frequency of cells bearing n particles, as a function of n when the binding was achieved (Fig. 8). The curve obtained was adjustable to an exponential decrease like
 |
FIGURE 8.
Number of bound particles per cell: the cluster of the cells having bound particles (black frame) was selected on the biparametric dot-plot (A), at the kinetic plateau of the binding (same experimental conditions as in Fig. 2). Its fluorescence distribution was plotted according to a linear scale (B), which allowed resolving discrete populations of cells according to their bound-particles' number. The fluorescent increment per bound particle was found equal to 17 arbitrary units. The number of cells per subpopulation (with 1, 2, 3, … , n particles) was counted and plotted as a function of n, the number of bound particles per cell (C). The experimental points (•) were adjusted to an exponential decay (—) of the form ν(n) = p × e−δ×n.
This behavior suggested that the energy barrier encountered by a particle to bind on the cell surface increased with the number of particles already bound to the cell. The value p is a prefactor depending on experimental conditions such as the number of cells and particles, i.e., the value of the binding threshold. The value δ accounts for the energy barrier increase occurring between the binding of a particle at the order (n+1) and the binding of a particle at the order n.
Parameters affecting the binding profile
The effect of four experimental parameters on the particle-binding characteristics ƒc and τ were tried.
The role of particle/cell ratio
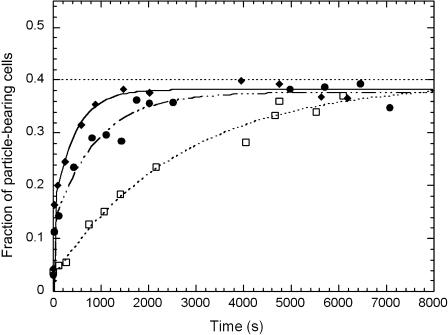
The results shown in Fig. 9 demonstrated that the decrease of the particle/cell number ratio did not affect ƒc, the fraction of particle-bearing cells, but induced the increase of the kinetic parameter τ. These results evidenced an irreversible binding, the kinetics of which was determined by the number of collisions per time unit.
FIGURE 9.
Effect of particles/cells ratio. Cells and particles were put into contact as described in Fig. 3 except the particles/cells ratio was decreased. Ratios are equal to 2 (□), 7 (•), and 15 (♦).
The length of the molecular link
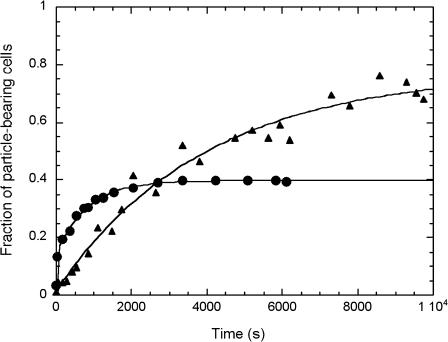
We increased the length of the molecular link using an additional binding level made of biotinylated polyclonal anti-mouse (Fab)′2 fragments directed against the mouse anti-CD19 already bound to the cell. Fig. 10 illustrates the increase of the parameter ƒc in the lengthened configuration. It also appears that the characteristic binding time was increased with this longer link.
FIGURE 10.
Effect of the length of the molecular link. Cell/particle binding process was followed as in Fig. 3 except the molecular link presented by the cell was extended using a biotinylated (Fab)′2 fragment directed against the mouse anti-CD19 already bound on the B-cell (▴). Data obtained with the shortest link, i.e., biotinylated anti-CD19 (•).
The rotation speed
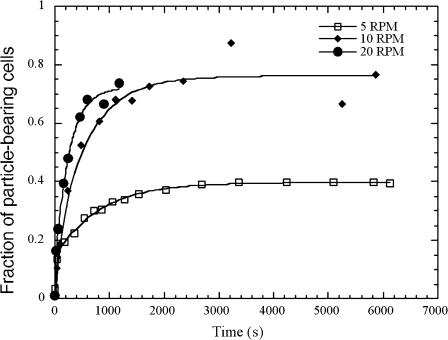
We found that the rotation speed of the sample during the stirring also influenced ƒc and τ. The value ƒc increased with the stirring speed, whereas τ decreased as shown in Fig. 11. Actually, this stirring mode induced the sample to flow from bottom to top of the tube twice per rotation. Each liquid inversion occurred on a rather small angle (′10° for a 2-ml sample at 5 rpm), submitting the sample to shear flows, the intensity of which depended upon the disk rotation speed. The speeding-up of the stirring induces an increase of: the collision probability per unit of time; the shear; and the kinetic energy of the particles.
FIGURE 11.
Effect of stirrer rotation speed. The kinetics of the cell/particle binding process was followed as described in Fig. 3 for three different rotation speeds of the stirring setup: 5 RPM (□), 10 RPM (♦), and 20 RPM (•).
The cell energetic poisoning
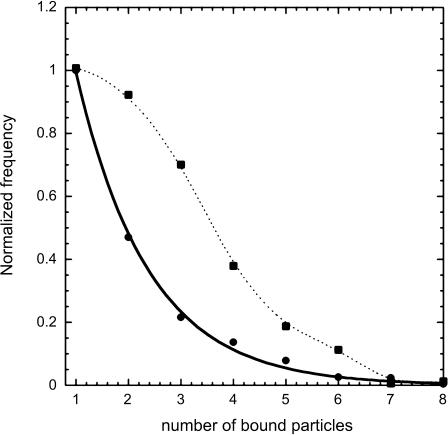
To estimate the contribution of the cell active processes to the binding profile, we performed all experiments in the presence of 0.1% sodium azide, which abolished the ATP resources of the cell. Upon this treatment, the captured cell's fraction increased 15%. This effect was accompanied by a small change in the number of particles per cell distribution, which causes the exponential decay to display an s-shaped dependence on the number of already bound particles (Fig. 12).
FIGURE 12.
Distribution of the number of particles per cell. The number of cells, ni, in each subpopulation of cells bearing i particles was plotted as a function of i, for experiments performed with (▪) or without (•) 0.1% sodium azide. The normalized frequency for a subpopulation of cells bearing i particles is equal to  where νmax is equal to the highest frequency of the sample.
Contact area and binding potential
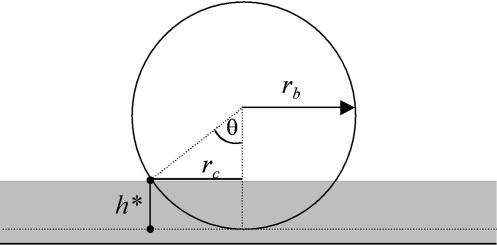
Contact area between particle and cell was estimated from geometric considerations (Fig. 13) and image analysis of 50 microscopy images. The key length of the problem was h*, the height of the particle cap that entered into contact with the cell surface. The corresponding contact area is then
 |
with a radius rc equal to
 |
or
 |
FIGURE 13.
Geometry of the contact. This figure gives the parameters allowing the description of particle/cell contact, where rc is the radius of the contact area, rb is the radius of the particle, and h* is the penetration depth of the particle in the cell surface layer.
The value h* was measured on samples at the kinetic plateau. We obtained h* values comprised between 1.4 and 3.5 μm2 with a mean value and standard deviation equal to 2.5 μm2 and 0.7 μm2, respectively. Considering the mean surface receptor density, a 2.5-μm2 cell surface should gather a mean binding potential of 2 × 10³ receptors as compared to the global mean distribution and 4 × 10³ receptors as compared to cutoff density. On the other side, the particle presented a number of potential links equal to 5 × 10⁵ on a 2.5-μm2 surface. These numbers reflect the mean distributions and do not take into account possible local receptor concentrations. Under these static conditions, a mean contact should be able to connect a maximum number of 4 × 10³ molecular streptavidin-biotin links.
Estimation of density of molecular links in a contact
To estimate the number of links actually participating in a contact, we carried out micropipette experiments on a single cell. The binding energy stored in a contact was evaluated from the mechanic equilibrium obtained after pulling apart cell and particle in the axis of the contact (Fig. 14). We measured the contact angles using an automatic-edges research program. However, we should mention that the contact-angle measurements at the cell surface were rather inaccurate due to halo effects, inducing high standard error on the value of Wa. Following the analysis of Tozeren et al. (1989), explained in Materials and Methods, we obtained a density of energy of the order of (1 ± 0.5) × 105 kT/μm2, i.e., according to the mean area of a contact (2.5 ± 1.25) × 105 kT per contact. At this point, it is difficult to straightforwardly extract a defined number of links, N, from this energy of adhesion. The first reason is that we do not exactly know the energy of such a link within the contact at the cell surface. Indeed, it has been shown, for instance in Pérez-Luna et al. (1999), that the kinetic constants for the dissociation of the streptavidin-biotin link at an interface were affected by the structure of the surface itself. The second reason is that we have no precise description of the thermodynamics of the contact. However, it can be reasonably accepted (Brochard-Wyart and de Gennes, 2003) that this energy of adhesion is comprised between N × (kT) and N × ɛb × (kT), where ɛb is the energy of a link. Then using the energy of streptavidin-biotin link formed in solution, we found that the number of links within a 2.5-μm2 contact should be comprised between (7 ± 0.35) × 103 and (2.5 ± 1) × 105.
FIGURE 14.
Evaluation of cell-particle energy of adhesion. Cell and particle are pulled apart with micropipette. The various angles used for the calculation of the energy of adhesion are shown. Experiments were performed at room temperature.
DISCUSSION
We have depicted here a few passive biophysical aspects of the binding of colloidal particles, mediated by a collection of molecular links, on the surface of a B-cell line. This question of the establishment of molecular bonds in the bushy material of the cell surface deserves to be addressed to better understand the strategies developed by the cell to interact with the macroscopic objects of its environment. This also happens in physiological situations where cells have to cooperate through specific association, such as, for example, in the formation of the immunological synapse (Grakoui et al., 1999), rather than in more technological situations such as specific cell sorting using magnetic colloids (Chalmers et al., 1998).
As a tool, we have employed well-defined micrometric particles bearing streptavidin, and a biotinylated antibody targeted to the B-cell specific receptor CD19, and then followed the phenomenology of the particles binding to the labeled cells. The most striking feature of this binding process was that only a fraction of the cell population appeared to be competent for particle binding, even though the cell line was probed for its CD19 surface expression and proved to display a monomodal CD19 distribution with a mean value of 4 × 10⁵ receptors per cell. We have shown here that this cell selection originated in the existence of a receptor surface density threshold governing the binding. The association of a particle to a cell occurred only if the receptor surface density reached a minimal limiting value that was found equal to 1.6 × 10³ receptors/μm2. Depending on the receptor distribution, this threshold value determined the fraction ƒc of cells that were able to bind one or more particles. Similar behavior was also observed with another B-cell line (JY) and with a T-cell line (Jurkat) labeled using a biotinylated anti-CD3 antibody (data not shown). Still, we have shown that the binding threshold shifted toward the lower density values when the molecular link was lengthened, suggesting that steric hindrance created by the glycocalix restrained the binding site's accessibility.
Considering that the mean surface densities of receptors and ligands on cell and particle, together with the estimation of the contact area, were found to be ∼2.5 μm2, it can be calculated that a contact may potentially assemble 4 × 10³ links. This is the mean number of receptors presented by the cell over a 2.5-μm2 area. On the particle side, the same area presents 5 × 10⁵ binding sites. The micropipette experiments have provided limit-values telling us that the number of links within a contact should be comprised between 7 × 10³ and 2.5 × 10⁵. Despite the large values-interval provided, these experiments indicated that a high number of sites were, in fine, actually connected between cell and particle; these numbers are much higher than we would have expected for the retaining of such a particle in a hydrodynamic flow. For a given system in which the nature of the molecular link and the surface densities of receptor and ligand are fixed, the two parameters governing the number of links, N, necessary to retain a particle on a surface are γ, the shear stress and rc, the radius of the contact area. Indeed, the theoretical framework introduced by Bell (1978) and detailed in Cozens-Roberts et al. (1990) allowed us to calculate N from the expression
 |
(1) |
where λ is the range of the interaction; kB is the Boltzmann constant; T is the temperature; γ is the shear stress; Ka is the two-dimensional association constant of the binding link; ρL is the ligand surface density; and rb is the radius of the particle. Here, to evaluate N from Eq. 1, we took λ to be equal to 5 × 10⁻⁸ cm, just as for the antigen-antibody bond (Cozens-Roberts et al., 1990). Considering that the rupture will take place at the site of the weakest junction (Saterbak and Lauffenburger, 1996), we took for Ka the affinity constant of the association of anti-CD19 with its CD19 target determined above (8.2 × 10⁸ M−1). At this point, it should be noted that the constant entering in Eq. 1 is a two-dimensional constant whereas the constant we have determined is a three-dimensional constant. We made the volume-to-surface conversion following the considerations of Dustin et al. (1997), i.e., introducing a characteristic length of the order of the molecule size (10 nm). The ligand surface density, ρL, was equal to 2 × 10¹³/cm2, the streptavidin surface density of the particles, and rb was equal to 1.4 × 10⁻⁴ cm. The shear stress applied in our experimental setup was of course strongly heterogeneous but we have been able to estimate from the fluid volume in the tube and from the speed of liquid inversion that γ reasonably ranged between 1 and 10 dyn/cm2. We then calculated N for a range of rc-values providing contact areas comprised between 103 and 104 nm2. Afterwards we calculated the number of links offered by the cell surface for the same range of contact area considering the surface density at the binding threshold. We then obtained that, at the threshold density, the cell was able to bind a particle (i.e., to gather enough receptor for the particle not to be detached by the fluid) only if the contact area was at least equal to 5000 nm2, the number of necessary links being equal to 8. At lower receptor densities, the number of links presented by the cell for this contact area decreases below this limiting stabilizing number—explaining why the cells could no longer bind any particles, with those being immediately detached by the shear flow.
On the other hand, we observed that increasing the rotation speed of the stirring machine decreased the binding threshold value and we attributed this effect to the increase of the shear stress. Now, Eq. 1 predicts that the threshold should increase, inasmuch as N is proportional to the shear stress but only if γ and rc are independent variables—which is the case for solid surfaces as described in Cozens-Roberts et al. (1990), Saterbak et al., (1993), and Pierres et al. (1998, 2001). Here, the cell surface is a soft material offering a viscoelastic layer, having a plastic response in the collision with the particle, the extent of which should depend strongly on the torque and force imposed by the fluid on the particle, and then from the shear stress. Our working hypothesis is now that the shear stress has two counteracting effects in the binding. On the one hand, it increases the detaching force; on the other hand, it increases the contact area between cell and particle—decreasing the number of required links to stabilize the particle at the surface, thereby decreasing the threshold value. This idea is now under investigation in our group using homogeneous shearing in a cone-plate setup. At this point, we guess that the characteristics of the binding profile originate in the existence and the properties of the glycocalyx and that describing the response to the shear will help us to better understand the role of this structure in the regulation of the cell-surface interactions. Sabri et al. (2000) has already shown in activated human monocytes that such a regulating role could take place through compression or displacement of the bulky structures of this layer.
The binding scheme proposed above entails that the contact area delineated by the collision may grow from approximately eight links, distributed over 500 nm2, to reach a few thousand occupying a few μm2—as was measured at the plateau of the interaction. This contact area may simply grow as the particle locally rolls over the cell with an amplitude depending on the cell membrane and the initial link's elasticity (Schmid-Schonbein et al., 1981; Dong et al., 1988). Then, the ligands and receptors align, allowing much additional molecular binding. In a static vision of ligands and receptors distribution, the particle connects only the locally facing receptors. However, in this hypothesis, the cell should accommodate particles almost up to close packing, whereas only cells having bound a few particles (10 at the very most) were evidenced. Moreover, we have shown in this report that the probability for a cell-particle contact to occur decreased exponentially with the particle order, suggesting that the binding of the particle nth affected the binding of the particle (n+1)th. This might have something to do with some spatial orientation effect induced by the already bound particles. Indeed, once a cell has bound one particle, it is no longer a spherical object and in a shear field, it might well adopt a preferential orientation that would affect the subsequent binding events. However, this is rather difficult to evaluate and our preferred hypothesis is that of a dynamic process where the binding initiation would induce migration of receptors toward the contact. This receptor migration would then also drive the arrest of the binding of particles of higher order by decreasing the mean receptors surface density below the binding threshold. This implies that migration of receptors occurs with a characteristic time significantly lower than the characteristic time of particle binding. The ratio of these two times is contained in the constant δ, which gives the exponential decrease of the binding probability with the binding order of the particle. This migration of receptors toward the contact area seems to be a mainly passive process driven by the thermodynamic equilibrium of the unbound receptors at the cell surface. Indeed, the energetic poisoning of the cell only slightly affected the interaction characteristics. A small density threshold decrease and a binding inhibition retardation were observed using sodium azide treatment. This suggests that cell active processes, which were likely of very low level in the conditions we used, only tended to facilitate or accelerate the migration of the receptors but not to trigger it. CD19 is actually a co-receptor of the B-cell receptor engagement and is known for being able to translocate in lipid rafts upon stimulation (Cherukuri et al., 2001). It forms transitory noncovalent complexes with CD21 and CD81, obviously holding the intrinsic aptitude to diffuse freely in the membrane.
To summarize the main findings of this work, we propose a model for the specific cell-surface interaction where:
The binding involves a large collection of links.
The cell surface receptor density operates like a switch for binding.
The strength of the collision between cell and the surface (here, colloidal surface) is a key parameter of the binding, because it determines the receptor surface density threshold value that allows the binding. This collision strength is determined by the physical conditions of cell-surface contact, in particular the shear stress applied. This is of most importance for technological applications such as those consisting of sorting cells on specific criteria using ligand-bearing particles (immunodiagnostic applications). Adapting the incubation setup to apply a control shear stress will lead to a net higher and accelerated capture of the cells of interest.
The length of the molecular link appeared to increase the number of efficient binding events, strengthening the idea of the role of the steric repulsion and the important role of the glycocalyx. This is also for consideration in conceiving cell-sorting tools: if some latitude is permitted on the receptor serving for the capture, it has to be chosen to be as long as possible; if not, the ligand architecture has to be a long one, eventually involving bonds in series.
The initial limiting contact, which allows the cell-surface binding and which is established at the moment of the collision, spreads up to a few μm2, providing a strong adhesion involving thousands of links.
It seems that the establishment of the contact concentrates the binding molecules within the contact zone. This phenomenon appears to operate like a switch-off to further binding.
The receptor clustering in adhesive phenomena has often been observed, both experimentally and theoretically, as the result of spontaneous thermodynamic equilibrium upon binding mostly in biophysical model systems (e.g., Torney et al., 1986; Albersdörfer et al., 1997; Bruinsma et al., 2000; Brochard-Wyart and de Gennes, 2002). Depending upon the physical and chemical conditions offered, this clustering might provide to the cell some sort of basic means for regulating its interaction with the environment.
Acknowledgments
We are grateful to Pierre Nassoy for valuable discussions and to Christophe Hubert for skillful technical assistance.
The Fonds Européen de Développement Régional Objectif 2 and Bioengineering Program from the French Ministry of Research and Technology have contributed financial support for this work.
References
- Albersdorfer, A., T. Feder, and E. Sackmann. 1997. Adhesion-induced domain formation by interplay of long-range repulsion and short-range attraction force: a model membrane study. Biophys. J. 73:245–257. [DOI] [PMC free article] [PubMed] [Google Scholar]
- Bradbury, L. E., V. S. Goldmacher, and T. F. Tedder. 1993. The CD19 signal transduction complex of B lymphocytes. Deletion of the CD19 cytoplasmic domain alters signal transduction but not complex formation with TAPA-1 and Leu13. J. Immunol. 1993. 151:2915–2927. [PubMed] [Google Scholar]
- Braun, D., and P. Fromherz. 1998. Fluorescence interferometry of neuronal cell adhesion on microstructured silicon. Phys. Rev. Lett. 81:5241–5244. [Google Scholar]
- Brochard-Wyart, F., and P. G. de Gennes. 2002. Adhesion induced by mobile binders: dynamics. Proc. Natl. Acad. Sci. USA. 99:7854–7859. [DOI] [PMC free article] [PubMed] [Google Scholar]
- Bruinsma, R., A. Behrisch, and E. Sackmann. 2000. Adhesive switching of membranes: experiment and theory. Phys. Rev. E. 61:4253–4267. [DOI] [PubMed] [Google Scholar]
- Bell, G. I. 1978. Models for the specific adhesion of cells to cells. Science. 200:618–627. [DOI] [PubMed] [Google Scholar]
- Berk, D., and E. Evans. 1991. Detachment of agglutinin-bonded red blood cells. III. Mechanical analysis for large contact areas. Biophys. J. 59:861–872. [DOI] [PMC free article] [PubMed] [Google Scholar]
- Chalmers, J. J., M. Zborowski, L. Sun, and L. Moore. 1998. Flow through, immunomagnetic cell separation. Biotechnol. Prog. 14:141–148. [DOI] [PubMed] [Google Scholar]
- Chenevier, P., B. Veyret, D. Roux, and N. Henry-Toulme. 2000. Interaction of cationic colloids at the surface of J774 cells: a kinetic analysis. Biophys. J. 79:1298–1309. [DOI] [PMC free article] [PubMed] [Google Scholar]
- Cherukuri, A., P. C. Cheng, H. W. Sohn, and S. K. Pierce. 2001. The CD19/CD21 complex functions to prolong B-cell antigen receptor signaling from lipid rafts. Immunity. 14:169–179. [DOI] [PubMed] [Google Scholar]
- Cozens-Roberts, C., J. A. Quinn, and D. A. Lauffenberger. 1990. Receptor-mediated adhesion phenomena. Model studies with the radical-flow detachment assay. Biophys. J. 58:107–125. [DOI] [PMC free article] [PubMed] [Google Scholar]
- de Gennes, P. G., P. H. Puech, and F. Brochard-Wyart. 2003. Adhesion induced by mobile stickers: a list of scenarios. Langmuir. 19:7112–7119. [Google Scholar]
- Dong, C., R. Skalak, K. L. Sung, G. W. Schmid-Schonbein, and S. Chien. 1988. Passive deformation analysis of human leukocytes. J. Biomech. Eng. 110:27–36. [DOI] [PubMed] [Google Scholar]
- Dustin, M. L., D. E. Golan, D. M. Zhu, J. M. Miller, W. Meier, E. A. Davies, and P. A. van der Merwe. 1997. Low affinity interaction of human or rat T-cell adhesion molecule CD2 with its ligand aligns adhering membranes to achieve high physiological affinity. J. Biol. Chem. 272:30889–30898. [DOI] [PubMed] [Google Scholar]
- Evans, E. 2001. Probing the relation between force-lifetime and chemistry in single molecular bonds. Annu. Rev. Biophys. Biomol. Struct. 30:105–128. [DOI] [PubMed] [Google Scholar]
- Grakoui, A., S. K. Bromley, C. Sumen, M. M. Davis, A. S. Shaw, P. M. Allen, and M. L. Dustin. 1999. The immunological synapse: a molecular machine controlling T-cell activation. Science. 285:221–227. [DOI] [PubMed] [Google Scholar]
- Gumbiner, B. M. 1996. Cell adhesion: the molecular basis of tissue architecture and morphogenesis. Cell. 84:345–357. [DOI] [PubMed] [Google Scholar]
- Helm, C. A., W. Knoll, and J. N. Israelachvili. 1991. Measurement of ligand-receptor interactions. Proc. Natl. Acad. Sci. USA. 88:8169–8173. [DOI] [PMC free article] [PubMed] [Google Scholar]
- Hutchinson, S. L., L. Wooldridge, S. Tafuro, B. Laugel, M. Glick, J. M. Boulter, B. K. Jakobsen, D. A. Price, and A. K. Sewell. 2003. The CD8 T-cell coreceptor exhibits disproportionate biological activity at extremely low binding affinities. J. Biol. Chem. Apr 15, 2003 [epub ahead of print]. 278:24285–24293. [DOI] [PubMed] [Google Scholar]
- Jung, L. S., K. E. Nelson, P. S. Stayton, and C. T. Campbell. 2000. Binding and dissociation kinetics of wild-type streptavidins on missed biotin-containing alkylthiolate monolayers. Langmuir. 16:9421–9432. [Google Scholar]
- Leckband, D. E., F. J. Schmitt, J. N. Israelachvili, and W. Knoll. 1994. Direct force measurements of specific and nonspecific protein interactions. Biochemistry. 33:4611–4624. [DOI] [PubMed] [Google Scholar]
- Lévéille, C., J. G. Castaigne, D. Charron, and R. Al-Daccak. 2002. MHC class II isotype-specific signaling complex on human B-cells. Eur. J. Immunol. 32:2282–2291. [DOI] [PubMed] [Google Scholar]
- Merkel, R., P. Nassoy, A. Leung, K. Ritchie, and E. Evans. 1999. Energy landscapes of receptor-ligand bonds explored with dynamic force spectroscopy. Nature. 397:50–53. [DOI] [PubMed] [Google Scholar]
- Pérez-Luna, V., M. J. O'Brien, K. A. Opperman, P. D. Hampton, G. P. López, L. A. Klumb, and P. S. Stayton. 1999. Molecular recognition between genetically engineered streptavidin and surface-bound biotin. J. Am. Chem. Soc. 121:6469–6478. [Google Scholar]
- Pierres, A., A. M. Benoliel, and P. Bongrand. 1998. Use of a laminar flow chamber to study the rate of bond formation and dissociation between surfce-bound adhesion molecules: effect of applied force and distance between surfaces. Faraday Discuss. 111:321–330. [DOI] [PubMed] [Google Scholar]
- Pierres, A., A. M. Benoliel, C. Zhu, and P. Bongrand. 2001. Diffusion of microspheres in shear flow near a wall: use to measure binding rates between attached molecules. Biophys J. 81:25–42. [DOI] [PMC free article] [PubMed] [Google Scholar]
- Pierres, A., D. Touchard, A. M. Benoliel, and P. Bongrand. 2002. Dissecting streptavidin-biotin interaction with a laminar flow chamber. Biophys. J. 2002 82:3214–3223. [DOI] [PMC free article] [PubMed] [Google Scholar]
- Ravaine, V., J. Bibette, and N. Henry. 2002. Wetting of liquid droplets on living cells. J. Colloid Interface Sci. 255:270–273. [DOI] [PubMed] [Google Scholar]
- Sabri, S., M. Soler, C. Foa, A. Pierres, A. Benoliel, and P. Bongrand. 2000. Glycocalyx modulation is a physiological means of regulating cell adhesion. J. Cell Sci. 113:1589–1600. [DOI] [PubMed] [Google Scholar]
- Saterbak, A., and D. A. Lauffenburger. 1996. Adhesion mediated by bonds in series. Biotechnol. Prog. 12:682–699. [DOI] [PubMed] [Google Scholar]
- Saterbak, A., S. C. Kuo, and D. A. Lauffenburger. 1993. Heterogeneity and probabilistic binding contributions to receptor-mediated cell detachment kinetics. Biophys. J. 65:243–252. [DOI] [PMC free article] [PubMed] [Google Scholar]
- Schmid-Schonbein, G. W., K. L. Sung, H. Tozeren, R. Skalak, and S. Chien. 1981. Passive mechanical properties of human leukocytes. Biophys. J. 36:243–256. [DOI] [PMC free article] [PubMed] [Google Scholar]
- Stuart, D. I., and E. Y. Jones. 1995. Recognition at the cell surface: recent structural insights. Curr. Opin. Struct. Biol. 5:735–743. [DOI] [PubMed] [Google Scholar]
- Torney, D. C., M. Dembo, and G. I. Bell. 1986. Thermodynamics of cell adhesion. II. Freely mobile repellers. Biophys J. 49:501–507. [DOI] [PMC free article] [PubMed] [Google Scholar]
- Tozeren, A., K. L. Sung, and S. Chien. 1989. Theoretical and experimental studies on cross-bridge migration during cell disaggregation. Biophys J. 55:479–487. [DOI] [PMC free article] [PubMed] [Google Scholar]
- Van der Merwe, P. A. 2002. Formation and function of the immunological synapse. Curr. Opin. Immunol. 14:293–298. [DOI] [PubMed] [Google Scholar]
- Wong, J. Y., T. L. Kuhl, J. N. Israelachvili, N. Mullah, and S. Zalipsky. 1997. Direct measurement of a tethered ligand-receptor interaction potential. Science. 275:820–822. [DOI] [PubMed] [Google Scholar]
- Verkhivker, G. M., D. Bouzida, D. K. Gehlhaar, P. A. Rejto, S. T. Freer, and P. W. Rose. 2002. Complexity and simplicity of ligand-macromolecule interactions: the energy landscape perspective. Curr. Opin. Struct. Biol. 12:197–203. [DOI] [PubMed] [Google Scholar]


