Abstract
Multisite phosphorylation of regulatory proteins has been proposed to underlie ultrasensitive responses required to generate nontrivial dynamics in complex biological signaling networks. We used a random search strategy to analyze the role of multisite phosphorylation of key proteins regulating cyclin-dependent kinase (CDK) activity in a model of the eukaryotic cell cycle. We show that multisite phosphorylation of either CDK, CDC25, wee1, or CDK-activating kinase is sufficient to generate dynamical behaviors including bistability and limit cycles. Moreover, combining multiple feedback loops based on multisite phosphorylation do not destabilize the cell cycle network by inducing complex behavior, but rather increase the overall robustness of the network. In this model we find that bistability is the major dynamical behavior of the CDK signaling network, and that negative feedback converts bistability into limit cycle behavior. We also compare the dynamical behavior of several simplified models of CDK regulation to the fully detailed model. In summary, our findings suggest that multisite phosphorylation of proteins is a critical biological mechanism in generating the essential dynamics and ensuring robust behavior of the cell cycle.
INTRODUCTION
To model networks that exhibit nontrivial dynamical behavior, such as oscillations, bistability (i.e., biological switches) or excitability, nonlinear relationships are required to produce sensitive responses to small changes. Most often, these sensitive responses are modeled phenomenologically using sigmoidal or other steep relationships. We (Qu et al., 2003b) and others (Deshaies and Ferrell, 2001; Ferrell and Bhatt, 1997; Ferrell, 1996; Huang and Ferrell, 1996) have suggested that multisite phosphorylation of proteins is a common biological mechanism by which sensitive responses critical for dynamics are generated. In many biological signaling networks, protein phosphorylation is a common process regulating enzyme activity. It is also common for activation or inactivation of a protein's enzymatic activity to require phosphorylation at more than one site. Unlike single site phosphorylation, multisite phosphorylation generates a nonlinear relationship (i.e., Hill coefficient >1) in the activation (or inactivation) profile of a protein's enzymatic activity. This mechanism of generating sensitive response has been well studied in the MAP kinase signaling pathways, both theoretically and experimentally (Ferrell and Bhatt, 1997; Ferrell, 1996; Huang and Ferrell, 1996).
The purpose of this study is to further explore the role of multisite phosphorylation in a complex signaling network. Two major questions are addressed: 1), How important are the number of phosphorylation sites and their cooperativity for generating nontrivial dynamics? 2), Since detailed multisite phosphorylation models are complex and can add greatly to the overall complexity of a signaling network model (especially when multiple proteins are all regulated by phosphorylation/dephosphorylation), what simplifications are most appropriate for modeling purposes?
To address these questions, we analyzed the cyclin-dependent kinase (CDK) signaling network regulating the cell cycle. In the cell cycle signaling network, many positive and negative feedback loops are regulated by phosphorylation and dephosphorylation, and combine to form signaling modules with distinct functions. Moreover, there is also experimental evidence (Deshaies and Ferrell, 2001; Karaïskou et al., 1999; Nash et al., 2001) that multistep phosphorylation is essential for cell cycle progression. Using a random search strategy to explore the parameter space of a complex cell cycle signaling network model, we analyzed the minimum conditions required to generate nontrivial dynamics with respect to number and cooperativity of phosphorylation sites in proteins regulating CDK activity. Next, we examined how multisite phosphorylation of CDK regulation in the cell cycle is most properly represented in simplified form.
METHODS
Mathematical Modeling
The detailed descriptions of mathematical modeling are presented in the Appendix. Here we briefly summarize the key modeling aspects.
Cyclin and CDK regulation
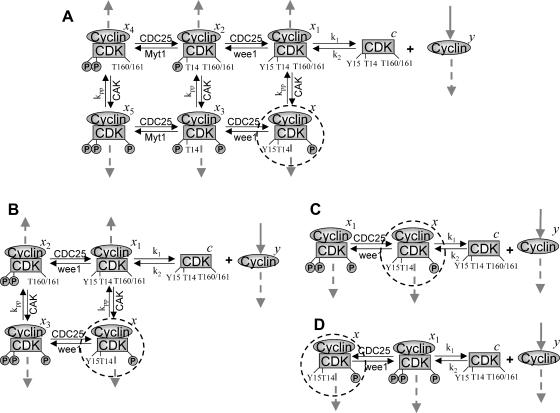
Cyclin, CDK binding, and CDK phosphorylation/dephosphorylation are schematically illustrated in the full signaling network shown Fig. 1 A, and the simplified models are shown in Fig. 1, B–D. We formulated these signaling networks into differential equations according to the law of mass action—a standard method for modeling the chemical reactions (Keener and Sneyd, 1998). We assumed that cyclin is synthesized at a constant rate (rate constant ks,cyc in all models). Different forms of cyclin (free or complexed with CDK) have different degradation rates. Here we used three types of degradation rates, i.e., one for free cyclin (kd1), one for cyclin in inactive cyclin-CDK complex (kd2), and one for cyclin in active cyclin-CDK complex (kd3). In the simulations without negative feedback, degradation rates were constant. In the simulations with negative feedback, rates were variable (kd1uu, kd2uu, and kd3uu for the three forms of cyclin, respectively) due to the negative feedback facilitated by SCF-SKP2 or APC-CDC20 (Bilodeau et al., 1999; Morgan, 1999; Peters, 1998). We assumed total CDK to be constant (c0).
FIGURE 1.
Models of the signal transduction network for CDK regulation. (A) Signaling network of the full model. (B) Signaling network of simplified Model A. (C) Signaling network of simplified Model B. (D) Signaling network of simplified Model C. The thick solid arrows indicate cyclin synthesis and dashed arrows indicate cyclin degradation. Labels refer to the variables used in the differential equations (Appendix) for each monomer and dimer. Rate constants for CDC25, CAK, wee1, and Myt1 phosphorylation and dephosphorylation of CDK are denoted as kcdc25, kcak, kwee1, and kmyt1, and other rate constants are as indicated.
CDC25, wee1, and CDK-activating kinase regulation
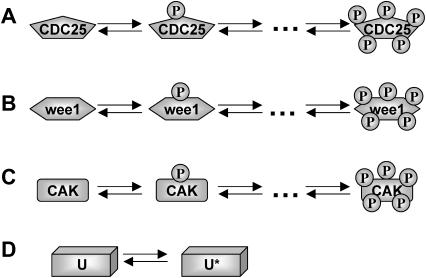
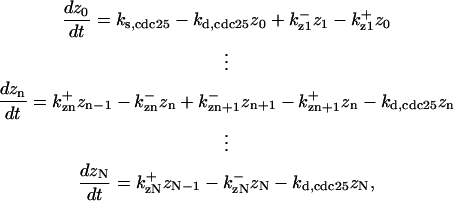
CDC25 synthesis rate (ks,cdc25) and the degradation rates of all its phosphorylated forms (kd,cdc25) were assumed to be constant. CDC25 phosphorylation is catalyzed by active cyclin-CDK. CDC25C has five serine/threonine-proline phosphorylation sites (Thr-48, Thr-67, Ser-122, Thr-130, and Ser-214), which are phosphorylated during the cell cycle (Hoffmann et al., 1993; Kumagai and Dunphy, 1992; Morris et al., 2000), but it is not clear whether phosphorylation of these sites is sequential or not. For CDC25A and CDC25B, it is not clear how many sites are phosphorylated during the cell cycle. Therefore, we assumed a variable scheme of N phosphorylation sites, as shown in Fig. 2 A. To examine the effects of cooperativity of multisite phosphorylation, we modeled each phosphorylated form of CDC25 to have an assignable kinase activity, so that the total CDC25 kinase activity (or reaction rate of CDK dephosphorylation by CDC25) was given by  in which zn is the concentration of the nth-phosphorylated form of CDC25 and αn represents the phosphatase activity of the nth-phosphorylated form.
FIGURE 2.
Models for the phosphorylation steps for CDC25 (A), wee1 (B), CAK (C), and SCF-SKP2 or APC-CDC20 (D). Phosphorylation of CDC25, wee1, and CAK are catalyzed by active cyclin-CDK. SCF-SKP2 or APC-CDC20 (U inactive and U* active in D) is also activated by active cyclin-CDK.
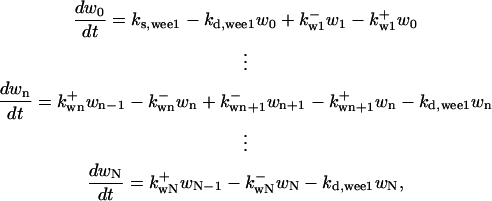
It is not known to us how many phosphorylation sites that wee1 has. We therefore assumed the same regulation scheme as for CDC25 (Fig. 2 B) and its kinase activity was quantified as  in which wn is the nth-phosphorylated form of wee1 and βn represents the phosphatase activity of the corresponding phosphorylated form.
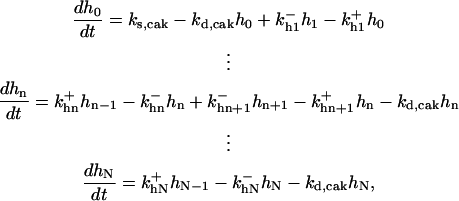
CDK-activating kinase (CAK) is known to be phosphorylated by CDK1 or CDK2 at two sites, Thr-170 and Ser-164 on CDK7 (Garrett et al., 2001). We modeled the CAK phosphorylation and its kinase activity the same way as for CDC25 and wee1 (Fig. 2 C), with kinase activity  in which hn is the nth-phosphorylated form of CAK and γn represents the kinase activity of the corresponding phosphorylation form.
SCF-SKP2 and APC-CDC20 regulation
Activation of SCF-SKP2 and APC-CDC20 requires CDK-mediated phosphorylation (Bilodeau et al., 1999; Morgan, 1999; Peters, 1998). SCF or APC binds cyclin for ubiquitination and degradation, thus forming a key negative feedback loop in the cell cycle network. We did not analyze the effects of multistep phosphorylation of SCF-SKP2 or APC-CDC20, since we were interested primarily in assessing the effects of negative feedback on dynamics. Therefore, we used a simple phenomenological differential equation developed previously (Qu et al., 2003a), which is presented in the Appendix as Eq. E.
Computer simulation
Definition of dynamical behaviors
Simulations were designed to detect bistability, limit cycle, and complex dynamical behaviors. For detecting bistability, the steady state of the differential equations was obtained numerically and the stability was analyzed using MATLAB programming. Specifically, we set the left-hand side of the differential equations to zero and numerically solved the algebra equations to get the steady-state solutions. When multiple steady-state solutions were found for a set of parameters, we analyzed the stabilities of the steady-state solutions to determine whether they are bistable solutions or not. For detecting limit cycle and other complex oscillations, we numerically solved the differential equations using the fourth-order Runge-Kutta method (Press et al., 1992) and integrated the differential equations long enough to resolve transient oscillations. Limit cycle and complex oscillations were detected by calculating the period of the oscillation. If the period was constant from cycle to cycle, it was defined as a limit cycle. If the period changed from cycle to cycle, it was defined as complex dynamics.
Random parameter search methods
Since the model is very complex, with 17 differential equations and 38 parameters in most cases, it is not possible to explore systematically the parameter space to define all possible dynamical regimes. In addition, experimentally determined values of most parameters are not available from the literature, or differ substantially among species. We therefore used a Monte Carlo-like method to randomly search the parameter space of the model, similar to that described by von Dassow et al. (2000) to detect pattern formation during insect development. This method yields statistics on the frequency at which different types of dynamical behaviors occur in the signaling network, and also provides a measure of robustness. Briefly, we defined an interval for each parameter (Table 4) and randomly selected the parameters values from within this range. Whenever possible, we defined biologically plausible ranges for the parameters. For each component of the cell cycle network being examined, we then randomly selected 100,000 sets of parameter values, and analyzed the corresponding dynamics for each parameter set according to the criteria defined above.
RESULTS
The Results are divided into three sections. First, we describe the dynamical behaviors exhibited by the cell cycle model illustrated in Fig. 1 A, with the positive feedback loops caused by CDC25, wee1, and CAK all active, either with or without the presence of negative feedback due to SCF-SKP2 or APC-CDC20. Next we examine how multisite phosphorylation of key phosphoproteins in the various feedback loops influence dynamical behaviors using the random parameter search method. Finally, we examine three simplified representations of CDK regulation to determine how faithfully they represent the fully detailed model.
Dynamical behaviors of the cell cycle signaling network
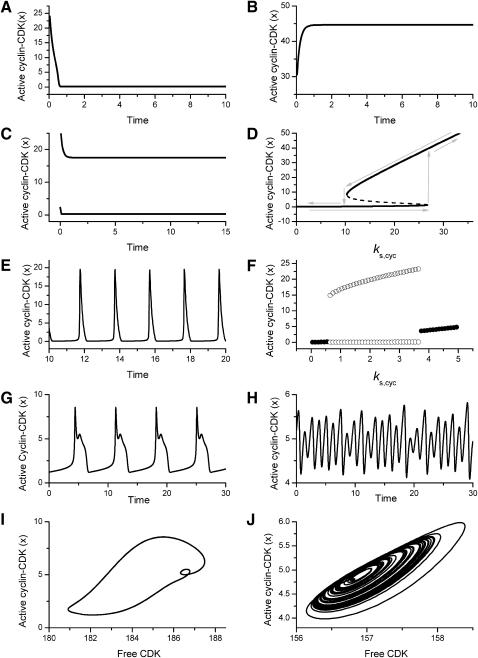
Fig. 3 summarizes types of dynamical behaviors observed in the cell cycle signaling network in Fig. 1 A for different parameter settings, using active cyclin-CDK complex as the readout. The following behaviors were observed:
The steady state of active cyclin-CDK equilibrated to a stable low activity level, regardless of the initial conditions (Fig. 3 A).
The steady state of active cyclin-CDK equilibrated to a stable high activity level, starting from any initial conditions (Fig. 3 B).
Multiple steady-state solutions of active cyclin-CDK coexisted. In the case of bistability, there were two stable solutions, and cyclin-CDK activity could remain in either the low or high state, depending on the initial conditions (Fig. 3, C and D).
Active cyclin-CDK oscillated periodically as a limit cycle (Fig. 3, E and F).
Active cyclin-CDK oscillated in a complex (i.e., more than period-1) manner (Fig. 3, G–J). Complex oscillations were observed exclusively in the presence of negative feedback due to SCF-SKP2 or APC-CDC20.
FIGURE 3.
Dynamical behaviors from the signaling transduction network shown in Fig. 1. (A–D) Active cyclin-CDK (x) versus time at different dynamical regimes. (A) Stable low kinase activity. (B) Stable high kinase activity. (C) Bistability. Starting from different initial conditions, the system approached to different steady state. (D) Bifurcation diagram of bistability. Dashed segment is the unstable steady state. Shaded arrows indicate the hysteresis loop. (E) Limit cycle oscillation. (F) Bifurcation diagram of limit cycle. Solid circles are stable steady states and open circles are the maxima and minima of the limit cycle oscillation. (G) Complex (period-2) dynamical behavior. (H) Complex (chaotic) dynamical behavior. (I) Active cyclin-CDK versus free CDK for the period-2 dynamics in G. (J) Active cyclin-CDK versus free CDK for the chaotic oscillations in H. The parameters for A–D are:  = 0.5,
  = 8.64,
  = 0.094,
  = 0.72,
  = 0.75,
  = 0.57,
  = 15.8,
  = 1/3,
  = 3.92,
  = 1/3,
  = 26.31,
  = 1/3,
  = 0.215,
  = 0.8,
  = 0.085,
  = 0.8,
  = 0.06,
  = 0.37,
  = 6.3,
  = 7.6,
  = 5.6,
  = 5.2,
  = 2.5,
  = 7.4, α0 = 0.015, α1 = 0.015, α2 = 1, β0 = 1, β1 = 0.72, β2 = 0.19, γ0 = 0.02, γ1 = 0.91, and γ2 = 1. The parameters for E and F are:
  = 0.5,
  = 0.4,
  = 0.33,
  = 0.83,
  = .013,
  = 1,
= 1,  = 24.8,
  = 1/3,
  = 5.6,
  = 1/3,
  = 24.5,
  = 1/3,
  = 0.12,
  = 0.65,
  = 0.82,
  = 0.74,
  = 0.74,
  = 0.17,
  = 7.9,
  = 0.31,
  = 9.5,
  = 3.5,
  = 5.2,
  = 9.0, α0 = 0.011, α1 = 0.61, α2 = 1, β0 = 1, β1 = 0.70, β2 = 0.19, γ0 = 0.0058, γ1 = 0.26, and γ2 = 1. The cyclin synthesis rate in each panel is: (A)
  = 8.0; (B)
  = 30; (C)
  = 13.9; and (E)
  = 1.92. The parameters for G and I are:
  = 12.4,
  = 0.83,
  = 0.27,
  = 6.65,
  = 0.99,
  = 0.9,
  = 0.14,
  = 28.9,
  = 1/3,
  = 93,
= 93,  = 71.8,
  = 7.74,
  = 1/3,
  = 77.4,
  = 14,
= 14,  = 32.7,
  = 1/3,
  = 70.9,
  = 17.7,
  = 5.0,
  = 2.0,
  = 0.23,
  = 0.18,
  = 0.625,
  = 0.78,
  = 0.9,
  = 0.19,
  = 9.5,
  = 4.8,
  = 7.1,
  = 10,
= 10,  = 1.15,
  = 4.23, α0 = 0.07, α1 = 0.155, α2 = 1, β0 = 1, β1 = 0.81, β2 = 0.1, γ0 = 0.02, γ1 = 0.76, γ2 = 1, and τ = 20. The parameters for H and J are:
  = 32.98,
  = 0.1,
  = 0.365,
  = 9.94,
  = 0.33,
  = 0.965,
  = 0.164,
  =19.1,
  = 1/3,
  = 99.9,
  = 97.5,
  = 8.68,
  = 1/3,
  = 86.8,
  = 88.9,
  = 29.96,
  = 1/3,
  = 79.3,
  = 39.45,
  = 5.0,
  = 1.0,
  = 0.07,
  = 0.07,
  = 0.71,
  = 0.054,
  = 0.066,
  = 0.0065,
  = 6.29,
  = 6.58,
  = 6.14,
  = 2.4,
  = 0.94,
  = 1.27, α0 = 0.134, α1 = 0.118, α1 = 1, β0 = 1, β1 = 0.298, β2 = 0.07, γ0 = 0.013, γ1 = 0.34, γ2 = 1.0, and τ = 20.
To show where these dynamics were located in parameter space, Fig. 3, D and F, illustrate the steady state of active cyclin-CDK (x) versus the cyclin synthesis rate ks,cyc, while keeping other parameters fixed. In Fig. 3 D, for the low ks,cyc range, there is a single stable steady state of low kinase activity, from which the example in Fig. 3 A was chosen. In the intermediate range of ks,cyc, there are three steady-state solutions. The upper and lower steady states are stable and the middle one is unstable, corresponding to the bistability case shown in Fig. 3 C. For large ks,cyc, there is a single stable steady state of high kinase activity, corresponding to Fig. 3 B. In this case, if ks,cyc is increased from a small value gradually, the kinase activity (x) will suddenly jump up to the high state at the end of the bistable regime, but if ks,cyc is decreased from a large value gradually, the kinase activity will jump back to the low kinase state at the other end of the bistable regime, forming a hysteresis loop (see the shaded arrows in Fig. 3 D). Fig. 3 F shows the analogous graph for limit cycle obtained with a different set of parameter values. The intermediate range of ks,cyc produces a limit cycle regime.
Effects of multisite phosphorylation on dynamical behavior
Case 1: positive feedback restricted to CDC25
In this case, positive feedback by CDC25 was the only feedback loop in the network. kwee1 and kcak were set to constant values, randomly chosen in the same way as other rate constants in the simulation. Assuming that CDC25 had only one phosphorylation site, then using the random search algorithm (see Methods) with 100,000 searches, we found only 32 parameter sets that exhibited bistable solutions and 11 with limit cycle solutions (Case 1: CDC25_1p in Table 1). If we assumed that CDC25 had two phosphorylation sites, the number of parameter sets exhibiting bistable solutions increased 20-fold to 796, and the number exhibiting limit cycle solutions increased fourfold to 40 in the same number of searches (Case 1: CDC25_2p in Table 1). For the case in which CDC25 had five phosphorylation sites, 2090 cases exhibited bistable solutions and 1467 cases exhibited limit cycle solutions (Case 1: CDC25_5p in Table 1). Therefore, as the number of phosphorylation sites on CDC25 increased, progressively more bistable and limit cycle solutions occurred, demonstrating that multisite phosphorylation plays a key role in generating dynamical instabilities.
TABLE 1.
Incidence of bistability (BS) and limit cycles (LC) among 100,000 random searches, for Cases 1–4 (positive feedback only)
| Hypothetical cases | BS | LC |
|---|---|---|
| Case 1: CDC25_1p | 32 | 11 |
| Case 1: CDC25_2p | 796 | 40 |
| Case 1: CDC25_5p | 2090 | 1467 |
| Case 2: wee1_1p | 1 | 0 |
| Case 2: wee1_2p | 90 | 12 |
| Case 2: wee1_5p | 3223 | 476 |
| Case 3: CAK_1p | 0 | 0 |
| Case 3: CAK_2p | 20 | 0 |
| Case 3: CAK_5p | 437 | 0 |
| Case 4: CDC25_1p + wee1_1p | 224 | 25 |
| Case 4: CDC25_1p + wee1_1p + CAK_1p | 729 | 40 |
| Case 4: CDC25_2p + wee1_2p + CAK_1p | 3639 | 125 |
| Case 4: CDC25_2p + wee1_2p + CAK_2p | 4131 | 134 |
| Case 4: CDC25_5p + wee1_5p + CAK_1p | 1313 | 750 |
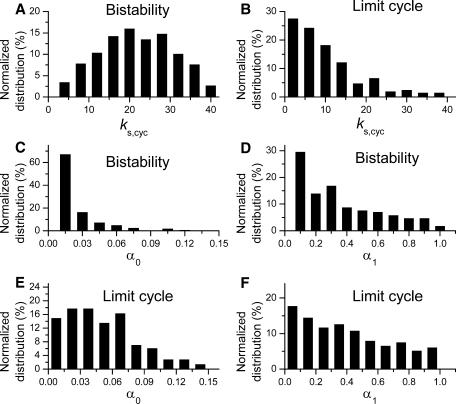
To illustrate the characteristics of the parameter values causing these dynamics, we plotted histograms for certain parameters in Fig. 4, for Case 1: CDC25_2p. Fig. 4, A and B, show the distribution of cyclin synthesis rates (ks,cyc) at which bistability and limit cycle dynamics were favored. Limit cycles tended to occur at lower cyclin synthesis rates (average rate 9.97) than bistability (average rate 19.8).
FIGURE 4.
Histogram of key parameters for Case 1: CDC25_2p. (A and B) Cyclin synthesis rate ks,cyc distributions for bistable (〈ks,cyc〉 = 19.8) and limit cycle (ks,cyc = 9.97) dynamics. (C and D) Distributions of α0 (kinase activity of unphosphorylated CDC25, 〈α0〉 = 0.0016) and α1 (kinase activity of one-site phosphorylated CDC25, 〈α1〉 = 0.3) for bistability. (E and F) Distributions of α0 (〈α0〉 = 0.05) and α1 (〈α1〉 = 0.39) for limit cycle.
To evaluate the importance of cooperativity in multisite phosphorylation of CDC25, Fig. 4, C and D, show the distributions of kinase activities of unphosphorylated CDC25 (α0) or CDC25 phosphorylated at one site (α1), which yielded bistable or limit cycle solutions. In these simulations, CDC25 had two phosphorylation sites, with the doubly phosphorylated state having maximum activity (i.e., α2 = 1). No cooperativity between phosphorylation sites in activating kinase activity corresponds to α0 = 0 and α1 = α2 = 1, whereas positive cooperativity corresponds to 0 < α 1 < α2 = 1. For bistability to occur, α0 had to be very small (mostly <0.03, with an average value of 0.016), whereas α1 could range from 0 to 1 (average value 0.31). Thus, unphosphorylated CDC25 had to be 20 times (∼0.31/0.016) less active than the singly phosphorylated CDC25 and 62 (∼1/0.016) times less active than the doubly phosphorylated CDC25 for bistability to occur. Similar results were obtained for limit cycle dynamics (Fig. 4, E and F), which also required that α0 is much smaller than α1 and α2. This dynamical requirement agrees with the experimental finding that CDC25 kinase activity is much higher when phosphorylated (Kumagai and Dunphy, 1992). For either bistability or limit cycle dynamics, however, α1 and α2 could both have values near the maximum of 1. Thus, positive cooperativity between the first and second phosphorylation sites in CDC25 kinase activity (i.e., producing to a higher Hill coefficient) was not very important.
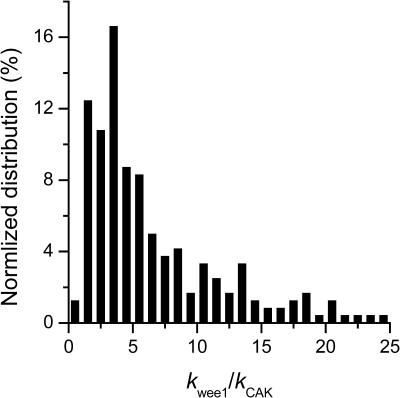
The average rates of CDC25 phosphorylation and dephosphorylation in these simulations (az1/[CDC25]T, az1/[CDC25]T, and  respectively) were 0.011, 0.12, and 1.2, close to experimental estimates (Marlovits et al., 1998). Since both wee1 and CAK can phosphorylate CDK, it is interesting to examine the relationship between their relative kinase activities during the above dynamics. Fig. 5 shows the distribution of kwee1/kcak when bistability occurred in Case 1: CDC25_2p. Both kwee1 and kcak were randomly chosen to have values from 0 to 10. More than 98% of kwee1/kcak ratios were >1, with an average value of 8.25. This indicates that phosphorylation of the Thr-14 and Try-15 has to be much faster than the phosphorylation of Thr-160 or Thr-161. We are not aware whether there is experimental data to support this prediction.
FIGURE 5.
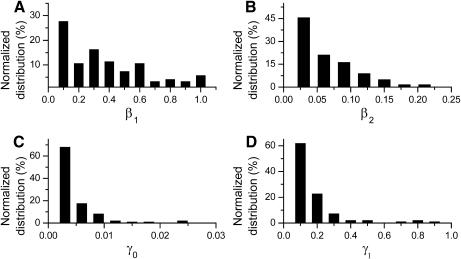
(A and B) Distributions of β1 (kinase activity of one-site phosphorylated wee1, 〈β1〉 = 0.33) and β2 (kinase activity of two-site phosphorylated wee1, 〈β2〉 = 0.049) for bistability in Case 2: wee1_2p. (C and D) Distributions of γ0 (kinase activity of unphosphorylated CAK, 〈γ0〉 = 0.0029) and γ1 (kinase activity of one-site phosphorylated CAK, 〈γ1〉 = 0.12) for bistability in Case 3: CAK_2p.
In summary, the incidence of bistability and limit cycles increased dramatically as the number of CDC25 phosphorylation sites increased, but the steepness of kinase activity (i.e., positive cooperativity between phosphorylation sites) did not play a major role.
Case 2: positive feedback restricted to wee1
In this case, the positive feedback (actually double-negative) feedback facilitated by wee1 was the only feedback loop present in the network, with kcdc25 and kcak set as randomly chosen constants. For only one phosphorylation site on wee1, we found one bistable solution and no limit cycles in 100,000 searches (Case 2: wee1_1p in Table 1). For two phosphorylation sites, there were 90 cases of bistability and 12 cases of limit cycles (Case 2: wee1_2p in Table 1). For five phosphorylation sites, however, there was a dramatic increase to 3223 cases of bistability and 476 cases of limit cycles (Case 2: wee1_5p in Table 1).
Fig. 6, A and B, show the influence of positive cooperativity between the phosphorylation sites in deactivating wee1 kinase activity, for the case in which wee1 had two phosphorylation sites (Case 2: wee1_2p). For bistability to occur, β2 (average value 0.049) had to be much smaller than β1 (average value 0.33) and β0 (= 1). Similar results were obtained for limit cycles. Thus, phosphorylated wee1 had to have much lower kinase activity than unphosphorylated wee1 for bistability or limit cycles. This finding agrees with the experimentally measured properties of wee1, which has much lower kinase activity when phosphorylated than when unphosphorylated. However, β1 could have a value near 1, so that positive cooperativity between the singly and doubly phosphorylated wee1 in inactivating wee1's kinase activity was not critically important.
FIGURE 6.
Distribution of kwee1/kcak for bistability in Case 1: CDC25_2p. The average ratio 〈kwee1/kcak〉 = 8.25.
Case 3: positive feedback restricted to CAK
In this case, the positive feedback facilitated by CAK was the only feedback loop present in the network, with kcdc25 and kwee1 set as randomly chosen constants. With only one CAK phosphorylation site, we did not find any cases of bistability, limit cycles, or other interesting dynamics in 100,000 searches (Case 3: CAK_1p in Table 1). For more than one phosphorylation site, however, both bistability and limit cycles were observed (Case 3: CAK_2p and Case 3: CAK_5p in Table 1), although less frequently than when positive feedback was due to CDC25 or wee1. Fig. 6, C and D, show that positive cooperativity between the kinase activity of unphosphorylated CAK (γ0, average value 0.029), singly phosphorylated CAK (γ1, average value 0.12), and doubly (γ2 = 1) phosphorylated CAK was more important for dynamics arising from CAK-positive feedback than for CDC25 or wee1. The reason is because the dephosphorylation or phosphorylation of CDK by CDC25 or wee1 involves two CDK sites, whereas CAK only phosphorylates one CDK site. Therefore, the cooperativity in the case of CDC25 or wee1 exists in CDK phosphorylation/dephosphorylation, but it has to be generated from multistep CAK phosphorylation in the case of CAK-positive feedback.
Case 4: combined positive feedback loops from CDC25, wee1, and CAK
We first studied the case in which both CDC25 and wee1 gave rise to positive feedback loops, but CAK did not (i.e., kcak was a randomly chosen constant). For one phosphorylation site on both CDC25 and wee1 (Case 4: CDC25_1p + wee1_1p in Table 1), the incidence of both bistability and limit cycles in the 100,000 searches increased substantially (compare to Case 1: CDC25_1p or Case 2: wee1_1p in Table 1). If positive feedback by CAK with one phosphorylation site was added as well, bistable and limit cycle cases increased further (Case 4: CDC25_1p + wee1_1p + CAK_1p in Table 1). For two phosphorylation sites on CDC25, wee1, and CAK, the incidence increased further (Case 4: CDC25_2p + wee1_2p + CAK_2p in Table 1). With five phosphorylation sites on CDC25 and wee1, however, the incidence of bistability decreased, whereas the incidence of limit cycles increased further (Case 4: CDC25_5p + wee1_5p + CAK_1p in Table 1).
Case 5: dynamics caused by positive feedback interacting with negative feedback
Without the presence of negative feedback loops, bistability was the most commonly observed dynamical behavior (Table 1). In a previous study (Qu et al., 2003a), we found that when the negative feedback was facilitated by SCF-SKP2 or APC-CDC20, bistability was converted to limit cycle behavior. Here we evaluate the generality of this finding using the random search strategy. Table 2 summarizes the incidence of bistability, limit cycles, and complex oscillations for four negative feedback schemes, operating on free cyclin only (Case 5a: kd1u = ku, kd2u = kd3u = 0), on free cyclin and inactive cyclin-CDK (Case 5b: kd1u = kd2u = ku, kd3u = 0), on active cyclin-CDK only (Case 5c: kd1u = kd2u = 0, kd3u = ku), and on all forms of cyclin (Case 5d: kd1u = kd2u = kd3u = ku). The positive feedback case was CDC25_2p + wee1_2p + CAK_1p. The biological rationale for these negative feedback schemes is that SCF binds to phosphorylated cyclin and APC binds to free cyclin to target them for ubiquitination (Peters, 1998). In addition, cyclins in different forms are degraded using different pathways (Clurman et al., 1996; Winston et al., 1999). Table 2 shows that, in general, as the strength of the negative feedback increased, the incidence of bistable solutions decreased and the incidence of limit cycle solutions increased. These findings support the idea that negative feedback converts bistability to limit cycle behavior. The ability of negative feedback to promote limit cycle is well known in biological systems (Goldbeter, 2002; Tyson et al., 2002), and has been previously proposed as a mechanism of the cell cycle machinery (Cross et al., 2002; Pomerening et al., 2003; Qu et al., 2003a; Sha et al., 2003; Tyson and Novak, 2001). Here we demonstrate using the random search method that this proposed mechanism is robust in the model shown in Fig. 1 A.
TABLE 2.
Incidence of bistability (BS), limit cycles (LC), and complex oscillations (C) among 100,000 random searches, for Cases 5, a–d (both positive and negative feedback loops)
| Case 5a
|
Case 5b
|
Case 5c
|
Case 5d
|
||||||
|---|---|---|---|---|---|---|---|---|---|
| Negative feedback strength | BS | LC | BS | LC | BS | LC | BS | LC | C |
| ku = 0 | 3639 | 125 | 3639 | 125 | 3639 | 125 | 3639 | 125 | 0 |
| ku = 10 | 3444 | 181 | 1398 | 1334 | 1906 | 530 | 725 | 1794 | 64 |
| ku = 20 | 3354 | 249 | 628 | 2932 | 1321 | 940 | 308 | 2881 | 38 |
| ku = 50 | 3120 | 404 | 152 | 5443 | 741 | 1470 | 77 | 3510 | 5 |
| ku = 80 | 2924 | 532 | 61 | 6349 | 524 | 1684 | 34 | 3403 | 5 |
The inclusion of negative feedback into the model also had another important consequence. Without negative feedback, we did not find any examples of complex oscillations in all our searches. With negative feedback present, however, complex oscillations were observed, although infrequently (Table 2). Fig. 3, G and I, show a period-2 oscillation in active cyclin-CDK versus time and active cyclin-CDK versus free CDK. Fig. 3, H and J, show a chaotic oscillation in active cyclin-CDK versus time and active cyclin-CDK versus free CDK.
Dynamics of simplified models of CDK regulation by phosphorylation
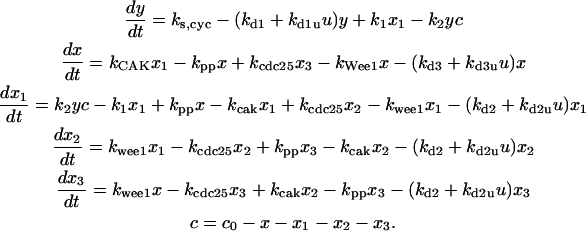
In their M phase cell cycle model of Xenopus oocytes, Marlovits et al. (1998) assumed that Thr-14 and Tyr-15 on CDK were phosphorylated and dephosphorylated simultaneously, and thus could be considered as one step. We refer to this simplified model as Model A (Fig. 1 B). In their cell cycle models of yeast (Chen et al., 2000; Novak and Tyson, 1997; Tyson and Novak, 2001) and other cell cycle models (Ciliberto et al., 2003; Ciliberto and Tyson, 2000), Tyson and colleagues assumed that cyclin binds to CDK to form an active complex, which is inactivated by wee1 and reactivated by CDC25. We refer to this model as Model B (Fig. 1 C). A third model first proposed by Solomon and colleagues (Solomon et al., 1990; Solomon and Kaldis, 1998) and used in a number of cell cycle modeling studies (Aguda and Tang, 1999; Pomerening et al., 2003; Qu et al., 2003a,b) assumes that cyclin binds to CDK to form an inactive complex, which is activated by CDC25 and inactivated by wee1. We refer to this model as Model C (Fig. 1 D).
To compare Models A–C, we used the random search method and the same regulation schemes for CDC25, wee1, CAK, and SCF-SKP2 or APC-CDC20 shown in Fig. 2. Table 3 summarizes the results. When the positive feedback was facilitated by CDC25 (Case 1) and CDC25 had only one phosphorylation site, no dynamical instability occurred for any of the three simplified models (Case 1: CDC25_1p in Table 3). This differed from the full scheme, in which one-step phosphorylation of CDC25 was enough to cause dynamical instabilities (Case 1: CDC25_1p in Table 1). The reason is that in the full scheme, Thr-14 and Tyr-15 on CDK are phosphorylated in two steps, producing a nonlinear CDK activation pattern. In all the simplified models, however, CDK phosphorylation is condensed into one step, making its activation linear. Thus, if CDC25 was also linear (i.e., Hill coefficient = 1), there was no nonlinear element in the network to generate dynamics. With two or more CDC25 phosphorylation sites to create nonlinear CDC25 activation, however, dynamical instabilities could be generated. Positive feedback by either wee1 or CAK alone (Cases 2 and 3), or by the combination of CDC25, wee1 and CAK (Case 4) also required at least two phosphorylation sites in one of these feedback loops to generate dynamics.
TABLE 3.
Incidence of bistability (BS) and limit cycles (LC) among 100,000 random searches, using simplified models A–C simulating multisite phosphorylation
| Model A
|
Model B
|
Model C
|
||||
|---|---|---|---|---|---|---|
| Hypothetical cases | BS | LC | BS | LC | BS | LC |
| Case 1: CDC25_1p | 0 | 0 | 0 | 0 | 0 | 0 |
| Case 1: CDC25_2p | 27 | 3 | 7 | 2 | 82 | 3 |
| Case 2: wee1_1p | 0 | 0 | 0 | 0 | 0 | 0 |
| Case 2: wee1_2p | 6 | 0 | 5 | 0 | 6 | 0 |
| Case 3: CAK_1p | 0 | 0 | - | - | - | - |
| Case 3: CAK_2p | 14 | 0 | - | - | - | - |
| Case 4: CDC25_1p + wee1_1p | 0 | 0 | 0 | 0 | 0 | 0 |
| Case 4: CDC25_2p + wee1_2p + CAK_1p | 577 | 35 | 121 | 0 | 437 | 20 |
| Case 5d: positive + negative feedback | 33 | 611 | 2 | 0 | 9 | 595 |
| Case 5b: positive + negative feedback | 40 | 557 | 36 | 100 | 53 | 2275 |
When more than one positive feedback mechanism with at least two phosphorylation sites was present (Case 4), Model A and Model C generated a higher incidence of bistability and limit cycles than Model B. Moreover, the addition of negative feedback (Case 5) converted the bistability to (and generated additional) limit cycles in Models A and C, but not in Model B. For Model B, the negative feedback in Case 5d stabilized the system by substantially reducing the incidence of bistable solutions (Table 3).
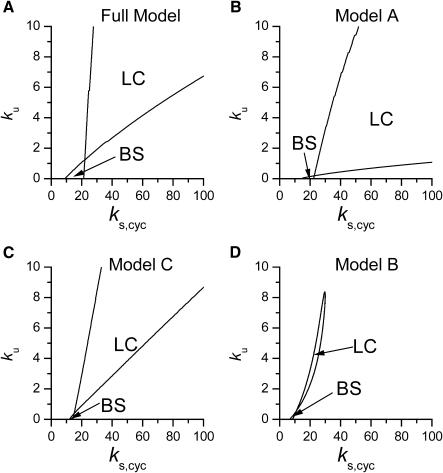
To further compare the dynamical behaviors of these simplified models to that of the full scheme, Fig. 7 shows phase diagrams for the full model and models A–C in the two-parameter space of cyclin synthesis rate (ks,cyc) and negative feedback strength (ku). The full model, Model A, and Model C shared similar phase diagrams but Model B had much smaller regions of dynamics. This explains why randomly searching the parameter space detected less dynamics than in the other models. Based on this analysis, we conclude that, to preserve dynamics, Model A and Model C are superior simplified representations of the full scheme than Model B.
FIGURE 7.
Phase diagram in the parameter space of cyclin synthesis rate ks,cyc and negative feedback strength ku(kd1u = kd2u = ku, kd3u = 0). BS marks the bistable region and LC marks the limit cycle region. (A) The full model in Fig. 1 A. (B) Simplified Model A in Fig. 1 B. (C) Simplified Model C in Fig. 1 D. (D) Simplified Model B in Fig. 1 C. The parameters for the Full model and Model A are:  = 0.5,
  = 7.5,
  = 0.96,
  = 0.7,
  = 0.78,
  = 0.2,
  = 24.5,
  = 1/3,
  = 16,
= 16,  = 3.1,
  = 2.9,
  = 1/3,
  = 97,
= 97,  = 95,
= 95,  = 9.1,
  = 1/3,
  = 96,
= 96,  = 68,
= 68,  = 5.0,
  = 0,
= 0,  = 0.39,
  = 0.22,
  = 0.18,
  = 0.077,
  = 0.007,
  = 0.79,
  = 2.0,
  = 2.0,
  = 3.5,
  = 7.2,
  = 9.68,
  = 1.56, α0 = 0.0044, α1 = 0.36, α2 = 1, β0 = 1, β1 = 0.027, β2 = 0.198, γ0 = 0.005, γ1 = 0.31, γ2 = 1, and τ = 20. The parameters for Model C are the same as above except
  The parameters for Model B are
  = 0.8,
  = 5.3,
  = 0.48,
  = 0.42,
  = 0.38,
  = 0.26,
  = 8.0,
  = 1/3,
  = 54,
= 54,  = 42,
= 42,  = 7.2,
  = 1/3,
  = 42,
= 42,  = 4.7,
  = 5.0,
  = 0,
= 0,  = 0.88,
  = 0.08,
  = 0.5,
  = 0.86,
  = 1.6,
  = 1.3,
  = 3.7,
  = 6.6, α0 = 0.02, α1 = 0.24, α2 = 1, β0 = 1, β1 = 0.19, β2 = 0.1, and τ = 20.
DISCUSSION
Multisite phosphorylation and cell cycle dynamics
In this study, we used a random search strategy to analyze the dynamics of a complex signaling network underlying the eukaryotic cell cycle. Various hypothetical conditions were simulated to investigate the conditions required for this network to generate dynamical instabilities, focusing on the role of multisite phosphorylation of key proteins regulating CDK activity. Multisite phosphorylation has been shown to be an important mechanism underlying ultrasensitive biological responses (Deshaies and Ferrell, 2001; Ferrell, 1996; Huang and Ferrell, 1996), and in a previous simplified model (Qu et al., 2003b), we proposed that multisite phosphorylation of CDC25 was critical for the CDK signaling module to generate bistability and limit cycle behavior. Here we show that multisite phosphorylation of CDK, CDC25, or wee1 can also generate these dynamical behaviors. It is interesting to note that although many proteins regulating CDK activity contain more than two phosphorylation sites, our modeling results suggest that the incidence of dynamics was not greatly affected either by positive cooperativity between the first two sites, nor by additional sites beyond the first two. In fact, for Case 4 in which all the positive feedback loops were present, increasing the number of phosphorylation sites on CDC25 and wee1 from two to five decreased the combined incidence of bistability and limit cycles (Table 3).
Experimental evidence supports the importance of multisite phosphorylation in normal cell cycle function. Karaiskou et al. (1999) showed that the second stage phosphorylation of CDC25 was necessary for the amplification of maturation promoting factor. A recent study by Garrett et al. (2001) showed that Thr-170 and Ser-164 in CDK7 (CAK is a complex of cyclin H and CDK7) are phosphorylated independently by CDK1 and CDK2, but it is not clear whether the phosphorylation at both sites is required for CAK activation. Multisite phosphorylation on CDK inhibitor has also been shown to play a critical role in cell cycle regulation (Deshaies and Ferrell, 2001; Nash et al., 2001).
Simplified mathematical models of CDK regulation in the cell cycle
A number of mathematical models for cyclin and CDK regulation in the cell cycle have been proposed. In these models, two major mechanisms for cell cycle dynamics have been identified: negative feedback causing a limit cycle oscillation (Goldbeter, 1991), and negative feedback-facilitated hysteresis along a bistable solution (Tyson and Novak, 2001). Recent experiments (Cross et al., 2002; Pomerening et al., 2003; Sha et al., 2003) have demonstrated that bistability and hysteresis occur in dividing cells. In agreement with the latter mechanism, we find that bistability is the major dynamical behavior in our model of the CDK signaling network, and negative feedback changes bistability into limit cycle behavior. However, the former mechanism could also be true in our model, since negative feedback caused a greater increase in limit cycle cases than could be accounted from by the decrease in bistable cases (Tables 2 and 3).
Among the simplified CDK regulation models, Model A (Fig. 1 B) used for Xenopus oocytes by Tyson and colleagues (Marlovits et al., 1998) and Model C (Fig. 1 D) proposed by Solomon (Solomon et al., 1990; Solomon and Kaldis, 1998) closely agree with the full model (Fig. 1 A). However, Model B (Fig. 1 C) used by Tyson and colleagues in their cell cycle models of yeast (Chen et al., 2000; Novak and Tyson, 1997; Tyson and Novak, 2001) and other cell cycle models (Ciliberto et al., 2003; Ciliberto and Tyson, 2000) differed substantially from the full scheme. In their cell cycle models, bistability is mainly caused by the positive feedback between CDK and APC-CDH1 (Tyson and Novak, 2001) rather than by CDK phosphorylation and dephosphorylation. Although this does not affect the ability of negative feedback to turn the dynamics into a hysteresis loop, it is biologically important to pinpoint the exact molecular mechanism responsible for the occurrence of bistability.
Robustness of cell cycle dynamics
Biological signaling networks are often too complex for intuition alone to be of much help in understanding their underlying mechanisms. Mathematical modeling can play an essential role in providing a systematic approach for analyzing this complexity. However, as mathematical models become progressively more complex, as needed to faithfully represent the biological complexity, the ability to analyze their range of dynamical behaviors systematically also becomes increasingly more challenging. In addition, experimental values of many of the rate constants in the signaling network have not been determined, and even when they have been measured, they often differ substantially under different experimental conditions and between species. To compensate for this uncertainty in the biologically correct values of rate constants, we randomly selected parameter values from a predefined biologically plausible range to identify different dynamics. This method allowed us to explore a large parameter space to identify the range of possible dynamics in the CDK signaling network. We found that combining multiple feedback loops caused bistability and limit cycle dynamics to occur over a progressively larger parameter space, but only rarely caused complex dynamics. Bistability (with no negative feedback) and limit cycles (with negative feedback present) were the prevailing dynamics, whereas complex oscillations were rare. This suggests that the cell cycle network can couple together multiple signaling components with positive or negative feedback pathways without destabilizing the network by inducing complex dynamics. That is, bistability and limit cycles are robust dynamical behaviors in this model. Robustness is critically important in complex biological systems (Barkai and Leibler, 1997; Carlson and Doyle, 2002; Hasty et al., 2001; Kitano, 2002), to ensure that the cell's essential biological functions are preserved in the face of external perturbations or defects.
SUMMARY
Our findings support the hypothesis that multisite phosphorylation of proteins is a critical biological mechanism underlying the ultrasensitive response required to generate dynamics in the cell cycle, and probably in other complex biological signaling networks as well. An important implication is that feedback loops based on multisite phosphorylation may be key therapeutic targets for influencing network dynamics in complex biological systems. In addition, using a random search strategy, we have shown that in the case of the cell cycle network, many dynamically active subsystems can be combined without destabilizing network dynamics, and may actually enhance robustness.
Acknowledgments
This study was supported by funds from the University of California, Los Angeles, Department of Medicine and by the Kawata and Laubisch Endowments.
APPENDIX
The mathematical models are formulated according to the signaling pathways shown in Figs. 1 and 2. We used the law of mass action for biochemical reactions to write the differential equations (Keener and Sneyd, 1998). All models share the same differential equations for CDC25, wee1, and CAK. The parameter ranges that were used for our simulations are shown in Table 4. The variables and rate constants in all the equations are labeled in Figs. 1 and 2, unless otherwise specified below.
TABLE 4.
Assigned intervals for parameters in the model
| Parameter | Range | Parameter | Range |
|---|---|---|---|
 |
0–40 |  |
0–10 |
 |
0–1 |  |
0–1 |
 |
0–10 |  |
0–1 |
 |
0–1 |  |
0–1 |
 |
0–1 |  |
0–1 |
 |
0–1 |  |
0–1 |
 |
0–1 |  |
0–1 |
 |
0–10 |  |
0–10 |
 |
0–10 |  |
0–10 |
 |
0–10 |  |
0–10 |
 |
0–40 |  |
0–10 |
 |
0–100 |  |
0–10 |
 |
0–100 |  |
0–10 |
 |
0–10 | α0 | 0–0.15 |
 |
0–100 | α1 | 0–1 |
 |
0–100 | β1 | 0–1 |
 |
0–40 | β2 | 0–0.25 |
 |
0–100 | γ0 | 0–0.03 |
 |
0–100 | γ1 | 0–1 |
| Fixed constants | |||
 = 1/3 = 1/3 |
 = 1/3 = 1/3 |
 = 1/3 = 1/3 |
c0 = 200 |
| τ = 20 | α2 = 1 | β0 = 1 | γ2 = 1 |
Differential equations for the full model
The differential equations governing the regulation of cyclin and CDK are (according to Fig. 1 A):
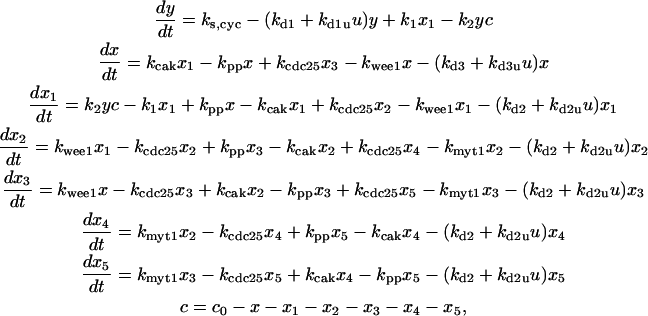 |
(A) |
where c is the free CDK and c0 the total CDK concentrations. The differential equations for CDC25's phosphorylation and dephosphorylation are (according to Fig. 2 A):
 |
(B) |
where  is the rate constant for CDC25 phosphorylation catalyzed by active cyclin-CDK(x),
  is the rate constant for dephosphorylation, and zn is the n-step phosphorylated CDC25. The differential equations for wee1's phosphorylation and dephosphorylation are similar to the differential equations for CDC25, which are (according to Fig. 2 B):
 |
(C) |
where  is the rate constant of wee1 phosphorylation catalyzed by active cyclin-CDK(x),
  is the dephosphorylation rate constant, and wn is the n-step phosphorylated wee1. Similarly, the different equations for CAK are (according to Fig. 2 C):
 |
(D) |
where  is the rate constant for CAK phosphorylation catalyzed by active cyclin-CDK(x),
  is the rate constant for CAK dephosphorylation, and hn is the n-site phosphorylated CAK.
Since we are not interested in multistep phosphorylation in the negative feedback loop, we model the negative feedback phenomenologically and use the differential equation we used previously (Qu et al., 2003a):
 |
(E) |
where KM is Michaelis-Menton constant and τ the time delay.
Differential equations for Model A
The differential equations for Model A are:
 |
(F) |
Differential equations for Model B
The differential equations for Model B are:
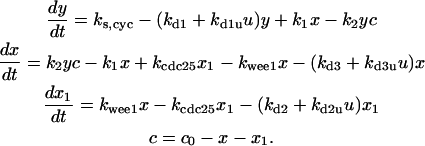 |
(G) |
Differential equations for Model C
The differential equations for Model C are:
 |
(H) |
References
- Aguda, B. D., and Y. Tang. 1999. The kinetic origins of the restriction point in the mammalian cell cycle. Cell Prolif. 32:321–335. [DOI] [PMC free article] [PubMed] [Google Scholar]
- Barkai, N., and S. Leibler. 1997. Robustness in simple biochemical networks. Nature. 387:913–917. [DOI] [PubMed] [Google Scholar]
- Bilodeau, M., H. Talarmin, G. Ilyin, C. Rescan, D. Glaise, S. Cariou, P. Loyer, C. Guguen-Guillouzo, and G. Baffet. 1999. Skp2 induction and phosphorylation is associated with the late G1 phase of proliferating fat hepatocytes. FEBS Lett. 452:247–253. [DOI] [PubMed] [Google Scholar]
- Carlson, J. M., and J. Doyle. 2002. Complexity and robustness. Proc. Natl. Acad. Sci. USA. 99(Suppl. 1):2538–2545. [DOI] [PMC free article] [PubMed] [Google Scholar]
- Chen, K. C., A. Csikasz-Nagy, B. Gyorffy, J. Val, B. Novak, and J. J. Tyson. 2000. Kinetic analysis of a molecular model of the budding yeast cell cycle. Mol. Biol. Cell. 11:369–391. [DOI] [PMC free article] [PubMed] [Google Scholar]
- Ciliberto, A., M. J. Petrus, J. J. Tyson, and J. C. Sible. 2003. A kinetic model of the cyclin E/Cdk2 developmental timer in Xenopus laevis embryos. Biophys. Chem. 104:573–589. [DOI] [PubMed] [Google Scholar]
- Ciliberto, A., and J. J. Tyson. 2000. Mathematical model for early development of the sea urchin embryo. Bull. Math. Biol. 62:37–59. [DOI] [PubMed] [Google Scholar]
- Clurman, B. E., R. J. Sheaff, K. Thress, M. Groudine, and J. M. Roberts. 1996. Turnover of cyclin E by the ubiquitin-proteasome pathway is regulated by cdk2 binding and cyclin phosphorylation. Genes Dev. 10:1979–1990. [DOI] [PubMed] [Google Scholar]
- Cross, F. R., V. Archambault, M. Miller, and M. Klovstad. 2002. Testing a mathematical model of the yeast cell cycle. Mol. Biol. Cell. 13:52–70. [DOI] [PMC free article] [PubMed] [Google Scholar]
- Deshaies, R. J., and J. E. Ferrell. 2001. Multisite phosphorylation and the countdown to S phase. Cell. 107:819–822. [DOI] [PubMed] [Google Scholar]
- Ferrell, J. E., Jr. 1996. Tripping the switch fantastic: how a protein kinase cascade can convert graded inputs into switch-like outputs. Trends Biochem. Sci. 21:460–466. [DOI] [PubMed] [Google Scholar]
- Ferrell, J. E., Jr., and R. R. Bhatt. 1997. Mechanistic studies of the dual phosphorylation of mitogen-activated protein kinase. J. Biol. Chem. 272:19008–19016. [DOI] [PubMed] [Google Scholar]
- Garrett, S., W. A. Barton, R. Knights, P. Jin, D. O. Morgan, and R. P. Fisher. 2001. Reciprocal activation by cyclin-dependent kinases 2 and 7 is directed by substrate specificity determinants outside the T loop. Mol. Cell. Biol. 21:88–99. [DOI] [PMC free article] [PubMed] [Google Scholar]
- Goldbeter, A. 1991. A minimal cascade model for the mitotic oscillator involving cyclin and cdc2 kinase. Proc. Natl. Acad. Sci. USA. 88:9107–9111. [DOI] [PMC free article] [PubMed] [Google Scholar]
- Goldbeter, A. 2002. Computational approaches to cellular rhythms. Nature. 420:238–245. [DOI] [PubMed] [Google Scholar]
- Hasty, J., D. McMillen, F. Isaacs, and J. J. Collins. 2001. Computational studies of gene regulatory networks: in numero molecular biology. Nat. Rev. Genet. 2:268–279. [DOI] [PubMed] [Google Scholar]
- Hoffmann, I., P. R. Clarke, M. J. Marcote, E. Karsenti, and G. Draetta. 1993. Phosphorylation and activation of human cdc25-C by cdc2–cyclin B and its involvement in the self-amplification of MPF at mitosis. EMBO J. 12:53–63. [DOI] [PMC free article] [PubMed] [Google Scholar]
- Huang, C. Y. F., and J. E. Ferrell. 1996. Ultrasensitivity in the mitogen-activated protein kinase cascade. Proc. Natl. Acad. Sci. USA. 93:10078–10083. [DOI] [PMC free article] [PubMed] [Google Scholar]
- Karaïskou, A., C. Jessus, T. Brassac, and R. Ozon. 1999. Phosphatase 2A and polo kinase, two antagonistic regulators of cdc25 activation and MPF auto-amplification. J. Cell Sci. 112:3747–3756. [DOI] [PubMed] [Google Scholar]
- Keener, J. P., and J. Sneyd. 1998. Mathematical Physiology. Springer, New York.
- Kitano, H. 2002. Systems biology: a brief overview. Science. 295:1662–1664. [DOI] [PubMed] [Google Scholar]
- Kumagai, A., and W. G. Dunphy. 1992. Regulation of the cdc25 protein during the cell cycle in Xenopus extracts. Cell. 70:139–151. [DOI] [PubMed] [Google Scholar]
- Marlovits, G., C. J. Tyson, B. Novak, and J. J. Tyson. 1998. Modeling M-phase control in Xenopus oocyte extracts: the surveillance mechanism for unreplicated DNA. Biophys. Chem. 72:169–184. [DOI] [PubMed] [Google Scholar]
- Morgan, D. O. 1999. Regulation of the APC and the exit from mitosis. Nat. Cell Biol. 1:E47–E53. [DOI] [PubMed] [Google Scholar]
- Morris, M. C., A. Heitz, J. Mery, F. Heitz, and G. Divita. 2000. An essential phosphorylation-site domain of human cdc25C interacts with both 14-3-3 and cyclins. J. Biol. Chem. 275:28849–28857. [DOI] [PubMed] [Google Scholar]
- Nash, P., X. J. Tang, S. Orlicky, Q. H. Chen, F. B. Gertler, M. D. Mendenhall, F. Sicheri, T. Pawson, and M. Tyers. 2001. Multisite phosphorylation of a CDK inhibitor sets a threshold for the onset of DNA replication. Nature. 414:514–521. [DOI] [PubMed] [Google Scholar]
- Novak, B., and J. J. Tyson. 1997. Modeling the control of DNA replication in fission yeast. Proc. Natl. Acad. Sci. USA. 94:9147–9152. [DOI] [PMC free article] [PubMed] [Google Scholar]
- Peters, J. M. 1998. SCF and APC: the Yin and Yang of cell cycle regulated proteolysis. Curr. Opin. Cell Biol. 10:759–768. [DOI] [PubMed] [Google Scholar]
- Pomerening, J. R., E. D. Sontag, and J. E. Ferrell, Jr. 2003. Building a cell cycle oscillator: hysteresis and bistability in the activation of Cdc2. Nat. Cell Biol. 5:346–351. [DOI] [PubMed] [Google Scholar]
- Press, W. H., S. A. Teukolsky, W. T. Vetterling, and B. P. Flannery. 1992. Numerical Recipes in C: The Art of Scientific Computing. Cambridge University Press, New York.
- Qu, Z., W. R. MacLellan, and J. N. Weiss. 2003a. Dynamics of the cell cycle-checkpoints, sizers and timers. Biophys. J. 85:3600–3611. [DOI] [PMC free article] [PubMed] [Google Scholar]
- Qu, Z., J. N. Weiss, and W. R. MacLellan. 2003b. Regulation of the mammalian cell cycle: a model of the G1-to-S transition. Am. J. Physiol. Cell Physiol. 284:C349–C364. [DOI] [PubMed] [Google Scholar]
- Sha, W., J. Moore, K. Chen, A. D. Lassaletta, C. S. Yi, J. J. Tyson, and J. C. Sible. 2003. Hysteresis drives cell-cycle transitions in Xenopus laevis egg extracts. Proc. Natl. Acad. Sci. USA. 100:975–980. [DOI] [PMC free article] [PubMed] [Google Scholar]
- Solomon, M. J., M. Glotzer, T. H. Lee, M. Philippe, and M. W. Kirschner. 1990. Cyclin activation of p34cdc2. Cell. 63:1013–1024. [DOI] [PubMed] [Google Scholar]
- Solomon, M. J., and P. Kaldis. 1998. Regulation of CDKs by phosphorylation. In Cell Cycle Control. M. Pagano, editor. Springer, Berlin. 79–109. [DOI] [PubMed]
- Tyson, J. J., A. Csikasz-Nagy, and B. Novak. 2002. The dynamics of cell cycle regulation. Bioessays. 24:1095–1109. [DOI] [PubMed] [Google Scholar]
- Tyson, J. J., and B. Novak. 2001. Regulation of the eukaryotic cell cycle: molecular antagonism, hysteresis, and irreversible transitions. J. Theor. Biol. 210:249–263. [DOI] [PubMed] [Google Scholar]
- von Dassow, G., E. Meir, E. M. Munro, and G. M. Odell. 2000. The segment polarity network is a robust developmental module. Nature. 406:188–192. [DOI] [PubMed] [Google Scholar]
- Winston, J. T., C. Chu, and J. W. Harper. 1999. Culprits in the degradation of cyclin E apprehended. Genes Dev. 13:2751–2757. [DOI] [PubMed] [Google Scholar]


