Abstract
The force exerted on a targeting sequence by the electrical potential across the inner mitochondrial membrane is calculated on the basis of continuum electrostatics. The force is found to vary from 3.0 pN to 2.2 pN (per unit elementary charge) as the radius of the inner membrane pore (assumed aqueous) is varied from 6.5 to 12 Å, its measured range. In the present model, the decrease in force with increasing pore width arises from the shielding effect of water. Since the pore is not very much wider than the distance between water molecules, the full shielding effect of water may not be present; the extreme case of a purely membranous pore without water gives a force of 3.2 pN per unit charge, which should represent an upper limit. When applied to mitochondrial import experiments on the protein barnase, these results imply that forces between 11 ± 2 pN and 13.5 ± 2.5 pN catalyze the unfolding of barnase in those experiments. A comparison of these results with unfolding forces measured using atomic force microscopy is made.
INTRODUCTION
Most mitochondrial proteins are encoded in the cell's nuclear DNA, manufactured within the cytosol as precursors, and translocated into mitochondria across the organelle's inner and outer membranes (henceforth IM and OM) through points where the two membranes come into contact. For the basic facts consult Alberts et al. (1994) and Pfanner and Neupert (1990). After translocation, the precursors are sent to the appropriate mitochondrial subcompartment where they are assembled into protein complexes. Most precursors that are targeted to the lumen of the mitochondria, called the matrix, are synthesized with a targeting sequence (TS), also called a presequence, attached at their amino terminus. This TS marks the precursor for translocation. We are concerned with precursors that are folded before import and where the TS protrudes from the precursor. Targeting sequences of this kind always have an abundant number of positively charged residues with few negative ones. As previously suggested (e.g., Martin et al., 1991) the positive charges allow the inner membrane's electric potential to exert a force that is directed into the mitochondrion.
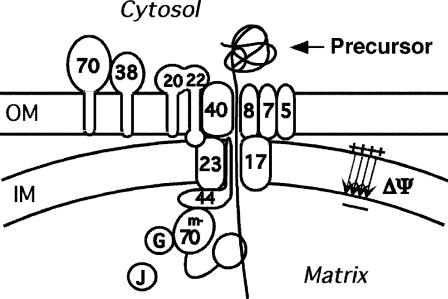
The translocation of protein precursors into mitochondria involve a number of actors (Pfanner and Truscott, 2002) besides the membrane potential; see Fig. 1. The TS first interacts with protein receptors (Tom20 and Tom22) on the surface of the outer membrane. These receptors may promote insertion of the TS into the OM pore, which itself consists of the protein Tom40. The pore of the inner membrane likewise consists of transmembrane proteins (Tim17 and Tim23). A portion of the Tim23 protein that lies exposed on the outer face of the IM appears to facilitate insertion of the TS into the IM pore; the membrane potential activates the insertion (Bauer et al., 1996). The passage of the TS through the IM pore may be driven by thermal motion, the electric field of the membrane potential, interaction with the Tim proteins, or a combination.
FIGURE 1.
Schematic of protein import.
Once the TS has been threaded into both OM and IM pores, the bulk of the protein lying on the outer mitochondrial surface must then unfold. Huang et al. (1999) concluded that the unfolding is initiated at the targeting sequence and that precursor proteins are unraveled sequentially from their N-termini. The unraveling occurs when the targeting sequence engages the unfolding machinery associated with the inner mitochondrial membrane whereas the structured domain remains at the entrance to the import channel. The simplest mechanism by which the import machinery could unravel a protein at a distance would be by pulling at the targeting sequence. Atomic force microscopy (AFM) experiments show that the N-terminus of a protein needs to be pulled only a short distance before the protein denatures. This distance is an empirically defined width of the potential well for unfolding and its values range between 3 and 17 Å for different domains (Best et al., 2001; Rief et al., 1997, 1998).
What pulls the targeting sequence through the required distance? If the TS is long enough to span both membranes and reach sufficiently far into the mitochondrial matrix, then Tim44 in association with mtHsp70 is able to unfold the protein by an ATP-driven action (e.g., Matouschek et al., 2000). Many targeting sequences, however, are not long enough to span both membranes; for instance the total thickness of yeast mitochondrial membranes is at least ≈140 Å. This corresponds to 40 amino acids in the fully extended conformation, whereas the average length of yeast presequences is smaller, ∼31 amino acids (Huang et al., 2002). When targeting sequences are not long enough to interact with mtHsp70, the rate of import of precursor proteins depends upon the strength of the electrical potential and the number of positively charged amino acids (Huang et al., 2002). The simplest implication of this result is that for short targeting sequences, the force exerted by the inner membrane potential upon the charged residues of the targeting sequence unfolds the passenger protein. In this work we investigate this hypothesis by calculating the electrostatic force exerted by the potential and make a preliminary attempt to determine whether it is sufficient to unravel a protein.
MODEL
Computational model
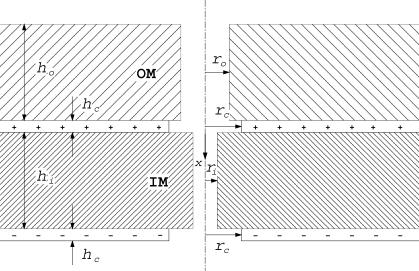
Fig. 2 shows the assumed geometry. Shading denotes membranous regions where the dielectric constant ε = εm = 2. We took hi = ho = 65 Å, a value consistent with electron micrograph pictures (Perkins et al., 1997).
FIGURE 2.
Sketch for computational model. Subscripts: o, outer membrane; i, inner membrane; c, charge layer.
Lack of shading denotes regions of aqueous buffer (ε = εa = 80). These include the cytosol, mitochondrial matrix, and the intermembrane space where the layer of + charge is located. The OM and IM pores are also assumed to be aqueous based on their observed hydrophilic character (see Hill et al., 1998; Truscott et al., 2001). The radius ro of the OM pore was taken to be 12 Å based on reported measurements, namely, between 10 and 13 Å according to Schwartz and Matouschek (1999), 11 Å according to Hill et al. (1998), and 10 Å according to Künkele et al. (1998). Less is known about the radius ri of the IM pore. Schwartz and Matouschek (1999) concluded that ri is at most 10 Å. Here we will consider values in the wider range 6.5 < ri < 12 Å, suggested by Truscott et al. (2001). Since the spacing between water molecules is ∼3 Å, only a few water molecules will be able to occupy the pores. To qualitatively allow for such an effect, values of ri down to 0 Å, representative of a non-aqueous pore, will also be considered.
Proton pumping across the inner mitochondrial membrane leads to layers of charge on its two sides. The buffer in the experiments of Huang et al. (2002) has an ionic concentration of 0.17 M, which is in the physiological range, and implies that the charge layers have a (Debye) thickness of 7 Å (Probstein, 1994). Since this thickness is small compared to the width of the inner membrane, the electric field in the pore will be insensitive to the details of charge distribution within these layers. In the present work we assume that the layers have uniform charge density with thickness hc = 10 Å. The details of the charge distribution can be obtained through solution of a Poisson-Boltzmann equation (Probstein, 1994). The radius rc of the holes in the charged layers was taken to be 10 Å.
A distribution of charge density ρ(x) (per unit volume) in a medium with dielectric constant ε(x) produces an electric field E = −∇Ψ, where Ψ is obtained from the Poisson equation
 |
(1) |
For the value of the mitochondrial membrane potential, ΔΨ, we used 150 mV corresponding to the protein import experiments of Huang et al. (2002). The charge density σ (per unit area) is then inferred to be
 |
(2) |
where 2d = hi + hc is the distance between the charged layers. The volume charge density is then ρ = σ/hc.
Equation 1 was solved numerically using a B-spline Galerkin scheme (Shariff and Moser, 1998) in cylindrical polar coordinates (x, r), where x is the axial coordinate (measured from the entrance of the IM pore and positive into the mitochondrion) and r is the radius. The discretization cells were designed to be small at interfaces where jumps in dielectric constant and charge density occur, and to become larger as the computational boundary is approached. In most runs the smallest computational cell size was 1 Å × 1 Å and the computational domain was x ∈ [−200, 200] Å, r ∈ [0, 110] Å. As a check on accuracy, a computation with half the cell sizes in each direction and twice the radial domain size was also run. The boundary condition ∂Ψ/∂n = 0 was applied at the boundary of the computational domain which is large enough for the boundary condition to be accurate. Here n is the coordinate normal to the boundary. At the symmetry axis we required ∂Ψ/∂r = 0, which is precisely the condition required for an axisymmetric function to have continuous radial derivatives at the axis. Since the Galerkin method is based upon integrals, discontinuous distributions of ε(x) and ρ(x), which occur in the present model, can be treated. At an interface across which ε suffers a jump, En, the component of the electric field normal to the interface, also jumps. Since the computed solution is a projection of the exact solution upon the space of B-splines, this jump leads to some Gibbs oscillation in En. Such oscillation may be witnessed in Fig. 5 and was generally found to be weak.
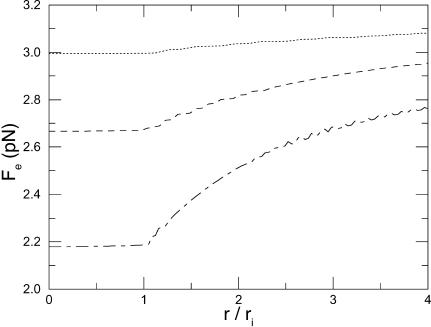
FIGURE 5.
Radial profiles of the force. Dotted line is ri = 3 Å; dashed line is ri = 6.5 Å; long-dash/short-dash line is ri = 12 Å. The profiles are taken at the midsection of the pore. The small oscillation is Gibbs phenomenon, an artifact of the numerical solution which arises due to the discontinuity of ∂Ψ/∂n at the pore-membrane boundary.
Analytical model
Since ∇ × E = 0, the tangential component of E is always continuous across charge layers and across discontinuities in ε; and since ∇ · (εE) = 0 outside of charge layers, the normal component of E suffers a jump across discontinuities in ε (see e.g., Jackson, 1962). In particular, when ε increases by a factor of 40 in crossing over from a membrane to the aqueous region, the component of the electric field normal to the interface diminishes by the same factor.
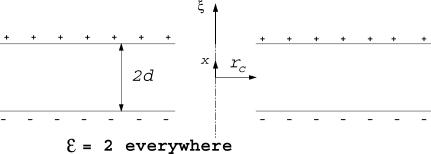
For the case of a thin pore (ri ≪ hi and ro ≪ ho, which is typical), we expect that the electric field in the membrane space will be primarily in the axial (x) direction, and will therefore persist in the aqueous pore without being substantially diminished by the presence of water. Hence, as an approximation we take ε = ε m = 2 everywhere. In addition we take the charge layers to be infinitesimally thin plates (Fig. 3).
FIGURE 3.
Sketch for analytical model.
For this subsection, let the positive axial direction (ξ) point out of the mitochondrion. Let  denote the axial (ξ) component of the electric field due to a single plate with a hole (at ξ = 0) of radius rc and surface charge density σ. We are evaluating the electric field along the axis of the hole (r = 0) where only the axial component is non-zero. Let E′(ξ) denote the axial electric field of the charged disk which closes the hole. Then,
 |
(3) |
with the right-hand side being the electric field of an infinite plate. Integrating the inverse square law over the disk gives
 |
(4) |
where  Carrying out the integration in Eq. 4 and using Eq. 3 gives
 |
(5) |
Finally, superposing two plates spaced a distance 2d apart we have
 |
(6) |
where x is measured from the midpoint of the two charged layers (see Fig. 3). The peak value of the field occurs at x = 0 and is
 |
(7) |
In the limit rc ≪ d we get
 |
(8) |
the electric field in a parallel plate capacitor. The corresponding axial force Fe,peak = eEpeak per unit (+) elementary charge (e) is
 |
(9) |
in the ξ-direction. Equation 9 is a convenient formula for calculating an upper limit on the force.
RESULTS AND DISCUSSION
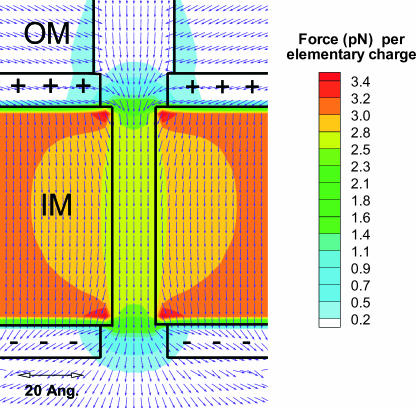
Fig. 4 is a result of the computational model. It shows the force field exerted on a particle having a charge equal to that of the electron but with a positive sign. Colors depict the magnitude of the force and the arrows provide its direction. The force within the IM pore is remarkably uniform, both radially and axially. Whatever leakage there is of the field at the entrance of the IM pore has a direction that is favorable to centering and insertion of the targeting sequence into the pore. The field direction at the exit of the IM pore is favorable for diffusion and exit out of the pore.
FIGURE 4.
Electrostatic force per elementary (+) charge. The radius, ri of the IM pore is 6.5 Å here. Colors depict the magnitude of the force whereas arrows show its direction.
The radial uniformity of the force field within the pore (r < ri) is illustrated in Fig. 5. At the pore boundary (r = ri) the force field suffers a jump in derivative and then at large radial distances from the pore it relaxes slowly to the uniform field inside a parallel plate capacitor.
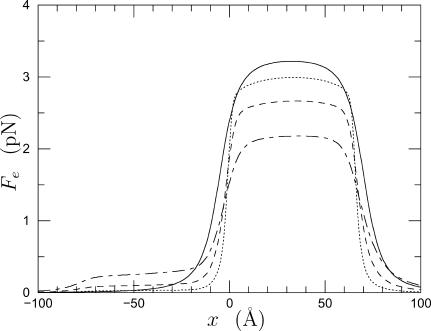
Fig. 6 plots the force along the axis of the pores for various values of the radius of the IM pore. As the radius, ri, of the IM pore decreases, the force increases as a result of less shielding by water. The result (solid line) of the analytical model (6) provides an upper bound and becomes a better approximation to the results of the computational model as the pore radius diminishes. The force profile given by the computational model is quite uniformly distributed along the pore and for wider pores there is more leakage of the electric field into the OM pore. If we let the radius of the IM pore take on values ranging from 0 Å (to allow for the possibility of a completely non-dielectric pore) up to 12 Å, then we conclude that 2.18 < Fe,peak < 3.22 pN.
FIGURE 6.
Force per elementary (+) charge. The origin of the abscissa lies at the entrance of the IM pore which is 65 Å long. Positive force is directed into the mitochondrion. Solid line is the analytical result (6); computational results are dotted line, ri = 3 Å; dashed line, ri = 6.5 Å; and long-dash/short-dash line, ri = 12 Å.
Next, consider import experiments for the protein barnase (Huang et al., 2002) and focus on those cases in which the unfolding mode ranges from being spontaneous to membrane-potential-driven (see Table 1), i.e., exclude cases for long presequences which are unfolded by mtHsp70. The column in Table 1 labeled Unfolding speed S is obtained by multiplying the rates (in domains/s) of Huang et al. by the domain length Ld = (110 – 1) × 3.5 Å where 110 is the number of residues in barnase and 3.5 Å is the distance between residues. The column labeled Unfolding mode gives an indication of the domination of spontaneous (denoted Sp) and membrane potential (denoted M) driven unfolding in each experiment. Membrane-potential-driven import is distinguished in the experiment from spontaneous unfolding by 1), loss of import rate when the membrane potential is reduced by use of a protonophore, and 2), import rate remaining constant with addition of a tightly binding ligand that inhibits spontaneous unfolding. The net number of positive charges in the table is determined as described in the Appendix and after multiplication by the range of Fe in the previous paragraph, we obtain the values in the Applied force column. One observes a trend, more or less, of increasing unfolding speed with increasing predicted force. Import with the (35; E15L) presequence, which by all indications of the experiment is catalyzed by the membrane potential, is accomplished with a force that lies between 11 and 16 pN.
TABLE 1.
Predicted forces for mitochondrial import experiments (Huang et al., 2002)
| Targeting sequence | Net number of + charges in IM pore | Applied force Fa (pN) | Unfolding speed S (Å s−1) | Unfolding mode |
|---|---|---|---|---|
| (35) | 3 | 6.5–9.7 | 0.26 ± 0.013 | Sp |
| (35; A16K) | 4 | 8.7–13 | 0.40 ± 0.032 | M |
| (35+5) | 4 | 8.7–13 | 0.64 ± 0.064 | M |
| (65) | 0–3 | 0.0–9.7 | 0.83 ± 0.13 | M |
| (35; E15L) | 5 | 11–16 | 1.8 ± 0.064 | M |
Sp, spontaneous; M, catalyzed by the membrane potential. See the text for a description of how spontaneous and membrane-catalyzed import were distinguished in the experiment.
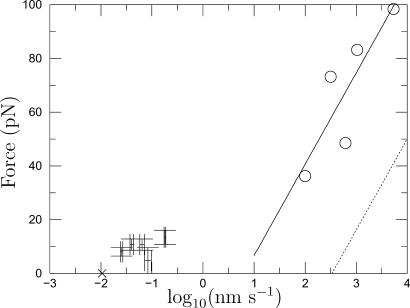
Fig. 7 is a semi-log plot in which error bars show the Fa versus S data in Table 1. The cross symbol (×) at zero force is the (extrapolated) unfolding rate for barnase at zero denaturant concentration and was obtained from Fig. 4 in Best et al. (2001). Evans and Ritchie (1999) modeled the rate ν (in domains/s) of protein unfolding under an applied force Fa as being the rate of escape of a Brownian particle across a one-dimensional potential barrier. The result for a sharp potential barrier of width xβ is
 |
(10) |
where kB is the Boltzmann constant and T is temperature. The effect of the applied force is to lower the depth of the potential barrier by Faxβ. Equation 10 implies that Fa versus log10 S should plot as a straight line and Fig. 7 shows that the calculated forces (error bars) roughly follow this, except for the presequence (65). Furthermore, the zero force extrapolation of the error bars is consistent with the extrapolation (× symbol) from denaturation experiments, suggesting that the pathways of denaturant-induced unfolding and membrane-potential-induced unfolding are the same.
FIGURE 7.
Force versus speed (V) of pulling (AFM) or speed S of unfolding under an applied force. Five pieces of information are given: 1), Error bars: protein import data from Table 1 (predicted force due to membrane potential versus speed of unfolding measured by Huang et al., 2002). The five error bars (from left to right) correspond sequentially to the entries in Table 1. 2), The “×” symbol is the unfolding speed S0 at zero force obtained by extrapolating the denaturation experiments of Best et al. (2001). 3), Open circles represent the AFM unfolding force Fu versus pulling speed V (Best et al., 2001). 4), Solid line is the least-squares fit to open circle symbols. 5), Dotted line is the applied force versus unfolding speed obtained by applying the theory of Evans and Ritchie (1999) to the AFM least-squares (solid) line.
Best et al. used AFM to pull a chain consisting of five titin I27 units interspersed with three barnase units. In contrast to the present situation of fixed applied force, in most AFM experiments, including those of Best et al., the rate of pulling V is fixed and the resulting unfolding force Fu is measured. Fortunately, however, Evans and Ritchie (1999) are able to use the kinetics (Eq. 10) of unfolding under an applied force to predict the most probable unfolding force Fu versus pulling rate V in a V-fixed AFM experiment,
 |
(11) |
where g( ) is a function calculated by Evans and Ritchie, RL is a non-dimensional loading rate, kt = 60 pN nm–1 is the stiffness of the AFM transducer, and nf is the number of folded barnase units remaining in the polymer construct at each stage of the pulling. The non-dimensional parameter cp is the compliance of the unfolded part of the construct: Lu is its fully stretched length and b ≈ 3.5 Å is its persistence length. Note that both nf and Lu undergo a discrete change after each unit is unfolded.
Let us use the AFM data in conjunction with Eq. 11 to obtain unfolding kinetics under an applied force implied by the AFM experiments and compare the result with the data of Table 1. Consider first the case of zero polymer compliance (cp = 0), which will be valid for the unfolding of the first unit of the chain. For this case Evans and Ritchie give g = ln RL and Eq. 11 becomes another log-law:
 |
(12) |
Note that for cp ≠ 0 the theory predicts that the AFM data need not follow a log-law. Equating the expression Eq. 12 to the least-squares line fit to the Best et al. data, one obtains Fβ = 14.8 pN and S0 = 335 nm s−1 for the two parameters of applied force kinetics. With these parameters, the original log-law (Eq. 10) plots as the dotted line in Fig. 7. When extrapolated, this line bears no relation to the mitochondrial import data (error bars) and the spontaneous rate of unfolding (×). This suggests that the unfolding pathway in the Best et al. experiment is different from that induced by the membrane electrostatic force. Unfortunately therefore, we have no independent means at the present time of judging whether the forces due to the membrane potential we calculate can in fact catalyze the import of barnase at the observed rates. The above exercise can be repeated for the third and last unfolding of barnase in the AFM experiment where cp ≠ 0: doing this does not alter the conclusion.
Acknowledgments
A.M. was supported by National Institutes of Health grant R01GM63004.
APPENDIX: NET NUMBER OF POSITIVE CHARGES WITHIN THE IM PORE
The net number of positive charges lying within the IM pore of the experiment (Huang et al., 2002) is inferred as follows. First, from the 7.4 pH of the experiment, we determined (from the Henderson-Hasselbach equation) that the ionization fraction is 0.998 or better for all the acidic and basic amino acids in the presequence. Since the pK of the N-terminus is uncertain (6.8 < pK < 8), its ionized fraction could range from 0.2 to 0.8 (with a positive charge); for simplicity we considered it as uncharged. For presequence (35), the experiment reported membrane potential catalyzed unfolding when positive charges were introduced at positions 15 or 16 but not when they were introduced at positions 18 or 19. Hence the last residue lying within the IM pore is either 16 or 17. Examination of the amino acid sequence then gives three net positive charges as lying within the IM pore. The number of charges for presequences (35; A16K) and (35; E15L) then follows naturally. Presequence (35+5) allows five more residues to occupy the IM pore and these add one more positive charge. The presequence (65) will have positions 46 or 47 (either 16 or 17 as before + 30) as the last one lying in the IM pore. These consist of 6 or 7 net positive charges. However, taking the length of the IM pore to be between 65 and 90 Å, we infer that between 20 and 28 amino acids (consisting of 4–6 net positive charges) will stick out at the matrix end of the IM pore. Hence we have between 0 and 3 (6–7 minus 4–6) net positive charges.
References
- Alberts, B., D. Bray, J. Lewis, M. Raff, K. Roberts, and J. D. Watson. 1994. Molecular Biology of the Cell. Garland Publishing, New York.
- Bauer, M. F., C. Sirrenberg, W. Neupert, and M. Brunner. 1996. Role of Tim23 as voltage sensor and presequence receptor in protein import into mitochondria. Cell. 87:33–41. [DOI] [PubMed] [Google Scholar]
- Best, R. B., B. Li, A. Steward, V. Daggett, and J. Clarke. 2001. Can non-mechanical proteins withstand force? Stretching barnase by atomic force microscopy and molecular dynamic simulation. Biophys. J. 81:2344–2356. [DOI] [PMC free article] [PubMed] [Google Scholar]
- Hill, H., K. Model, M. T. Ryan, K. Dietmeier, F. Martin, R. Wagner, and N. Pfanner. 1998. Tom40 forms the hydrophilic channel of the mitochondrial import pore for preproteins. Nature. 395:516–521. [DOI] [PubMed] [Google Scholar]
- Huang, S., K. S. Ratliff, M. P. Schwartz, J. M. Spenner, and A. Matouschek. 1999. Mitochondria unfold precursor proteins by unraveling them from their N-termini. Nat. Struct. Biol. 6:1132–1138. [DOI] [PubMed] [Google Scholar]
- Huang, S., K. S. Ratliff, and A. Matouschek. 2002. Protein unfolding by the mitochondrial membrane potential. Nat. Struct. Biol. 9:301–307. [DOI] [PubMed] [Google Scholar]
- Jackson, J. D. 1962. Classical Electrodynamics. Wiley, New York. Chapt. 1.
- Evans, E., and K. Ritchie. 1999. Strength of a weak bond connecting flexible polymer chains. Biophys. J. 76:2439–2447. [DOI] [PMC free article] [PubMed] [Google Scholar]
- Künkele, K.-P., S. Heins, M. Dembowski, F. E. Nargang, R. Benz, M. Thieffry, J. Walz, R. Lill, S. Nussberger, and W. Neupert. 1998. The preprotein translocation channel of the outer membrane of mitochondria. Cell. 93:1009–1019. [DOI] [PubMed] [Google Scholar]
- Martin, J., K. Mahlke, and N. Pfanner. 1991. Role of an energized inner membrane in mitochondrial protein import: ΔΨ drives the movement of presequences. J. Biol. Chem. 266:18051–18057. [PubMed] [Google Scholar]
- Matouschek, A., N. Pfanner, and W. Voos. 2000. Protein unfolding by mitochondria: the Hsp70 import motor. EMBO. LA Rep. 1:404–410. [DOI] [PMC free article] [PubMed] [Google Scholar]
- Perkins, G., C. Renken, M. E. Martone, S. J. Young, M. Ellisman, and T. Frey. 1997. Electron tomography of neuronal mitochondria: three-dimensional structure and organization of cristae and membrane contacts. J. Struct. Biol. 119:260–272. [DOI] [PubMed] [Google Scholar]
- Pfanner, N., and W. Neupert. 1990. The mitochondrial protein import apparatus. Annu. Rev. Biochem. 59:331–353. [DOI] [PubMed] [Google Scholar]
- Pfanner, N., and K. N. Truscott. 2002. Powering mitochondrial protein import. Nature Struct. Biol. 9:234–236. [DOI] [PubMed] [Google Scholar]
- Probstein, R. F. 1994. Physico-Chemical Hydrodynamics. Wiley-Interscience, New York.
- Rief, M., J. Pascual, M. Saraste, and H. E. Gaub. 1998. Single molecule force spectroscopy of spectrin repeats: low unfolding forces in helix bundles. J. Mol. Biol. 286:553–561. [DOI] [PubMed] [Google Scholar]
- Rief, M., M. Gautel, F. Oesterhelt, J. M. Fernandez, and H. E. Gaub. 1997. Reversible unfolding of individual titin immunoglobulin domains by AFM. Science. 276:1109–1112. [DOI] [PubMed] [Google Scholar]
- Schwartz, M. P., and A. Matouschek. 1999. The dimensions of the protein import channels in the outer and inner mitochondrial membranes. Proc. Natl. Acad. Sci. USA. 96:13086–13090. [DOI] [PMC free article] [PubMed] [Google Scholar]
- Shariff, K., and R. D. Moser. 1998. Two-dimensional mesh embedding for B-spline methods. J. Comp. Phys. 145:471–488. [Google Scholar]
- Truscott, K. N., P. Kovermann, A. Geissler, A. Merlin, M. Meijer, A. J. M. Driessen, J. Rassow, N. Pfanner, and R. Wagner. 2001. A presequence- and voltage-sensitive channel of the mitochondrial preprotein translocase formed by Tim23. Nature Struct. Biol. 8:1074–1082. [DOI] [PubMed] [Google Scholar]


