Abstract
Many bacterial toxins bind to and gain entrance to target cells through specific interactions with membrane components. Using neutron reflectivity, we have characterized the structure of mixed DPPE:GM1 lipid monolayers before and during the binding of cholera toxin (CTAB5) or its B-subunit (CTB5). Structural parameters such as the density and thickness of the lipid layer, extension of the GM1 oligosaccharide headgroup, and orientation and position of the protein upon binding are reported. The density of the lipid layer was found to decrease slightly upon protein binding. However, the A-subunit of the whole toxin is clearly located below the B-pentameric ring, away from the monolayer, and does not penetrate into the lipid layer before enzymatic cleavage. Using Monte Carlo simulations, the observed monolayer expansion was found to be consistent with geometrical constraints imposed on DPPE by multivalent binding of GM1 by the toxin. Our findings suggest that the mechanism of membrane translocation by the protein may be aided by alterations in lipid packing.
INTRODUCTION
Many bacterial toxins bind to and gain entrance to target cells through specific interactions with membrane components. One such example is cholera toxin (CTAB5), a pathologically active agent secreted by the bacterium Vibrio cholerae (Middlebrook and Dorland, 1984). The toxin has an AB5 arrangement of subunits. Five identical B-subunits (CTB5), each composed of 103 amino acids, form a pentameric ring with a vertical height of 32 Å and a radius of 31 Å (Zhang et al., 1995a,b). CTB5 is responsible for binding the toxin to its cell-surface receptor, ganglioside GM1. The single A-unit is a disulfide-linked dimer composed of an A1- and A2-subunit that is aligned through the central pore “doughnut hole” of the B5 subunit. After proteolytic cleavage (between residues 192 and 194) and reduction of the disulfide bond (Cys187 = Cys199), it has been proposed that the A1 peptide crosses the cell membrane and reaches the cytoplasmic face (Mekalanos et al., 1979). There, it interacts with integral membrane proteins, disrupting their normal function, resulting in a large efflux of water and ions from the cell (severe diarrhea) (Holmgren, 1981). Although much is known about the structure and catalytic activity of cholera toxin, the mechanism by which cholera toxin crosses the plasma membrane remains unknown.
Because of its detrimental effect on health, cholera toxin has been the focus of many studies. Several different methods have shown that the B5 portion of the toxin is responsible for binding to lipid membranes containing GM1. Experiments involving electron microscopy, ellipsometry, and flow cytometry indicate that cholera toxin has minimal nonspecific adsorption to lipid membranes in the absence of GM1 (Lauer et al., 2002; Ribi et al., 1988; Venienbryan et al., 1998). Flow cytometry has further shown that CTAB5 binds to GM1 with a 100-fold larger affinity than CTB5 (Lauer et al., 2002). Because binding is multivalent (one B-monomer per GM1), off-rates of the toxin are slow. If the concentration of GM1 receptor is large enough, it is possible for macroscopic, two-dimensional cholera toxin crystals to be assembled with high coverage (Venienbryan et al., 1998). At the molecular level, atomic force microscopy studies have shown that CTB5 binds to GM1-rich domains of lipid bilayers (Yuan and Johnston, 2000, 2001). Electron microscopy, impedance spectroscopy, and surface plasmon resonance have shown with moderate confidence that the A-unit faces away from the lipid layer when bound (Ribi et al., 1988; Terrettaz et al., 1993).
In the last few years there has been an increased interest in using neutron reflectivity (NR) to study biological or biomimetic thin films. NR is a novel method for characterizing protein adsorption and penetration into lipid layers. The technique allows the average structure of a thin film at an interface to be determined (depth profiling). Averaging over an area of a few square centimeters, NR is sensitive to the structure of homogeneous samples with Ångstrom resolution. However, a smooth, planar geometry is required for detection of the reflected neutron beam. This constraint prevents NR from being used on actual cells. Nevertheless, model biological membranes (at the air-liquid and solid-liquid interface) can be designed to mimic the structure and function of cellular membranes under physiological conditions (Krueger, 2001). Compared to other structural characterization techniques, NR has the ability to observe a system in its native state and does not require fixation, staining, or low vacuum. Studies have investigated protein adsorption (including protein/surfactant mixtures), model biomembranes (Krueger et al., 2001; Majkrzak et al., 2000), and the nature of protein-membrane interactions. Krueger's review (2001) provides an excellent summary of previous studies on biomembranes and protein-membrane interactions using NR. For example, NR has been used to show the importance of metal ion chelation in myoglobin adsorption to lipid monolayers at the air-water interface (Kent et al., 2002). NR combined with x-ray scattering techniques has been used to observe the reconstitution of supramolecular S-layer protein self-organization at a lipid interface (Weygand et al., 2002, 1999). NR has also been used to study lipid-solvent interactions to determine the hydration of phosphatidylcholine headgroups by D2O as a function of surface pressure and lipid phase (Naumann et al., 1995). Combined with other techniques such as x-ray reflectivity, x-ray grazing incidence diffraction, fluorescence microscopy, atomic force microcopy, and surface force apparatus measurements, NR is a powerful tool for characterizing the structure of thin biomimetic films.
We have used neutron reflectivity to characterize the structure of lipid monolayers with cholera toxin bound in its native state to its receptor, GM1. At a resolution of a few Ångstroms, the glycol-lipid extension of GM1 (cholera toxin's lipid receptor), the orientation of the bound cholera toxin molecule, and the distance between the protein layer and the lipid layer have been identified. Our studies performed at the air-liquid interface along with previous knowledge of the three-dimensional crystal structure of CTAB5 and CTB5 at 2.5 Å resolution (Zhang et al., 1995a,b) have provided an opportunity to examine and compare the correlations between structure and function of the toxin.
EXPERIMENTAL
Materials
Lipid monolayers were studied at the air-water interface using a Langmuir trough designed to fit at the horizontal reflectometer beamline (NG7) at the National Institute of Standards and Technology, Center for Neutron Research (Gaithersburg, MD). The lipid monolayer was composed of 80:20 mol % of d-DPPE:GM1 (deuterated 16:0 1,2-dipalmitoyl-D62-sn-glycero-3-phosphoethanolamine:galactosyl-n-acetylgalactosaminyl (n-acetyl-neuraminyl) galactosylglucosylceramide (GM1 ganglioside)). GM1 and d-DPPE were obtained from Avanti Polar Lipids (Alabaster, AL) and were used without further purification. (Please note that identification of a commercial product does not imply endorsement by the National Institute of Standards and Technology.) Cholera toxin CTAB5 was purchased from BIOMOL Research Labs (Plymouth Meeting, PA) and CTB5 was purchased from Sigma (St. Louis, MO). D2O was obtained from Cambridge Isotope Laboratories (Andover, MA). Lipids were dissolved in chloroform:methanol 90:10 (∼1.2 mg/mL), mixed to obtain a 80:20 mol ratio, and deposited on H2O or D2O buffer (170 mM NaCl, 1.4 mM NaN3, 0.3 mM EDTA, 15 mM Trizma-HCl, pH = 5.5–6.1) subphase. The molar composition of the monolayer, surface pressure of 20 mN/m, and temperature of 20°C were held constant for all experiments reported here.
Neutron reflectivity
Reflectivity, R, is defined as the intensity ratio of neutrons elastically and specularly scattered from the surface relative to the incident neutron beam. When measured as a function of wave-vector transfer (Qz = |kout−kin| = 4 π sin α/λ, where α is the angle of incidence and λ is the wavelength of the neutron beam), the reflectivity curve contains information regarding the sample-normal profile of the in-plane average of the coherent scattering length densities. Using a 4.75 Å wavelength neutron beam, the reflectivity as a function of Qz values from 0.01 to 0.24 Å−1 was determined with reasonable statistics to values of R = ∼10−6. Typical scanning times for this Qz range were 3 h. The reflected neutrons were counted using an Ordela position-sensitive 3He detector (Ordela, Oak Ridge, TN). The data was reduced and plotted as  versus the perpendicular scattering vector, Qz (this accounts for a sharp
  decrease of the reflectivity due to the Fresnel's law). The error bars on the data represent the statistical errors in the measurements (standard deviation, σR) where the uncertainty in the Qz resolution,
  , was nearly constant over this scattering vector range. Analysis on the measured reflectivity curves was performed using two methods. The first method was a cubic β-spline fitting routine (Pedersen and Hamley, 1994). In this case, the best fit to the experimentally obtained reflectivity profile was obtained without user-defined constraints based on physical characteristics of the system. In the second method, the structural components of the system were divided into homogeneous molecular slabs or boxes of different scattering length density. These boxes, which physically represent different portions of the lipid-protein layers, were then refined using a least-squared method (Parratt, 1954). As a result, the second method provides the thickness of each layer (box), scattering length density (β(z)), and adjacent interfacial roughness, enabling the structural components perpendicular to the interface to be resolved. In general, consistency between the two models indicates a good representation of the system in real-space.
RESULTS AND DISCUSSION
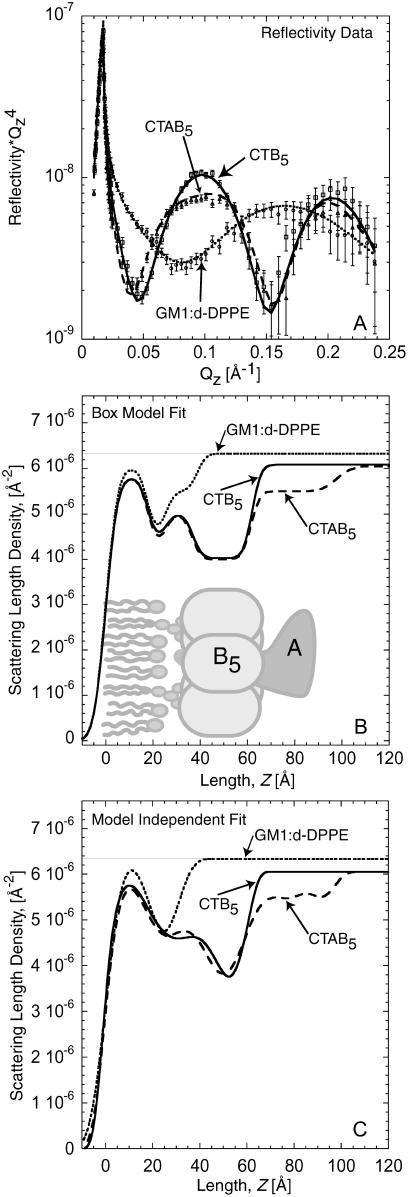
Reflectivity measurements of the lipid-toxin system at the air-water interface enabled the average scattering length density profile normal to the interface to be determined. The experimentally measured reflectivity profiles for 1), the mixed d-DPPE:GM1 monolayer; 2), the monolayer with CTB5; and 3), the monolayer with CTAB5 on a D2O subphase are shown in Fig. 1 A. A few qualitative observations can be made directly from the reflectivity profiles. First, from the position of the interference peak maximum in reciprocal space, Qz = ∼0.16 Å−1 and the thickness of the lipid monolayer is ∼40 Å. This corresponds to the total thickness at the interface, including the GM1 saccharide region. Second, when either CTB5 or CTAB5 bind to the monolayer there is a shift in the interference maximum to smaller Qz values (∼0.1 Å−1), due to a ∼23 Å increase in thickness at the interface from protein binding. This total thickness of 60 Å corresponds to the monolayer and protein thickness. More quantitative details can be obtained using both box model and cubic β-spline fits to the data. The scattering length density profiles, β(z), obtained from the box model fits (solid and dashed curves) are shown in Fig. 1 B and reported in Table 1. Fig. 1 C shows the β(z) from the cubic β-spline fitting routine.
FIGURE 1.
(A) Neutron reflectivity of the monolayer, monolayer with bound CTB5, and monolayer with bound CTAB5. Points with error bars are measured data. Solid and dashed lines indicate fits to the data corresponding to the scattering length density profile in B. (B) Scattering length density profile of box model fits shown in A. A detailed schematic of the box model is provided in Fig. 2. In the profile for the monolayer, the lipid tail, head, and saccharide regions are clearly distinguishable. When CTB5 and CTAB5 are bound, the structure of the lipid monolayer is not significantly altered. The decrease in scattering length density (β(z)) of the lipid tail and headgroup regions is due to an increase in the area per molecule consistent with geometrical constraints applied when cholera toxin binds GM1. The A-subunit clearly resides below the B5 pentamer, facing away from the lipid layer. (C) β(z) profile from the cubic β-spline fitting routine. Reflectivity fits are not shown in A for clarity, but were slightly better than the box model fits. The β(z) profiles from both fitting methods are very similar, suggesting that the real-space structure from the box model fits is reasonable. Note: The difference in the β(z) of the subphase is due to the small addition of H2O used for solvating the protein before incubation with the monolayer.
TABLE 1.
Box model fitting scattering length densities for monolayers on D2O
| DPPE:GM1 monolayer
|
With CTB5
|
With CTAB5
|
|||||||
|---|---|---|---|---|---|---|---|---|---|
| Region | Z (Å) | β(z) × 10−6 | σ (Å)* | Z (Å) | β(z) × 10−6 | σ (Å) | Z (Å) | β(z) × 10−6 | σ (Å) |
| Lipid tail | 17.8 ± 2 | 6.0 ± 0.1 | 4 ± 1 | 17.8† | 5.8 | 4† | 17.8† | 5.8 | 4† |
| Headgroup | 7.5 | 4.5 | 3 | 7.5† | 4.4 | 3† | 7.5† | 4.3 | 3† |
| GM1 | 13.5 | 5.5 | 3 | 11.7 | 5.0 | 3† | 11.2 | 5.0 | 3† |
| CTB5 | 25 | 4.0 | 3 | 25† | 4.0 | 3† | |||
| CTAB5 | 36.3 | 5.5 | 3 | ||||||
| Subphase‡ | 6.3 | 3 | 6.1† | 3† | 6.1† | 5 | |||
| Area expansion with protein | N/A | 8 ± 5% | 8 ± 5% | ||||||
The χ2 values were between 1.7 and 2.4 for box model fits reported in this table.
Because our Qz range was limited to 0.24 Å−1, fitted parameters were not very sensitive to small changes in roughness. A minimum roughness of 3 Å was assumed due to capillary waves (Braslau et al., 1988).
Parameters that were fixed based on monolayer profile and not allowed to vary during the fitting procedure for CTAB5 and CTB5.
The difference in the β(z) of the subphase is due to the small addition of H2O used for solvating the protein before incubation with the monolayer.
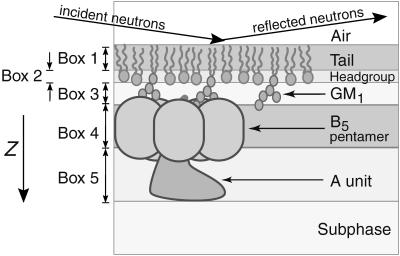
As shown in Fig. 1 A, the box models fit well to the experimental reflectivity profiles in all three cases. In modeling the neutron scattering data, three boxes were used to account for structural features of the 80:20 d-DPPE:GM1 lipid monolayer. The length and scattering length density of these boxes were based on the chemical units of the constituent molecules as shown in Fig. 2, e.g., one box for the lipid tail region, one for the predominately PE headgroup region, and a third box for the oligosaccharide region. Three boxes were required to reproduce the extension of the oligosaccharide groups away from the lipid layer into the water subphase. A two-box model, where the lipid headgroup and oligosaccharide regions were combined, yielded poorer fits to the NR profiles and higher χ2 values. The extension of the oligosaccharide group is consistent with previous x-ray scattering studies (Majewski et al., 2001). In the case of CTB5, a fourth box was added to account for the protein layer, while two boxes were required for CTAB5, one for the B-pentamer and one for the A-subunit. Values marked with a single dagger (†) in Table 1 identify parameters that were held constant during the box model fitting process to reduce the number of parameters.
FIGURE 2.
Illustration of the lipid-protein system and box model representation. Boxes 1–3 were used to represent the d-DPPE:GM1 lipid monolayer. Boxes 4 and 5 were added in subsequent experiments to account for the B5 pentamer of CTB5 and the A-subunit of CTAB5.
In the box model fits for the lipid monolayer, regions for the tail, headgroup, and saccharide can each be clearly distinguished. From simple isotherm analysis at a surface pressure of 20 mN/m the average area per lipid molecule, Area, is 45 ± 3 Å2 for d-DPPE:GM1 at a ratio of 80:20 mol %. The expected thickness can be calculated from the number of CH2 groups, n, and their volume using Eq. 1 (Small, 1967),
 |
(1) |
Both the β(z) = 6.0 × 10⁻⁶ Å2 for the tail region and the thickness measurement, L = 17.8 ± 2 Å, match well to theoretical predictions for this packing density. Similarly, the thickness of the lipid headgroup region, 7.5 Å, and extension of the oligosaccharide groups, 13.5 Å, match well to those previously reported (Helm et al., 1987, 1991; Majewski et al., 2001).
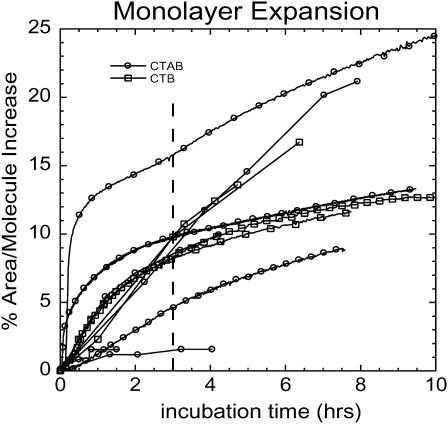
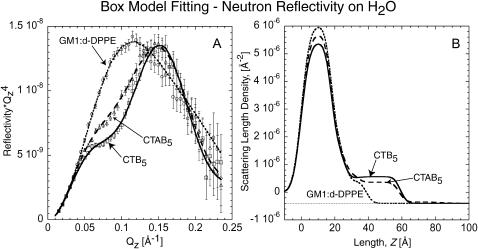
When CTB5 or CTAB5 binds, the structure of the lipid portion of the monolayer is not significantly altered. From pressure area isotherm measurements under constant pressure conditions, toxin binding results in a small expansion of the monolayer commensurate with a decrease in lipid packing density. As a result of this expansion, there is more than one possible outcome. The thickness of the lipid tail region may decrease while the scattering length density remains constant; the scattering length density for the region may decrease while the thickness of the tail region remains constant; or some combination of both. We chose to hold the length of the tail region constant to reduce the number of fitting parameters based on the cubic β-spline fitting profiles. However, similar χ2 values were obtained in box model fittings if the scattering length density was kept constant and the length was allowed to vary. Importantly, changes in the tail region of these two models had no effect on the B5 and A regions of the toxin. Due to the invariance on the toxin portion of the model and the cubic β-spline fitting results, we chose to constrain the length of the tail region and allow the scattering length density to vary. Neutron reflectivity measurements alone cannot distinguish between these models due to the loss of phase information. With these constraints, the scattering length density of the lipid tails decreased slightly, 3%. Importantly, comparable area expansions of 8 ± 5% are observed for either CTB5 or CTAB5 binding (results shown in Fig. 3). Due to large variation within the monolayer expansion data, there is no sufficient trend showing a difference between the effects of CTAB5 and CTB5 binding on the area per molecule of the monolayer. Because the amount of area increase is the same regardless of the presence of the A-subunit, these measurements demonstrate that A-subunit penetration is not responsible for the area increase. Monte Carlo simulations (described later) suggest simple geometrical constraints imposed by toxin binding are responsible for the observed monolayer expansion. This hypothesis is also consistent with the calculated scattering length density profiles obtained with either box model or cubic β-spline fitting. The β(z) of the protein is ∼2 × 10⁻⁶ Å−2 compared to 6 × 10⁻⁶ Å−2 β(z) for the deuterated lipid tails. A significant decrease in lipid tail β(z) would be expected if protein penetrated the layer because the β(z) for the protein is significantly less than that of the deuterated lipid tails. Another detail that does not support partial A-subunit insertion is that the B5 pentamer of CTAB5 is 11 Å away from the lipid headgroup region. In other words, a distinct GM1 saccharide region is still present. (Preliminary studies—results under preparation—show a complete collapse of the GM1 saccharide region when the toxin is enzymatically activated, bringing it directly into contact with the lipid layer.) The decrease in the thickness of the GM1 saccharide region from 13.5 to 11.3 ± 2 Å when toxin is bound is consistent with the partial insertion of GM1 oligosaccharides into the B5 pentamer binding sites.
FIGURE 3.
Area expansion curves of the GM1-DPPE monolayer after CTAB5 or CTB5 has been added. There are variations in the % area expansion between experiments. The 8 ± 5% expansion reported is a result of 11 independent experiments for CTAB5 and CTB5 after 3 h of incubation (indicated by a dashed line). There error of ±5% refers to the standard deviation of the values at 3 h of incubation. There is no trend showing more expansion for CTAB5 or CTB5.
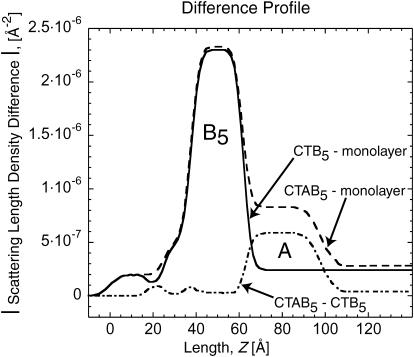
Our NR results with CTAB5 show that the A-subunit is clearly facing away from the lipid layer and the majority of the subunit is below the B-pentamer. This finding is consistent with previous electron microscopy, impedance spectroscopy, and surface plasmon resonance experiments (Ribi et al., 1988; Terrettaz et al., 1993). This positioning of the A-unit further implies that the A-unit may travel through the central pore of B5 pentamer when the toxin is activated. In electron microscopy difference maps, ∼60% of the A-unit was missing before enzymatic activation. It was hypothesized that this unaccounted mass was embedded in the hydrophobic interior of the lipid membrane, inaccessible to the negative stain (Ribi et al., 1988). These measurements imply that the A-subunit penetrates the membrane before activation. Our studies using NR are not consistent with this finding and showed no difference in lipid structure between bound CTB5 and CTAB5. Fig. 4 shows the fitted β(z) profiles as difference profiles between the monolayer with and without toxin bound. The A-unit orientation away from the monolayer is obvious from the difference profile between CTAB5 and CTB5. Conversely, the lipid region remains the same when either CTB5 or CTAB5 bind indicating that the A-unit does not penetrate into the lipid monolayer before the toxin is enzymatically activated. A similar difference profile is obtained for CTB5 and the monolayer. The B5 unit can clearly be seen attached to the monolayer with small differences for the lipid region.
FIGURE 4.
Scattering length density difference profile of NR measurements done on D2O buffer subphase. In the CTB5-monolayer case, the B5 unit can be seen along with differences in the lipid region. In the CTAB5-CTB5 case, the A-unit can clearly be seen to be oriented away from the lipid layer. There is little-to-no change in the lipid region when CTB5 and CTAB5 are bound implying that there is little to no A-unit penetration before activation.
Reflectivity profiles from experiments conducted on H2O subphase are shown in Fig. 5 including box model fits and β(z) profiles. Parameters used are listed in Table 2. The length scales of the lipid tail, lipid headgroup, and CTB5 (Box 4) components were held constant based on the D2O fits and only the β(z) of each region was allowed to change. Due to hydration, deuterium-hydrogen exchange, and the considerable difference between the β(z) of D2O (6.33 × 10⁻⁶ Å−2) and H2O (−5.6 × 10⁻⁷ Å−2), there are significant differences in the β(z) of all regions except the tails when comparing the D2O and H2O models. Length scales of the GM1 saccharide region and the CTAB5 (Box 5) region were slightly different due to less contrast between all layers involving H2O hydration. This is because the β(z) of the GM1 saccharide and the protein are similar to that of H2O. Importantly, the model obtained for D2O and H2O subphase are consistent with only minor variations. This consistency further supports that the models used in both cases are accurate.
FIGURE 5.
Neutron reflectivity with H2O as the subphase instead of D2O. (A) Neutron reflectivity of the monolayer, monolayer with bound CTB5, and monolayer with bound CTAB5. Solid and dashed lines indicate the fit corresponding to the profile in B. Points with error bars correspond to measured data. (B) Scattering length density profile of fits shown in A obtained by box model fitting methods. The same features of lipid tails, lipid heads, and the B5 subunit can be seen. The A-unit of CTAB5 is not very visible due to small contrast between the scattering length density of H2O and the A-unit layer. These results are consistent with that of NR done on D2O. The difference in β(z) of the lipid tail region for bound CTAB5 and CTB5 is most likely due to different protein coverage. The increased amount on CTB5 coverage (indicated by a larger β(z) for Box 4) is responsible for a larger decrease in lipid tail β(z) due to a larger increase in area per molecule of the lipid layer.
TABLE 2.
Box model fitting scattering length densities for monolayers on H2O
| DPPE:GM1 monolayer
|
With CTB5
|
With CTAB5
|
|||||||
|---|---|---|---|---|---|---|---|---|---|
| Region | Z (Å) | β(z) × 10−6 | σ (Å)* | Z (Å) | β(z) × 10−6 | σ (Å) | Z (Å) | β(z) × 10−6 | σ (Å) |
| Lipid tail | 17.8† | 6.0 ± 0.1 | 4 ± 1† | 17.8† | 5.4 | 4† | 17.8† | 5.7 | 4† |
| Headgroup | 7.5† | 2.0 | 3† | 7.5† | 1.7 | 3† | 7.5† | 1.8 | 3† |
| GM1 | 13.5† | 0.4 | 3† | 8.8 | 0.5 | 3† | 8.1 | 0.68 | 3† |
| CTB5 | 25† | 0.56 | 3† | 25† | 0.36 | 3† | |||
| CTAB5 | 25 | −0.35 | 3 | ||||||
| Subphase | −0.4 | 3† | −0.4† | 3† | −0.4† | 5 | |||
The χ2 values were between 0.75 and 1.02 for box model fits reported in this table.
Because our Qz range was limited to 0.24 Å−1, fitted parameters were not very sensitive to small changes in roughness. Due to capillary waves, a minimum roughness of 3 Å was assumed (Braslau et al., 1988).
Parameters that were fixed and not allowed to vary during the fitting procedure.
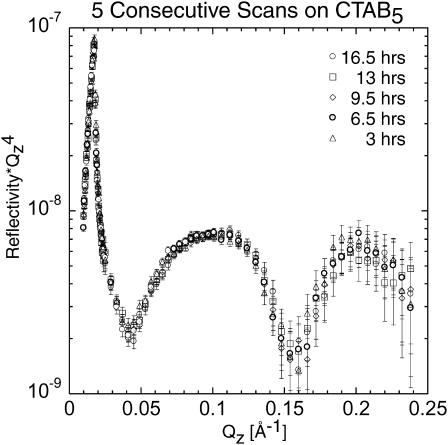
To assess the effects of CTAB5 binding as a function of time, we scanned the same monolayer with bound CTAB5 five consecutive times (Fig. 6). It can be seen that there are no significant changes and that toxin binding has stabilized after 3 h of incubation. Studies done using ellipsometry showed CTB5 adsorption to start immediately after injection and to be completed after 1 h of incubation (Venienbryan et al., 1998).
FIGURE 6.
To assess the effects of binding time, five consecutive scans on CTAB5 with D2O subphase were performed. The scans were done after 3, 6.5, 9.5, 13, and 16.5 h of incubation. The reflectivity profiles are essentially identical for each scan.
The individual atom scattering lengths for the 515 amino acids (103 residues per B-subunit) that make up CTB5 plus 204 water molecules and the molecular volume (V = 92,030 Å3 calc) obtained from crystallographic data were used to calculate the scattering length density of CTB5 (Zhang et al., 1995b). Due to hydrogen-deuterium exchange and hydration changes, the β(z) of CTB5 in D2O will be different than the β(z) of CTB5 in H2O. A one-dimensional NMR spectrum was run on a CTB5 sample to determine the percentage of hydrogen exchange with deuterium. NMR analysis showed that 5 ± 3% of the total hydrogen exchanged on the CTB5 molecule when dissolved in D2O during an hourly timescale. Amide hydrogen on the interior of the protein and hydrogen involved in H-bonds will eventually exchange but on a timescale of days or even months. This exchange percentage was used to calculate the expected β(z) of the CTB5 molecule in D2O and used to calculate the amount of toxin bound to the monolayer. The percent coverage of CTB5 was calculated to be 51 ± 2% for the D2O case (5% hydrogen-deuterium exchange) and 51 ± 2% for the H2O case using Eq. 2,
 |
(2) |
where X = % coverage of CTB5, β(z)D2O = 6.1e–06 Å−2, β(z)H2O = −0.4e–06 Å−2, β(z)CTB5,D2O = 1.8e–06 Å−2, and β(z)CTB5,H2O = 1.6e–06 Å−2. The 0.953 and 0.047 values were obtained from the ratio of CTB5 volume (92,030 Å3) to central pore volume (4580 Å3). The scattering length of each atom was obtained from the National Institute of Standards and Technology website, http://www.ncnr.nist.gov/resources/n-lengths (C = 6.646 fm, O = 5.803 fm, N = 9.36 fm, S = 2.85 fm, H = −3.74 fm, and D = 6.671).
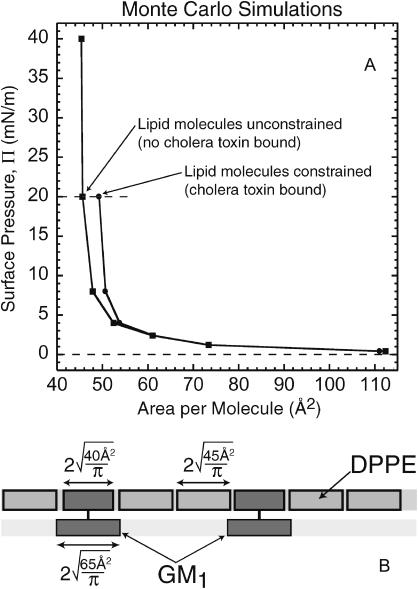
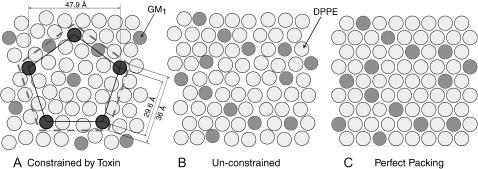
Finally, Monte Carlo simulations were performed on the lipid-cholera system to predict the amount of area expansion due to toxin binding (Faller and Kuhl, 2003). All simulations assumed no protein insertion and calculated lipid packing using two-dimensional lipid layers at constant pressure. Hard disks were used to represent each lipid, GM1 and DPPE, as shown in Fig. 7 B. The Monte Carlo moves employed were standard translational moves, area changing and particle identity swap (Faller and de Pablo, 2002, 2003; Grigera and Parisi, 2001). The simulations were performed on 200 GM1 molecules and 800 DPPE molecules held within a two-dimensional square box. Pure DPPE at close packing has an area per molecule of 45 Å2 whereas monolayers of pure GM1 attain close packing at 65 Å2. However, GM1 molecules at low to intermediate densities in mixed DPPE:GM1 monolayers (up to 20 mol %) do not strongly change the overall area per molecule (Majewski et al., 2001). Therefore, GM1 was modeled to be a hard disk with an area of 40 Å2 (this value was approximated from the alkyl tail structure of GM1) in the DPPE layer coupled to a 65 Å2 disk below it (Fig. 7 B) to represent the bulky saccharide headgroup. To imitate cholera binding, 55 GM1 molecules were fixed in groups of pentagonal shapes to mimic the binding site positions of 11 CTB5 molecules. The side length of each pentagon was 29.6 Å based on the distance between Trp88 residues within the binding site of each B-unit of the CTB5 pentamer (Zhang et al., 1995b). The result of these simulations (Fig. 7 A) showed a 7% increase in lipid area per molecule at a pressure of 20 mN/m solely due to packing inefficiencies caused by constraining GM1 lipids at the cholera binding sites. Fig. 8 shows an illustration describing how fixing GM1 molecules can disturb the lipid packing efficiency. This outcome is consistent with our measured results for both CTB5 and CTAB5, suggesting that no protein penetrates into the monolayer before the toxin is activated. This is in contrast to previous results obtained by electron microscopy. Monte Carlo simulations also showed similar decreases in lipid packing efficiency when GM1 lipids were constrained at random positions indicating that exact pentagonal geometries are not required for monolayer expansion.
FIGURE 7.
(A) Π-A isotherm generated from computer simulations. The area per molecule increases by 7% at 20 mN/m due to lipid packing inefficiencies imposed by the pentagonal fixing of GM1 lipids when CTB5 or CTAB5 bind. The surface pressures of the simulations have been rescaled to match results obtained from experimental isotherms of a monolayer with no bound toxin. This figure shows an illustration demonstrating lipid packing under constrained and unconstrained conditions. (B) Description of the two-dimensional coupled Monte Carlo simulation model used for mixed DPPE:GM1 monolayers.
FIGURE 8.
Lipid packing arrangements generated from Monte Carlo simulations (see also Fig. 7). GM1 molecules are represented by dark disks with an area of 40 Å2 and DPPE (lighter disks) molecules with an area of 45 Å2 (Majewski et al., 2001). (A) Simulation result: When CTB5 binds, it constrains up to five GM1 molecules (shown darker that other GM1 molecules) at protein binding site locations. The corners of the inner pentagon represent these binding sites. The larger dashed pentagon represents the area of one toxin molecule. When 55 out of 200 GM1 lipids are fixed by protein binding (∼50% coverage) the result is a 7% decrease in lipid packing density (see text for further details). This decrease in lipid packing density is consistent with the observed monolayer area expansion at a constant surface pressure of 20 mN/m. (B) Simulation result: Shows an 80:20 DPPE:GM1 monolayer at 20 mN/m in the absence of protein binding (no constraints). (C) Shows perfect packing of the monolayer for reference.
CONCLUSION
Using neutron reflectivity, we have characterized the structure of lipid monolayers presenting ganglioside GM1 before and during the binding of cholera toxin (CTAB5) or its B-subunit (CTB5). Structural parameters such as the density and thickness of the lipid layer, extension of the GM1 oligosaccharide headgroup, and orientation and position of the protein upon binding were reported. Upon protein binding, the density of the lipid layer decreases slightly, consistent with geometrical constraints imposed by multivalent binding of GM1 to the toxin. The A-subunit of the whole toxin is clearly located below the B-pentameric ring, away from the monolayer, and does not penetrate into the lipid layer before enzymatic cleavage. Although the structure of the lipid layer is not significantly altered, neutron reflectivity and Monte Carlo simulation results support that geometrical constraints imposed by toxin binding lead to a decrease in lipid packing density. We hypothesize that this decrease in packing efficiency increases the amount of hydrophobic tail region exposed to the subphase and hence to the protein. After cleavage and toxin activation, the A1 unit is held in proximity to the interior of the membrane. Possible changes in protein conformation after activation may lead to further lipid perturbation and A1 membrane penetration.
Acknowledgments
We thank Thorsten Dieckmann at the Chemistry Department, University of California at Davis, for NMR spectrometer time and analysis.
This work was supported by the Searle Scholars Program/ the Chicago Community Trust (01-L-128) and under the auspices of the United States Department of Energy through award 05419-0099-2K. The Manual Lujan Jr. Neutron Scattering Center is a national user facility funded by the United States Department of Energy, Office of Basic Energy Sciences-Materials Science, under contract W-7405-ENG-36 with the University of California. We acknowledge the support of the National Institute of Standards and Technology, U. S. Department of Commerce, in providing the neutron research facilities used in this work.
References
- Braslau, A., P. S. Pershan, G. Swislow, B. M. Ocko, and J. Als-Nielsen. 1988. Capillary waves on the surface of simple liquids measured by x-ray reflectivity. Phys. Rev. A. 38:2457–2470. [DOI] [PubMed] [Google Scholar]
- Faller, R., and J. J. de Pablo. 2002. Constant pressure hybrid molecular dynamics-Monte Carlo simulations. J. Chem. Phys. 116:55–59. [Google Scholar]
- Faller, R., and J. J. de Pablo. 2003. Density of states of a binary Lennard-Jones glass. J. Chem. Phys. 119:4405–4408. [Google Scholar]
- Faller, R., and T. L. Kuhl. 2003. Modeling the binding of cholera-toxin to a lipid membrane by a nonadditive two-dimensional hard disk model. Soft Mat. 1:343–352. [Google Scholar]
- Grigera, T. S., and G. Parisi. 2001. Fast Monte Carlo algorithm for supercooled soft spheres. Art. no. 045102. Phys. Rev. E. 6304:5102. [DOI] [PubMed] [Google Scholar]
- Helm, C. A., H. Möhwald, K. Kjaer, and J. Als-Nielsen. 1987. Phospholipid monolayers between fluid and solid states. Biophys. J. 52:381–390. [DOI] [PMC free article] [PubMed] [Google Scholar]
- Helm, C. A., P. Tippmannkrayer, H. Möhwald, J. Als-Nielsen, and K. Kjaer. 1991. Phases of phosphatidyl ethanolamine monolayers studied by synchrotron x-ray-scattering. Biophys. J. 60:1457–1476. [DOI] [PMC free article] [PubMed] [Google Scholar]
- Holmgren, J. 1981. Actions of cholera-toxin and the prevention and treatment of cholera. Nature. 292:413–417. [DOI] [PubMed] [Google Scholar]
- Kent, M. S., H. Yim, D. Y. Sasaki, J. Majewski, G. S. Smith, K. Shin, S. Satija, and B. M. Ocko. 2002. Segment concentration profile of myoglobin adsorbed to metal ion chelating lipid monolayers at the air-water interface by neutron reflection. Langmuir. 18:3754–3757. [Google Scholar]
- Krueger, S. 2001. Neutron reflection from interfaces with biological and biomimetic materials. Current Opin. Coll. Interf. Sci. 6:111–117. (Review.) [Google Scholar]
- Krueger, S., C. W. Meuse, C. F. Majkrzak, J. A. Dura, N. F. Berk, M. Tarek, and A. L. Plant. 2001. Investigation of hybrid bilayer membranes with neutron reflectometry: probing the interactions of melittin. Langmuir. 17:511–521. [Google Scholar]
- Lauer, S., B. Goldstein, R. L. Nolan, and J. P. Nolan. 2002. Analysis of cholera toxin-ganglioside interactions by flow cytometry. Biochemistry. 41:1742–1751. [DOI] [PubMed] [Google Scholar]
- Majewski, J., T. L. Kuhl, K. Kjaer, and G. S. Smith. 2001. Packing of ganglioside-phospholipid monolayers: an x-ray diffraction and reflectivity study. Biophys. J. 81:2707–2715. [DOI] [PMC free article] [PubMed] [Google Scholar]
- Majkrzak, C. F., N. F. Berk, S. Krueger, J. A. Dura, M. Tarek, D. Tobias, V. Silin, C. W. Meuse, J. Woodward, and A. L. Plant. 2000. First-principles determination of hybrid bilayer membrane structure by phase-sensitive neutron reflectometry. Biophys. J. 79:3330–3340. [DOI] [PMC free article] [PubMed] [Google Scholar]
- Mekalanos, J. J., R. J. Collier, and W. R. Romig. 1979. Enzymic activity of cholera toxin. II. Relationships to proteolytic processing, disulfide bond reduction, and subunit composition. J. Biol. Chem. 254:5855–5861. [PubMed] [Google Scholar]
- Middlebrook, J. L., and R. B. Dorland. 1984. Bacterial toxins—cellular mechanisms of action. Microbiol. Rev. 48:199–221. [DOI] [PMC free article] [PubMed] [Google Scholar]
- Naumann, C., T. Brumm, A. R. Rennie, J. Penfold, and T. M. Bayerl. 1995. Hydration of DPPC monolayers at the air/water interface and its modulation by the nonionic surfactant C12E4—a neutron reflection study. Langmuir. 11:3948–3952. [Google Scholar]
- Parratt, L. G. 1954. Surface studies of solids by total reflection of x-rays. Phys. Rev. 95:359–369. [Google Scholar]
- Pedersen, J. S., and I. W. Hamley. 1994. Analysis of neutron and x-ray reflectivity data by constrained least-squares methods. Phys. B. 198:16–23. [Google Scholar]
- Ribi, H. O., D. S. Ludwig, K. L. Mercer, G. K. Schoolnik, and R. D. Kornberg. 1988. 3-Dimensional structure of cholera-toxin penetrating a lipid-membrane. Science. 239:1272–1276. [DOI] [PubMed] [Google Scholar]
- Small, D. M. 1967. Phase equilibria and structure of dry and hydrated egg lecithin. J. Lipid Res. 8:551–557. [PubMed] [Google Scholar]
- Terrettaz, S., T. Stora, C. Duschl, and H. Vogel. 1993. Protein-binding to supported lipid-membranes—investigation of the cholera-toxin ganglioside interaction by simultaneous impedance spectroscopy and surface-plasmon resonance. Langmuir. 9:1361–1369. [Google Scholar]
- Venienbryan, C., P. F. Lenne, C. Zakri, A. Renault, A. Brisson, J. F. Legrand, and B. Berge. 1998. Characterization of the growth of 2D protein crystals on a lipid monolayer by ellipsometry and rigidity measurements coupled to electron microscopy. Biophys. J. 74:2649–2657. [DOI] [PMC free article] [PubMed] [Google Scholar]
- Weygand, M., K. Kjaer, P. B. Howes, B. Wetzer, D. Pum, U. B. Sleytr, and M. Losche. 2002. Structural reorganization of phospholipid headgroups upon recrystallization of an S-layer lattice. J. Phys. Chem. B. 106:5793–5799. [Google Scholar]
- Weygand, M., B. Wetzer, D. Pum, U. B. Sleytr, N. Cuvillier, K. Kjaer, P. B. Howes, and M. Losche. 1999. Bacterial S-layer protein coupling to lipids: x-ray reflectivity and grazing incidence diffraction studies. Biophys. J. 76:458–468. [DOI] [PMC free article] [PubMed] [Google Scholar]
- Yuan, C. B., and L. J. Johnston. 2000. Distribution of ganglioside GM1 in L-α-dipalmitoylphosphatidylcholine/cholesterol monolayers: a model for lipid rafts. Biophys. J. 79:2768–2781. [DOI] [PMC free article] [PubMed] [Google Scholar]
- Yuan, C. B., and L. J. Johnston. 2001. Atomic force microscopy studies of ganglioside GM1 domains in phosphatidylcholine and phosphatidylcholine/cholesterol bilayers. Biophys. J. 81:1059–1069. [DOI] [PMC free article] [PubMed] [Google Scholar]
- Zhang, R. G., D. L. Scott, M. L. Westbrook, S. Nance, B. D. Spangler, G. G. Shipley, and E. M. Westbrook. 1995a. The three-dimensional crystal structure of cholera toxin. J. Mol. Biol. 251:563–573. [DOI] [PubMed] [Google Scholar]
- Zhang, R. G., M. L. Westbrook, E. M. Westbrook, D. L. Scott, Z. Otwinowski, P. R. Maulik, R. A. Reed, and G. G. Shipley. 1995b. The 2.4 Å crystal structure of cholera toxin B-subunit pentamer-choleragenoid. J. Mol. Biol. 251:550–562. [DOI] [PubMed] [Google Scholar]


