

Abstract
The ability to predict the effects of mutations on protein folding rates and mechanisms would greatly facilitate folding studies. Using a realistic full atom potential coupled with a G -like potential biased to the native state structure, we have investigated the effects of point mutations on the folding rates of a small single domain protein. The hybrid potential provides a detailed level of description of the folding mechanism that we correlate to features of the folding energy landscapes of fast and slow mutants of an 80-residue-long fragment of the λ-repressor. Our computational reconstruction of the folding events is compared to the recent experimental results of W. Y. Yang and M. Gruebele (see companion article) and T. G. Oas and co-workers on the λ-repressor, and helps to clarify the differences observed in the folding mechanisms of the various mutants.
INTRODUCTION
Since the first reports of fast submillisecond protein folding (Huang and Oas, 1995; Nölting et al., 1995), the research community has developed techniques (Gruebele, 1999; Eaton et al., 2000; Myers and Oas, 2002; Gruebele, 2002) to measure even faster rates of folding and searched for the proteins folding at the speed limit of folding (Hagen et al., 1996; Kubelka et al., 2004), where the residual roughness on the free-energy surface is controlling the process. In 2003, Yang and Gruebele (2003) reported a five-helix bundle 80-residues variant of the amino-terminal domain of λ-repressor, λ6–85, which folds in the time comparable with the molecular time scale of 2 μs.
Theoretical work has revealed many minute details of the energy landscape of the proteins (Bryngelson et al., 1995; Onuchic et al., 1997). The statistical mechanical description of the potential surface of a foldable protein is a rough funnel-like energy landscape. The funnel is a consequence of the competing contributions of energetic and entropic terms. As a protein folds down the funnel-like landscape to the native basin, its conformational space decreases, but the energetic advantage is growing. The roughness of the folding energy landscape is due to topological and energetic frustration that arises in part from the many nonnative contacts protein made during the folding (Shea et al., 1999; Clementi et al., 2000a; Shea and Brooks, 2001; Plotkin and Onuchic, 2002). To investigate the folding computationally, the roughness can be reduced by addition of an energy term biased toward the native contacts, a G -like term (Taketomi et al., 1975; G
 1983).
The role of topology on the structure of the transition state ensemble and folding in general has been studied by Onuchic and colleagues (Clementi et al., 2000b, 2003). For an energetically unfrustrated system, in which the identity of amino acids is ignored, a G potential based on the native topology was applied to a number of small globular proteins. Calculated φ-values agree well with the experiments. This model was later extended by Koga and Takada (2001) to a calculation of the dependence of the folding rate on the relative contact order, the average sequence separation of the residues participating in native contacts, normalized to total number of residues. It is a function of topology of the protein. As this study was only able to recover φ-values close to the experimentally determined ones for half of the 18 small proteins considered, the importance of including the sequence specific information becomes clear.
The role of the nonnative contacts during folding of the fast folding proteins has been studied using theoretical (Bryngelson et al., 1995; Portman et al., 1998, 2001; Plotkin, 2001), computational (Zhou and Karplus, 1999; Paci et al., 2002; Cieplak and Hoang, 2002; Clementi et al., 2003) and analytical (Plotkin, 2001) methods. Zhou and Karplus (1999) studied a simplified Cα-based model of a small (46-residues) three-helix-bundle protein, with a square-well potential using a constant temperature discontinuous molecular dynamics. Using a single parameter representing relative strength of the native to nonnative interactions, they were able to change the folding mechanism from the diffusion-collision type to the one favoring collapse and simultaneous secondary structure formation.
Paci and co-workers (Paci et al., 2002) reported a study of the validity of G models with respect to the accuracy in the description of native and nonnative conformations. They used molecular dynamics simulations with a united-atom force field and an implicit solvent to generate native and nonnative conformations. For the resulting structures, the energetic description by the original force field was compared to a G
 -like one. As expected, the native structures are described fairly accurately by the G
 -like energy potential. Analysis of the nonnative structures demonstrated the importance of the stabilizing nonnative interactions for the description of the unfolded and collapsed state. Stabilizing nonnative interactions are not included into the usual G
 potentials.
Proteins with similar topology but different folding mechanisms present an interesting test set to study effects on folding of the sequence. Recently a number of groups have reported the use of G models with varying degree of sequence-specific information, to elucidate the origins of the different folding mechanisms of protein L and protein G and to describe their folding. Although the proteins have similar highly symmetrical native topology, their folding proceeds from opposite termini.
In Shimada and Shakhnovich (2002), the folding of protein G was studied using a Monte Carlo G -like simulation where all heavy atoms of the backbone and side chains were represented by spheres with atom-specific sizes. An atomic square-well potential was used and only native interactions were made attractive. They have shown that protein G folds through multiple pathways. The authors also recovered ensemble averages that are consistent with φ-value and flow experiments.
Karanicolas and Brooks (2002) used a Cα model of both proteins in a molecular dynamics study. The force field included geometric terms and the nonbonded interactions were modeled by a Lennard-Jones type of potential. It assumed attractive terms for the native contacts, repulsive for the nonnative contacts, and also included a desolvation penalty that the side chains have to pay to form a favorable contact. The energies were scaled according to the statistical contact energies by Miyazawa and Jernigan (1996). This level of detail allowed researchers to discriminate between the folding mechanisms of protein L and protein G, by revealing the roles of the β-hairpins in the order of folding.
The latest study by Clementi and colleagues (Clementi et al., 2003), employed a G model with more atomic details. The geometry of all heavy atoms of backbone and side chains was used. Effective Lennard-Jones potentials were employed to model both the nonbonded interactions between the heavy atoms as well as the attractive native interactions of the G
 potential. All heavy atoms, participating in native interactions, were divided into three groups, according to the polarity of the residues. Repulsive nonnative interactions were also modeled by Lennard-Jones potentials. The molecular dynamics simulations revealed the different folding mechanisms for proteins L and G, and showed the importance of the side-chain packing during folding. Recent work on the proteins L and G is reviewed in the report by Head-Gordon and Brown (2003).
In this article we describe the use of the full atom force field of CHARMM27 (MacKerell et al., 1998) coupled to a G -like (Taketomi et al., 1975) potential to investigate the differences in the folding mechanisms of the fast and slow variants of λ6–85 observed in the companion article by Yang and Gruebele (2004). It was shown experimentally (Huang and Oas, 1995; Yang and Gruebele, 2003) that point mutations are capable of changing the folding times up to fivefold. We describe the atomistic details of the folding processes for the fast, slow, and wild-type variants of λ6–85, and the sequence of events during folding of the mutants that can explain the differences in the folding mechanisms. The free-energy profiles of both mutants are reconstructed from production runs of umbrella sampling technique (Torrie and Valleau, 1977; Boczko and Brooks, 1993), using a weighted histogram method (Ferrenberg and Swendsen, 1989). The fine structure of the free-energy profiles gives a measure of the folding barriers and is used to estimate the timescales of folding. The role of nonnative interactions in folding of the mutants is also discussed. The structure of the energy profiles reveals the differences in the folding of the variants, which differ only by point mutations.
METHODS
Model system
Hybrid molecular dynamics (MD) folding simulations of an 80-residue N-terminal domain of λ-repressor were performed. The λ-repressor is a small gene regulating protein, the structure of which (Protein Data Bank identification No. 1LMB) was resolved by Beamer and Pabo (1992). Three mutants were created to study the role of specific side-chain interactions. To compare our results to the experimental study of Yang and Gruebele (2004), all proteins but one have Tyr22Trp and Glu33Tyr mutations. The Tyr22Trp mutation functions as a fluorescent probe, and the Glu33Tyr mutation introduces an additional aromatic interaction to facilitate folding. The fast variant of λ-repressor, λQ33Y, has the following mutations: Tyr22Trp/Glu33Tyr/Gly46Ala/Gly48Ala; both Gly-to-Ala mutations stabilize helix 3. The slow mutant, λG37A, has the following mutations: Tyr22Trp/Glu33Tyr/Ala37Gly. The third mutant is a model for the experimental wild-type and has only the Tyr22Trp fluorescent probe mutation.
Energy function
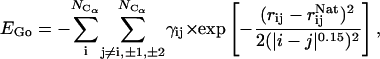
In the simulations, a G -like (Hardin et al., 1999; G
 1983) energy potential is added to the atomistic CHARMM MD potential EAA: E = EAA + k × EGo, where EGo is a G
 -like potential applied only to the Cα atoms, and k is an empirically determined coupling constant. The all-atom energy potential is CHARMM27 (Brooks et al., 1983; MacKerell et al., 1998), which includes geometric contributions to the energy, such as bond, bond angle, dihedral and improper torsion angles, as well as the nonbonded van der Waals, electrostatic, and hydrogen bonding potentials. The G
 -like contribution is a potential that biases the overall energy function toward the native state by adding an attractive energy contribution for the native contacts. It effectively reduces the roughness of the energy funnel. As the fastest folding time for small proteins is on the order of microseconds, it is still a formidable task to simulate the folding process using traditional MD with explicit solvent. This G
 -like potential, applied to Cα atoms, is based on an associated memory Hamiltonian term (Hardin et al., 1999) with a single memory:
 |
(1) |
where the weights γij were chosen as  and
and 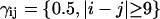 to ensure a balanced energy assignment for all the sequence separation scales. Simulations were performed for different values of the coupling constant k to determine the smallest k value, which allows the folding to occur in a reasonable amount of computing time with the smallest perturbation of the all-atom energy potential. The optimum value of k was determined to be k = 1.5, which corresponds to 0.6–0.75 kcal × mol−1 per contact, depending on the sequence separation.
Systems preparation
Hydrogens were added with PSFGEN (Gullingsrud and Phillips, 2002), through VMD (Humphrey et al., 1996). Unfolded conformations of the proteins were produced by MD runs with reduced cutoff distances for nonbonded interactions. Afterward, they were minimized for 1000 steps using a conjugate gradient method implemented in NAMD2 (Kale et al., 1999), and equilibrated for 50 ps with the CHARMM potential energy function and the CHARMM27 force field.
Molecular dynamics simulations
MD simulations were performed using NAMD2, augmented with the above G potential. Expressions for the additional potentials and corresponding forces were encoded directly into NAMD2 using the C++ programming language. The Verlet (1967) algorithm for integration of the equations of motion was used with the integration step of 1 fs. Cutoff distances for nonbonded interactions were 12 ± 0.5 Å, and a switching function was used for distances >10 Å. All the simulations were performed in the NVT ensemble with a constant temperature of 300 K maintained by the use of the temperature coupling method by Berendsen et al. (1984). All atoms of the system except hydrogens were coupled to the Langevin bath with a damping coefficient of 5 ps−1. The simulations were performed with a continuous dielectric constant of ɛ = 78, without explicit solvation terms. We performed multiple 350 ps simulations for each mutant.
ANALYSIS TOOLS
Fraction of native contacts
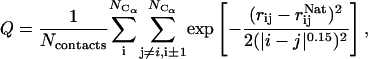
The fraction of the native contacts
 |
(2) |
which measures the similarity of the structure to the native structure was used as the order parameter. All pairs of Cα atoms, except the nearest neighbors, were included into the calculation. The range of Q varies from zero to one; a value of zero represents a completely unfolded conformation, and a Q value of 1 means the structure is identical to the native. Native in this study is the Protein Data Bank structure after equilibration. We used QHi, i = 1–5, which only include contacts in the individual helices of the protein, to measure the formation of helical structures.
Free-energy profiles
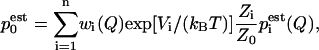
Free-energy profiles were reconstructed using the weighted histogram analysis method, WHAM (Ferrenberg and Swendsen, 1989; Boczko and Brooks, 1993; Frenkel and Smit, 2002). To improve sampling along the reaction coordinate Q, we introduced biasing potentials to the CHARMM force field (without G -like term):
 |
(3) |
where Vi(Q) = ku(Q − Qi)4 and ku = 1. The initial structures for umbrella sampling were generated using unfolding simulations. Initial sampling was performed with steps of 0.05 in Q. The data were placed into 0.01 bins and the weighted histogram analysis method applied. The finer sampling of 0.01 or 0.02 was performed in selected regions with interesting features, e.g., minima and larger barriers, in particular in the unfolded (Q = 0.15–0.4) and native basins (Q = 0.7–0.85). We increased sampling until there was no noticeable change in the potentials. Constant temperature runs of 350 ps were performed, and only the last 250 ps were used for the calculations to ensure proper equilibration. Each of the free-energy profiles required ∼25–30 umbrella potentials, and the profile for each mutant was determined four times and then averaged.
Once the equilibrated data were collected, it was divided into a number of bins Hi(Q) required to have the proper overlap. WHAM estimates the probability density as a linear combination of n different histograms
 |
(4) |
where wi are normalized weights  and Zi are partition functions. Using the weights that minimize the variance of
  (Frenkel and Smit, 2002) the probability density can be estimated by
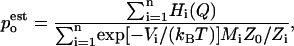 |
(5) |
where Mi is the number of data points in the histogram Hi. This leads to an equation for Zi:
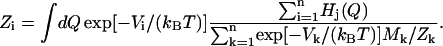 |
(6) |
This is an implicit equation that is solved self-consistently. The resulting ratios of Zi allow one to recover the probability density, and therefore the free-energy profile according to
 |
(7) |
This derivation is based on the assumption of constant temperature and was adapted from Frenkel and Smit (2002).
Mean first-passage time
A nonlinear least-squares method was used to fit the reconstructed free-energy profiles to a sum of eight Gaussians. The resulting analytical function U was used to determine the mean first-passage time. We assumed the system is diffusing on a one-dimensional surface with a single potential barrier (Schulten et al., 1981; Gardiner, 2002). The mean first-passage time (MFPT)  describes the amount of time it takes for the protein to fold from Q = x1 to Q = x2 and is given by
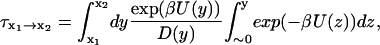 |
(8) |
where U is the free-energy profile, β = 1/kBT, and D is the diffusion coefficient in the Q space. For this folding runs, the diffusion coefficient was calculated according to autocorrelation function of dQ/dt:
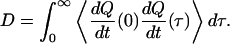 |
(9) |
The diffusion coefficients were calculated in three regions of conformational space: unfolded (Q = 0.2), compact (Q = 0.42), and a native-like (Q = 0.8). The sampling was done in the production runs of the umbrella simulations after initial transients had decayed. The mean first-passage times τ0.2–0.42 and τ0.42–0.8 were calculated assuming potential energy surfaces with a single barrier between Q = 0.2–0.4 and the single broad barrier from Q = 0.42 to Q = 0.8 and effective diffusion coefficients D0.2 and D0.42, respectively. In both cases, the reflective wall at Q = 0.1 enters into the expressions, and the MPFT over the whole region is determined under the assumption that the mean first-passage time is additive.
RESULTS
Folding variants of the λ-repressor
The all-atom hybrid molecular dynamics simulations allowed us to differentiate the folding mechanisms of the various λ6–85 mutants. The results averaged over four runs are shown in Fig. 1. They are qualitatively similar to the results of 10 runs. The total fraction of the native contacts, Q, clearly shows that λQ33Y has the fastest folding kinetics (Fig. 1 a). Analysis of the formation of the individual helices QHi reveals major differences in the folding mechanisms of the mutants. Helix III forms fastest in λQ33Y. Its propensity is greatly increased by the mutations of glycines into alanines at the positions 46 and 48. Based on the secondary structure prediction algorithm (Burton et al., 1998), helix I has one of the highest propensities among the helices in this protein, and it is experimentally known that the peptide is stable in isolation (Marqusee and Sauer, 1994). It is evident from our time-series data that there is a noticeable correlation between the formation of helix I and helix II, possibly caused by the aromatic interaction between the pair Trp22/Tyr33. Helix II is 70% formed within 50 ps after helix I is 70% formed. This correlation is unique to this variant of λ6–85. Finally, the completion of helix IV coincides with the completion of the helix I-helix II pair, which stabilizes the central core of the protein. The order of the structure formation in λQ33Y agrees with the results of Yang and Gruebele (2004) and suggests a quasi-capillary scenario (Wolynes, 1997).
FIGURE 1.

Time series of the helical content for helix I (red), helix II (yellow), helix III (green), helix IV (blue), and helix V (magenta) and the total fraction of the native contacts, Q (black), presented at 100-fs intervals. (a) Increased helical propensity of helix III in λQ33Y is evident. Correlation in the formation of helices I and II is due to the aromatic interaction of the pair Tyr33/Trp22. (b) λA37G shows delayed formation of helix III, which is caused by the reduced helical propensity of helix II. Delay in the formation of helix IV is also evident. (c) λWT is lacking the correlation in the formation of helices I and II, due to the absence of the Tyr33/Trp22 aromatic interaction. Helix III is delayed due to low helical propensity of the wild-type. (Bottom right) Tube representation of λ-repressor showing native conformation with helices in the same color scheme, with positions of the mutations displayed in black. The mutations are Tyr22Trp (helix I) in all proteins, Gln33Tyr (helix II) in λQ33Y and λA37G, Ala37Gly (helix II) in λA37G, and Gly46Ala/Gly48Ala (helix III) in λQ33Y.
The Ala37Gly modification in helix II in λA37G dramatically increases the flexibility of this part of the molecule and slows the formation of the helix II as well as helix III. As a result, λA37G has the longest time of helix III formation among the mutants in the current study. Prolonged disorder of the helix II-helix III pair is also delaying the formation of helix IV.
The studied wild-type λWT is lacking the aromatic pair Trp22/Tyr33 (only Trp22 is present), which is known to produce a stabilizing interaction. In the time series of Fig. 1 c, there is no correlation in the formation of helix I and helix II. Notably, helix II folding in this mutant is not as fast as in λA37G. Clearly, the natural helix propensity cannot compensate for the missing aromatic interaction. Helix III, which is now in its wild-type form, has one of the lowest helix propensities and forms slowly. The overall speed of folding for our wild-type is comparable to the λA37G, at least under the studied conditions, in agreement with experimental results of Yang and Gruebele (Yang, 2003).
The sum of QHi is a measure of the total secondary structure formation of the molecules. Fig. 2 a shows the total helicity as a function of the total fraction of native contacts Q, which does include tertiary contacts.  for the fast mutant displays a nonlinear growth in the beginning of the folding and reaches 60% for Q values as low as 0.25. The formation of the secondary structure of the slow mutant proceeds in the manner close to linear as a function of Q, as can also be seen from Fig. 2 a. Differences in the folding mechanisms are also apparent from the graph of the radius of gyration, Rgyr, as a function of Q, in Fig. 2 b. For the slow mutant, the rapid collapse with subsequent secondary structure formation causes the Rgyr to initially decrease faster than the fast mutant. Upon reaching the collapsed conformations with ∼45% of native contacts formed, the radius of gyration is only ∼20% larger than at a native conformation. From there on, both mutants proceed to form the secondary structure and complete the folding in the comparable time scale.
FIGURE 2.

Helical content ΣQH (a) and radius of gyration Rgyr (b) as a function of the fraction of native contacts Q, for λQ33Y (red curve) and λA37G (blue curve). In the fast variant of λ6–85, the secondary structure (left) forms much faster in the initial phase of folding, during which the collapse (right) dominates the folding of the slower variant.
The free-energy landscape
The free-energy profiles were reconstructed as a function of the total fraction of the native contact, using the weighted histogram method, WHAM, described in the Methods section. Fig. 3 shows free-energy profiles for the fast (upper) and slow (lower) mutants, with the representative structures displayed in the same color scheme as in the Fig. 1 and the mutations in black. The fast mutant free-energy profile is virtually barrierless, with only residual roughness of the order less than kBT present, leading to a populated minimum of the folded basin. The reconstructed profile for the slow mutant shows two comparably populated free-energy minima and an elevated barrier region, which suggests a two-state folding mechanism. The profiles differ dramatically in the region of lower Q. The profile for λQ33Y has only residual roughness and is essentially downhill, where the energy profile of λA37G displays a barrier high enough to slow down the folding. After initial collapse, much of the helical structure is formed by  In particular, helices I, II, III, and partly IV are close to being completely formed. In the region of lower Q values, the slow mutant has to overcome a large barrier of 2.46 kBT, according to our calculations, which is at least twice as large as the roughness on the fast mutant's energy profile. One of the sources of the barrier is the greatly increased flexibility of the helix II region, which forces the molecule to start the collapse from the termini and then complete the compaction.
FIGURE 3.

Free energy as a function of Q. (Upper panel), the fast mutant λQ33Y (red curve). (Lower panel), the slow mutant A37G (blue curve). Selected configurations of the proteins are colored by secondary structure: helix I is red, helix II is yellow, helix III is green, helix IV is blue, and helix V is magenta. Folding of λQ33Y progresses by formation of helices I, II, and III with simultaneous collapse. λA37G folding is delayed by the weakened propensities of helices II and III, which allow hydrophobic collapse to lead the folding. The free-energy profiles were reconstructed from the CHARMM force field molecular dynamics runs using umbrella sampling with the weighted histogram analysis method.
Assuming that the folding is a diffusive process (Socci et al., 1996), we have calculated MFPT τ to the various regions in the landscape. The free-energy profiles are fitted by smooth analytical functions and used to estimate the MFPT. From autocorrelation functions evaluated at the various minima, we estimated that the diffusion coefficient D(Q) changes by a factor of ∼14 as folding proceeds from the unfolded region of Q = 0.22 to the folded basin (see the Methods section for details). Based on these estimates, the diffusion coefficient changes as the molecule explores Q space: D0.8/D0.22 = 14.4 and D0.8/D0.4 = 4.3. The fast mutant folds from Q = 0.2 to Q = 0.42 in τf0.2–0.42 = 0.3 μs, where the slow mutants requires τs0.2–0.42 = 0.65 μs. It takes 2.25 times longer for the slow mutant to fold from the fairly disordered region with Q = 0.2 to the mostly compact region with Q = 0.42. In the later stages, the folding times are similar (τs0.2–0.8–τs0.2–0.42)/(τf0.2–0.8–τf0.2–0.42) = 1.44 . The total mean first-passage times are τf0.2–0.8 = 0.8 μs and τs0.2–0.8 = 1.37 μs. These results are in a good agreement with experimental findings of Yang and Gruebele (2004). Our free-energy calculations estimate that in the beginning of the folding, λA37G has to overcome a 2.46 kBT barrier, where the fast mutant λQ33Y experiences only half as large a barrier of 1.23 kBT along the reaction coordinate.
DISCUSSION
Folding dynamics of λ-repressor variants
In agreement with experiments of Yang and Gruebele (2003, 2004) our simulations clearly show that λQ33Y is the fast and λA37G is the slow mutant. We also see the corresponding shift in the folding mechanism, in particular the destabilization of helices II and III in the slow mutant that is an important feature of their experiments. In the studies of Yang and Gruebele, they assume a free-energy landscape with low barriers and residual roughness to explain the folding kinetics. Our free-energy calculations reveal a rough energy landscape in agreement with their model and the prediction by the variational theory by Portman et al. (1998).
A characteristic feature of λQ33Y folding is the fast formation of the helix I. This is in an agreement with a secondary structure prediction that assigned one of the highest helix propensities to helix I (Burton et al., 1998). Helix I is also experimentally known to be stable on its own (Marqusee and Sauer, 1994). It folds much faster in this mutant than in λA37G and λWT. The folding of the fast λQ33Y mutant that proceeds with an almost sequential formation of the helices is reminiscent of the capillarity picture described by Wolynes (1997) and has been fitted to a collision-diffusion model by Oas and co-workers (Burton et al., 1998). The slow mutant λA37G folding starts with partial formation of helices I and IV and simultaneous collapse. In the first stage of folding, helix formation is clearly faster in λQ33Y than in the case of λA37G (Fig. 2). The figure shows that the total measure of helicity  is increasing nonlinearly with respect to the reaction coordinate. And in the region above Q = 0.35, helices I, II, and IV are at least 70% formed. This agrees well with the experimental studies of A46G/A48G variant by Oas and co-workers (Burton et al., 1997), who reported φ-values close to 1 for helices I and IV, which corresponds to a high probability of their formation in the transition state. The order of the secondary structure formation and collapse obtained from our hybrid MD simulations and free-energy analysis of folding rates agrees well with the diffusion-collision model of Oas and co-workers (Burton et al., 1998), and with the helix formation in the fast mutant determined in the recent theoretical study by Wolynes and co-workers (Portman et al., 1998).
Our free-energy calculations estimate the height of the residual barriers for the fast mutant to be <1.23 kBT, which compares well to the value of 2.1 kBT estimated at the temperature of 60°C (Yang and Gruebele, 2003). According to our MFPT calculations, the fast folding variant is passing through the region of Q = 0.2–0.42, 2.25 times faster than the slower variant. λQ33Y folds to the value Q = 0.4 in ∼0.3 μs, which agrees well with the theoretical results from a variational theory of folding (Portman et al., 2001).
Again, in agreement with the experiments, the variant λA37G is found to fold much slower. The Ala37Gly mutation in helix II causes destabilization of the whole region of helix I through helix III. The wild-type propensity of helix III is not able to compensate for the increased flexibility of the helix II region, which leads to a very large delay in the formation of helix III. Destabilization of helix III for the slow mutant was reported by Yang and Gruebele (2003). It is evident from comparison to the wild-type folding dynamics that helix II formation is assisted in the later stages by the aromatic interaction of the Trp22/Tyr33 pair, but certainly is far behind that in the fast mutant λQ33Y. When the value of Q = 0.42 is reached, helices I, II, and IV are 60% or more formed.
The free-energy profile of the slow mutant reveals the presence of a substantial barrier at lower Q, where the protein is only partially collapsed. We estimate the barrier to be at least 2.46 kBT, which compares very well with the experimental estimate of 3.2 kBT (Yang, 2003). It appears that the rate-limiting step is the achievement of the right topology, which is made difficult by the flexibility of the helix II region.
The number of nonnative interactions varies with the reaction coordinate with a maximum value occurring at  We have studied formation of nonnative contacts in the unfolded regions for the fast and the slow variants. In general, the slow mutant λA37G tends to have a higher number of nonnative contacts formed at
  λA37G has 10% more nonnative contacts than λQ33Y. As shown in Fig. 4, the deep minima in the free-energy profile of the slow mutant is due in part to the higher probability of formation of nonnative interactions between helix II and helix III and residues of helix I, which results from the increased flexibility of the region caused by the Ala37Gly mutation. The formed contacts contribute to slowing down of the initial phase of folding.
FIGURE 4.

Probability of contact formation in the unfolded basin (Q = 0.22) compared to the native contacts for λA37G. Locations of the helices are color-coded. The upper half of the contact map is based on four 500 ps samples of umbrella simulations. The lower half is the contact map of native contacts for λA37G with 8.5 Å cutoff. It is evident that nonnative contacts are present between the helix 2-helix 3 turn and helix 1 (circled).
The wild-type λWT serves as a benchmark in our study. It is missing the second aromatic mutation in residue 33. Thus the aromatic interaction is not present, which is clearly evident from Fig. 1 c, where helix II is lagging behind helix I. On the other hand, the high natural propensities of helices I and IV are obvious as well as the fact that helix III is folding faster when helix II is not weakened. Overall λWT folds slower than λQ33Y.
CONCLUSIONS
The all-atom molecular dynamics simulations allowed us to differentiate the folding mechanisms observed experimentally of variants of λ-repressor, which differ only by point mutations. The fast λQ33Y shows mostly downhill folding, with the secondary structure forming extremely fast, due to increased helical propensity. The slow λA37G mutant is initiating folding simultaneously with collapse and partial secondary structure formation. The increased flexibility of helix II causes additional trapping with a delayed helix formation. The sensitivity of our model lies in the detailed energetic description of the used all-atom force field. Our method can be considered as a fast assay to predict the role of mutations in the folding of small proteins. Its effectiveness on larger systems remains to be tested. Although we have empirically assigned the coupling strength between the full atom and the G potentials to obtain the fastest folding for the system, we are working on a method to vary it continuously to lower values, which should allow a more straightforward comparison to the experimental folding times.
Acknowledgments
The images of molecules were prepared with the molecular graphics program VMD (Humphrey et al., 1996).
We thank Dr. J. C. Phillips of National Institutes of Health Resource for Macromolecular Modeling and Bioinformatics for assistance with programming in the NAMD2 environment. We are also grateful to Prof. M. Gruebele and Dr. W. Y. Yang for helpful discussions.
This work was supported by National Science Foundation grant MCB 0235144.
References
- Beamer, L. J., and C. O. Pabo. 1992. Refined 1.8 Ǻ crystal structure of lambda repressor-operator complex. J. Mol. Biol. 227:177–196. [DOI] [PubMed] [Google Scholar]
- Berendsen, H. J. C., J. P. M. Postma, W. F. van Gunsteren, A. DiNola, and J. R. Haak. 1984. Molecular dynamics with coupling to an external bath. J. Chem. Phys. 81:3684–3690. [Google Scholar]
- Boczko, E. M., and C. L. Brooks 3rd. 1993. Constant temperature free energy surfaces for physical and chemical processes. J. Phys. Chem. 97:4509–4513. [Google Scholar]
- Brooks, B. R., R. E. Bruccoleri, B. D. Olafson, D. J. States, S. Swaminathan, and M. Karplus. 1983. CHARMM: A program for macromolecular energy, minimization, and dynamics calculations. J. Comput. Chem. 4:187–217. [Google Scholar]
- Bryngelson, J. D., J. N. Onuchic, N. D. Socci, and P. G. Wolynes. 1995. Funnels, pathways, and the energy landscape of protein folding: a synthesis. Proteins. 21:167–195. [DOI] [PubMed] [Google Scholar]
- Burton, R. E., G. S. Huang, M. A. Daugherty, T. L. Calderone, and T. G. Oas. 1997. The energy landscape of a fast-folding protein mapped by Ala→Gly substitutions. Nat. Struct. Biol. 4:305–310. [DOI] [PubMed] [Google Scholar]
- Burton, R. E., J. K. Myers, and T. G. Oas. 1998. Protein folding dynamics: quantitative comparison between theory and experiment. Biochemistry. 37:5337–5343. [DOI] [PubMed] [Google Scholar]
-
Cieplak, M., and T. X. Hoang. 2002. The range of the contact interactions and the kinetics of the G
 models of proteins. Int. J. Mod. Phys. C. 13:1231–1242. [Google Scholar]
 - Clementi, C., A. E. Garcia, and J. N. Onuchic. 2003. Interplay among tertiary contacts, secondary structure formation and side-chain packing in the protein folding mechanism: All-atom representation study of protein L. J. Mol. Biol. 326:933–954. [DOI] [PubMed] [Google Scholar]
- Clementi, C., P. A. Jennings, and J. N. Onuchic. 2000a. Now native state topology affects the folding of dihydrofolate reductase and interleukin-1β. Proc. Natl. Acad. Sci. USA. 97:5871–5876. [DOI] [PMC free article] [PubMed] [Google Scholar]
- Clementi, C., H. Nymeyer, and J. N. Onuchic. 2000b. Topological and energetic factors: What determines the structural details of the transition state ensemble and “en-route” intermediates for protein folding? An investigation for small globular proteins. J. Mol. Biol. 298:937–953. [DOI] [PubMed] [Google Scholar]
- Eaton, W. A., V. Munoz, S. J. Hagen, G. S. Jas, L. J. Lapidus, E. R. Henry, and J. Hofrichter. 2000. Fast folding kinetics and mechanisms of protein folding. Annu. Rev. Biophys. Biomol. Struct. 29:327–359. [DOI] [PMC free article] [PubMed] [Google Scholar]
- Ferrenberg, A. M., and R. H. Swendsen. 1989. Optimized Monte Carlo data analysis. Phys. Rev. Lett. 63:1195–1198. [DOI] [PubMed] [Google Scholar]
- Frenkel, D., and B. Smit. 2002. Understanding Molecular Dynamics: From Algorithms to Applications. Academic Press, San Diego.
- Gardiner, C. W. 2002. Handbook of Stochastic Methods. Springer, Berlin.
-
G
 N. 1983. Theoretical studies of protein folding. Ann. Rev. Biophys. Bioeng. 12:183–210. [DOI] [PubMed] [Google Scholar]
 - Gruebele, M. 1999. The fast protein folding problem. Annu. Rev. Phys. Chem. 50:485–516. [DOI] [PubMed] [Google Scholar]
- Gruebele, M. 2002. Protein folding: the free energy surface. Curr. Opin. Struct. Biol. 12:161–168. [DOI] [PubMed] [Google Scholar]
- Gullingsrud, J., and J. Phillips. 2002. PSFGEN User's Guide. Theoretical Biophysics Group, University of Illinois at Urbana-Champaign, Urbana, IL.
- Hagen, S. J., J. Hofrichter, A. Szabo, and W. A. Eaton. 1996. Diffusion-limited formation in unfolding cytochrome c: estimating the maximum rate of protein folding. Proc. Natl. Acad. Sci. USA. 93:11615–11617. [DOI] [PMC free article] [PubMed] [Google Scholar]
- Hardin, C., Z. Luthey-Schulten, and P. G. Wolynes. 1999. Backbone dynamics, fast folding, and secondary structure formation in helical proteins and peptides. Proteins. 34:281–294. [PubMed] [Google Scholar]
- Head-Gordon, T., and S. Brown. 2003. Minimalist models for protein folding and design. Curr. Opin. Struct. Biol. 13:160–167. [DOI] [PubMed] [Google Scholar]
- Huang, G. S., and T. G. Oas. 1995. Submillisecond folding of monomeric λ repressor. Proc. Natl. Acad. Sci. USA. 92:6878–6882. [DOI] [PMC free article] [PubMed] [Google Scholar]
- Humphrey, W., A. Dalke, and K. Schulten. 1996. VMD-visual molecular dynamics. J. Mol. Graph. 14:33–38. [DOI] [PubMed] [Google Scholar]
- Kale, L., R. Skeel, M. Bhandarkar, R. Brunner, A. Gursoy, N. Krawetz, J. Phillips, A. Shinozaki, K. Varadarajan, and K. Schulten. 1999. NAMD2: greater scalability for parallel molecular dynamics. J. Comput. Phys. 151:283–312. [Google Scholar]
- Karanicolas, J., and C. L. Brooks 3rd. 2002. The origins of asymmetry in the protein transition states of protein L and protein G. Protein Sci. 11:2351–2361. [DOI] [PMC free article] [PubMed] [Google Scholar]
-
Koga, N., and S. Takada. 2001. Roles of native topology and chain-length scaling in protein folding: a simulation study with a G
 -like model. J. Mol. Biol. 313:171–180. [DOI] [PubMed] [Google Scholar]
 - Kubelka, J., J. Hofrichter, and W. A. Eaton. 2004. The protein folding ‘speed limit’. Curr. Opin. Struct. Biol. 14:76–88. [DOI] [PubMed] [Google Scholar]
- MacKerell, A. D., Jr., B. Brooks, C. L. Brooks 3rd, L. Nilsson, B. Roux, Y. Won, and M. Karplus. 1998. CHARMM: the energy function and its parameterization with an overview of the program. In The Encyclopedia of Computational Chemistry, Vol. 1. P. von Raque-Schleyer, editor. John Wiley & Sons, New York. 271–277.
- Marqusee, S., and R. T. Sauer. 1994. Contribution of a hydrogen bond/salt bridge network to the stability of secondary and tertiary structure of λ repressor. Protein Sci. 3:2217–2225. [DOI] [PMC free article] [PubMed] [Google Scholar]
- Miyazawa, S., and R. L. Jernigan. 1996. Residue-residue potentials with a favorable contact pair term and an unfavorable high packing density term for simulation and threading. J. Mol. Biol. 256:623–644. [DOI] [PubMed] [Google Scholar]
- Myers, J. K., and T. G. Oas. 2002. Mechanism of fast protein folding. Annu. Rev. Biochem. 71:783–815. [DOI] [PubMed] [Google Scholar]
- Nölting, B., R. Golbik, and A. R. Fersht. 1995. Submillisecond events in protein folding. Proc. Natl. Acad. Sci. USA. 92:10668–10672. [DOI] [PMC free article] [PubMed] [Google Scholar]
- Onuchic, J. N., Z. Luthey-Schulten, and P. G. Wolynes. 1997. Theory of protein folding: the energy landscape perspective. Annu. Rev. Phys. Chem. 48:545–600. [DOI] [PubMed] [Google Scholar]
- Paci, E., M. Vendruscolo, and M. Karplus. 2002. Native and non-native interactions along protein folding and unfolding pathways. Proteins. 47:379–392. [DOI] [PubMed] [Google Scholar]
-
Plotkin, S. S. 2001. Speeding protein folding beyond the G
 model: How a little frustration sometimes helps. Proteins. 45:337–345. [DOI] [PubMed] [Google Scholar]
 - Plotkin, S., and J. N. Onuchic. 2002. Understanding protein folding with energy landscape theory. Part I: basic concepts. Q. Rev. Biophys. 35:111–167. [DOI] [PubMed] [Google Scholar]
- Portman, J. J., S. Takada, and P. G. Wolynes. 1998. Variational theory for site resolved protein folding free energy surfaces. Phys. Rev. Lett. 81:5237–5240. [Google Scholar]
- Portman, J. J., S. Takada, and P. G. Wolynes. 2001. Microscopic theory of protein folding rates. II. Local reaction coordinates and chain dynamics. J. Chem. Phys. 114:5082–5096. [Google Scholar]
- Schulten, K., Z. Schulten, and A. Szabo. 1981. Dynamics of reactions involving diffusive barrier crossing. J. Chem. Phys. 74:4426–4432. [Google Scholar]
- Shea, J. E., and C. L. Brooks 3rd. 2001. From folding theories to folding proteins: a review and assessment of simulation studies of protein folding and unfolding. Annu. Rev. Phys. Chem. 52:499–535. [DOI] [PubMed] [Google Scholar]
- Shea, J. E., J. N. Onuchic, and C. L. Brooks 3rd. 1999. Exploring the origins of topological frustration: design of a minimally frustrated model of fragment B of protein A. Proc. Natl. Acad. Sci. USA. 96:12512–12517. [DOI] [PMC free article] [PubMed] [Google Scholar]
- Shimada, J., and E. I. Shakhnovich. 2002. The ensemble folding kinetics of protein G from an all-atom Monte Carlo simulation. Proc. Natl. Acad. Sci. USA. 99:11175–11180. [DOI] [PMC free article] [PubMed] [Google Scholar]
- Socci, N. D., J. N. Onuchic, and P. G. Wolynes. 1996. Diffusive dynamics of the reaction coordinate for protein folding funnels. J. Chem. Phys. 104:5860–5868. [Google Scholar]
-
Taketomi, H., Y. Ueda, and N. G
 1975. Studies on protein folding, unfolding and fluctuations by computer simulation I: The effect of specific amino acid sequence represented by the specific inter-unit interactions. Intr. J. Peptide. Res. 7:445–459. [PubMed] [Google Scholar]
 - Torrie, G. M., and J. P. Valleau. 1977. Nonphysical sampling distributions in Monte Carlo free-energy estimation: umbrella sampling. J. Comput. Phys. 23:187–199. [Google Scholar]
- Verlet, L. 1967. Computer “experiments” on classical fluids. I. Thermodynamical properties of Lennard-Jones molecules. Phys. Rev. 159:98–103. [Google Scholar]
- Wolynes, P. G. 1997. Folding funnels and energy landscapes of larger proteins within the capillarity approximation. Proc. Natl. Acad. Sci. USA. 94:6170–6175. [DOI] [PMC free article] [PubMed] [Google Scholar]
- Yang, W. Y. 2003. Folding thermodynamic and kinetic characterization of small model proteins: lambda repressor U1A, trpzip2 and PAO-12. PhD thesis. University of Illinois at Urbana-Champaign, Urbana, IL.
- Yang, W. Y., and M. Gruebele. 2003. Folding at the speed limit. Nature. 423:193–197. [DOI] [PubMed] [Google Scholar]
- Yang, W. Y., and M. Gruebele. 2004. Folding λ-repressor at its speed limit. Biophys. J. 87:596–608. [DOI] [PMC free article] [PubMed] [Google Scholar]
- Zhou, Y., and M. Karplus. 1999. Interpreting the folding kinetics of helical proteins. Nature. 401:400–403. [DOI] [PubMed] [Google Scholar]