Abstract
We report the observation of influenza A M2 (M2) incorporated in a dipalmitoylphosphatidylcholine (DPPC) supported planar bilayer on mica, formed by use of a modified vesicle fusion method from proteoliposomes and visualized with contact mode atomic force microscopy. Incubation of proteoliposomes in a hyperosmotic solution and increased DPPC/M2 weight ratios improved supported planar bilayer formation by M2/DPPC proteoliposomes. M2's extra-bilayer domains were observed as particles estimated to protrude 1–1.5 nm above the bilayer surface and <4 nm in diameter. Particle density was 5–18% of the nominal tetramer density. Movement of observable M2 particles was independent of the probe tip. The mean lateral diffusion coefficient (D) of M2 was 4.4 ± 1.0 × 10⁻¹⁴ cm2/s. Eighty-two percent of observable particles were mobile on the observable timescale (D > 6 × 10⁻¹⁵ cm2/s). Protein-protein interactions were also observed directly.
INTRODUCTION
Atomic force microscopy (AFM) provides subnanometer resolution of protein structure with little sample disturbance under optimal conditions (Müller et al., 1997, 1999) in either densely packed amorphous or 2D crystal arrangements of proteins in or on supported planar lipid bilayers (SPBs) and directly adsorbed to mica or other solid supports (Müller et al., 2002). Another powerful use of this instrument is observation of the time-dependent behavior (van Noort et al., 1999; Ando et al., 2001) of noncrystalline proteins in a near-physiological environment at molecular resolution. Although the resolution of noncrystalline/close-packed molecules is not as high as that of proteins when arranged in an ordered lattice (Lin et al., 2001; Slade et al., 2002), resolution is sufficient to observe time-dependent behavior of individual molecules and carries the potential for observing and characterizing protein-protein interactions in SPBs. A first step in this direction is exhibited in this study of the influenza A M2 protein (M2) incorporated in a mica-supported artificial lipid bilayer.
M2 forms homotetrameric proton channels in the viral lipid envelope (Sakaguchi et al., 1997). It represents one of the smallest natural proteinaceous ion channels, perhaps second only to gramicidin. Solid-state NMR suggests a four-helix bundle structure for the tetrameric19-residue transmembrane region (Wang et al., 2001). Although structural detail of the 24 N-terminal extraviral and 54 C-terminal intraviral residues is limited, the N-terminus is quite hydrophilic and NMR evidence indicates that the C-terminus contains an 18-residue amphipathic helix directly following the transmembrane helix that radiates from the channel on the membrane surface (Tian et al., 2003). Analytical ultracentrifugation studies of the M2 protein in dodecylphosphocholine micelles indicate that the protein has a monomer↔tetramer dissociation constant of 2.5 × 10⁻¹⁷ M3 and a tetramer↔octamer dissociation constant of 1.6 × 10−37 M7 (Kochendoerfer et al., 1999).
The channel opens with decreasing pH of the endosome upon endocytosis by the host cell, allowing protons to pass through the lipid envelope of the virus, which facilitates uncoating of the viral RNA in preparation for transcription. The channel is also thought to preserve the native conformation of hemagglutinin by dissipating the pH gradient created in the trans Golgi apparatus as the virion is packaged on its path to budding (Grambas and Hay, 1992). Amantadine blocks these functions of the M2 channel, inhibiting the release of the virus (Grambas and Hay, 1992). Along with M2's importance in the influenza life cycle, it also serves as a model proton-translocating channel due to its relative simplicity and small size (Mould et al., 2000).
In this study, AFM of M2 incorporated in a SPB was performed in a near-physiological environment at molecular resolution. SPBs are commonly formed by the Langmuir-Blodgett technique or by the vesicle fusion method. Vesicle fusion was first reported by Brian and McConnell (1984), and has since become a widely utilized method for SPB formation. SPB applications include biosensors and bioelectronics (Puu and Gustafson, 1997), cell adhesion studies (Groves et al., 2001), and membrane protein studies by AFM in both 2D-crystal (Müller et al., 2002) and dispersed forms (Lin et al., 2001; Slade et al., 2002).
The process and kinetics of SPB formation by vesicle fusion has been investigated using methods such as AFM (Jass et al., 2000; Kumar and Hoh, 2000; Reviakine and Brisson, 2000), quartz-crystal microbalance (Keller et al., 2000; Reimhult et al., 2003), and fluorescence spectroscopy (Nollert et al., 1995). Many factors have been found to influence SPB formation including osmotic stress (Seitz et al., 2000; Reimhult et al., 2003), vesicle size (Reimhult et al., 2003), protein content (Puu and Gustafson, 1997; Granéli et al., 2003), and the presence of Ca2+ (Kalb et al., 1992). SPB formation is thought to proceed in several distinct steps, including 1), adsorption of intact proteoliposomes/liposomes to the surface; 2), collapse of these to form a double bilayer structure; and then 3), rupture of this structure to form a single-bilayer disk (Reviakine and Brisson, 2000; Jass et al., 2000).
As a first step in this work, SPB formation by vesicle fusion was attempted with M2/dipalmitoylphosphatidylcholine (DPPC) proteoliposomes using conditions that had previously been successful with protein-free DPPC liposomes. It was discovered, however, that M2 inhibits SPB formation, which led to the recognition of osmotic gradient methods utilized here that enhance SPB formation and overcome this inhibition. M2 proteins were identifiable as mobile particles ∼1 nm in height above the SPB surface. Judging from the nominal protein density, ∼5% of the molecules were sufficiently stable to be visualized under typical conditions, and up to 18% under ideal conditions. Observable M2 particles were found to move independently of the tip with a mean lateral diffusion coefficient of 4.4 ± 1.0 × 10⁻¹⁴ cm2/s.
METHODS
Proteoliposome and liposome preparation
Purified Udorn M2, which was expressed with a C-terminal His tag, two Cys replacements (C19S and C50S) and isotopic variations (Tian et al., 2002) was prepared in an aqueous solution, 1 mg M2 and 10 mg DPPC per ml ultrapure water or 5 mM sodium phosphate buffer at pH 7. DPPC was obtained from Avanti Polar Lipids (Alabaster, AL). Water used was filtered with a NanoPure filter (∼18 MΩ cm, Barnstead Filter, Fisher Scientific, Fair Lawn, NJ). The proteoliposome solution was usually diluted 20-fold with water and sonicated for ∼5 min. at room temperature using a cup sonicator (80W, 80 kHz output, Laboratory Supplies, Hicksville, NY). Optimal results were obtained when the sonication was terminated just before clarity. This solution will be referred to as the stock proteoliposome solution. In some instances the lipid/protein ratio was adjusted to 20:1 (wt/wt) by addition of powdered DPPC to the stock proteoliposome solution and then prepared following the same protocol. Control DPPC liposome solutions (0.5–1.5 mg/ml), which did not contain M2, were also prepared in the same manner and will be referred to as the stock liposome solution.
SPB formation
SPBs were formed using the vesicle fusion method (Brian and McConnell, 1984), which was modified as follows (exceptions to this modified method are noted in the figures). Typically 20 μl of stock proteoliposome (liposome) solution was placed on freshly cleaved mica and allowed to incubate for 5 min (1 min). Hyperosmotic electrolyte or sucrose solution (40 μl) was then added and the mixture was allowed to incubate for an additional 30 min (10 s). Except where noted, ∼70 mM final electrolyte or sucrose concentrations of this incubation solution were used. The sample was then flushed with ∼2–3 ml of 100 mM sodium phosphate buffer (pH 7.4) by holding the mica at an angle and gently dripping the solution onto it with a 5-cc syringe. The sample stays hydrated throughout the process because it is surrounded by Teflon, as described below. This same flushing solution was used during AFM imaging and is referred to as the imaging solution.
SPBs were not susceptible to deterioration upon flushing. As a control, many samples were imaged and then rinsed for 20–30 s with a stream of water forcefully ejected from a squeeze bottle, rinsed again with imaging solution and then reimaged. No noticeable difference was found in the lipid coverage after the vigorous rinsing.
The temperature of the AFM imaging buffer, during use, was measured by inserting a thermocouple (80-μm diameter wires) directly into the drop of imaging buffer (∼100 μl) and monitoring until it had largely evaporated (2.5 h). The maximum temperature attained was 31.2 ± 0.5°C. All samples were kept well hydrated while imaging. Therefore DPPC (Tm = 41°C) is in gel phase during imaging.
Atomic force microscopy
All images were obtained using a multimode AFM (Nanoscope IIIa, Digital Instruments, Santa Barbara, CA) in contact mode. AFM probes used were Si3N4 oxide-sharpened twin tips with 200-μm-long cantilevers (0.06 N/m, Digital Instruments). Both a ∼13-μm scanner (E-scanner) and ∼1.5-μm scanner (A-scanner) were utilized in conjunction with a commercial fluid cell (Digital Instruments). Before experiments the fluid cell was cleaned by rinsing with chloroform (reagent grade) and ultrapure water, drying with nitrogen after each rinse. All images (except that seen in Fig. 4) were obtained in a free standing droplet, contained within a 5-mm diameter disk of mica (V-4 grade, Structure Probe, West Chester, PA) that was bound with super-glue (495 Superbonder, P/N 49504, Loctite, Rocky Hill, CT) to a 12.7-mm diameter Teflon disk, which in turn had been glued to a 12-mm diameter steel disk (Schabert and Engel, 1994). Roughening of the Teflon surface with 100-grit sandpaper was necessary to achieve a good mechanical bond between the Teflon and mica. In Fig. 4 an O-ring, minimally coated with high vacuum grease, was used to contain the imaging solution bath.
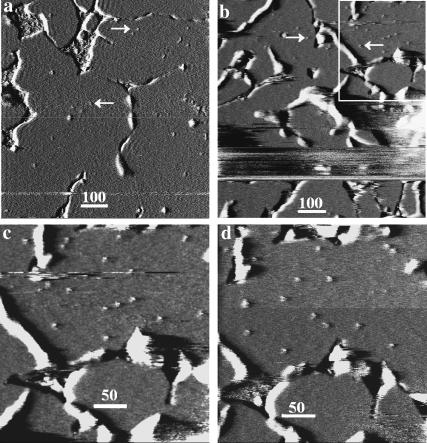
FIGURE 4.
SPB boundaries limit M2 particle diffusion and decreased protein/lipid ratios result in fewer particles. AFM deflection images of a nearly complete SPB formed from a mixture of stock proteoliposome solution and powdered DPPC that was sonicated for ∼15 min, resulting in a 20:1 lipid/protein ratio solution. This sonicated mixture was then incubated on mica overnight, flushed with isosmotic solution, and subsequently imaged. The images are deflection images. Light areas indicate a positive error signal, or in general that the tip is rising, and dark areas a negative error signal, or in general that the tip is falling. The smooth gray areas are regions of bilayer, whereas the white and black boundaries occur as the tip goes in and out of defects separating the bilayer domains. (a) A sample where larger SPB domains formed and consequently the particles (two examples pointed to by the white arrows) are more evenly distributed than in b, where smaller domains are visible and more segregated groups of particles are visible. The white box in b indicates the area of focus in c and d, which are images of the same area captured 1 min 20 s apart. The particles were observed to move within domains of the SPB as shown in c and d; however, no particles appeared in domains previously devoid of particles.
Typically 1- to 1.5-μm scans were made on 10 distinct areas of the mica in each experiment by turning the x-y micropositioners one-quarter turn (∼80 μm) after each image or series of images to acquire a good statistical representation of the entire sample.
Tip contact forces were routinely kept as light as possible during imaging by allowing the cantilever time to relax (usually a half-hour or more) in the fluid cell prior to imaging, which minimized drift, and by adjusting the deflection set point while imaging to compensate for any remaining drift. Tip-sample interaction and nominal scanning force were monitored by periodically capturing force distance graphs after captured scans. Contact force was calculated using the nominal spring constant of 0.06 ± 0.03 N/m; consequently, all stated forces are accurate to within ±50%.
The difference between the surface height and the height scan is equal to the error in the feedback loop. A more accurate representation of the height can be obtained by adding the feedback error (the deflection signal calibrated for height) to the piezo height signal. To accomplish this we calibrated the deflection signal for height prior to each tip engagement. Except where noted the displayed images are the sum of the calibrated deflection signal and the height scan.
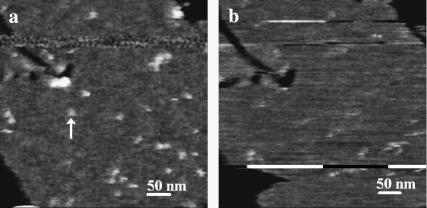
Heights were calculated for each particle using “bearing analysis” which provides a histogram of pixel heights for a region of the image. The regions analyzed consisted of the object to be measured and its immediate surroundings. The height difference between the middle of the peak representing the average bilayer surface height and the highest value in the histogram (representative of the top of the particle) was then measured. The scan speed used for most images was 8–30 μm/s because at low scan speeds (<5 μm/s) resolution of the particles deteriorated and sometimes particles could no longer be detected (Fig. 1). The best resolution of M2 was generally achieved using imaging buffers of ionic strength between 50 and 100 mM.
FIGURE 1.
M2 particles are readily visible at high, but not low scan speed. AFM images taken consecutively of the same 440 by 440 nm portion of an SPB formed on mica using stock proteoliposome solution. Image a was captured first at a scan speed of 36.6 μm/s followed immediately by b at a scan speed of 4.95 μm/s. Applied force in both scans is <240 pN. The image is height-encoded using a gray scale, with black indicating low areas and white higher areas. The black parts of the image are defects in the SPB and the white (M2) particles are higher than the surrounding gray lipid bilayer. One such particle seen in a but not b is denoted by the vertical white arrow in a. Bar in lower right area of each scan = 50 nm.
Lateral diffusion coefficient analysis
The lateral diffusion coefficient (D) of SPB-incorporated M2 was calculated based on observations of single-molecule movement using the equation:
 |
(1) |
where N is the number of molecules analyzed, Δxi and Δyi represent the change in the position of the ith particle between observations in the x and y directions, and Δt is the time between observations. The particles used for the calculation of D were limited to those that could be observed in two successive scans and identifiable as slightly mobile particles in a reasonably stable constellation of particles and lipid features. The average D for 66 particles in five areas of two separate samples was calculated. The times between observations of a given particle were such that the change in its position was less than approximately half the mean particle separation so that individual particles could be tracked. When identification of individual particles was ambiguous the data were not used. If the movement of any particle in either the x or y direction was <5 nm between observations, movement along that axis was considered below the resolution limit and was disregarded.
To correct for drift and uncompensated piezo aberrations in the x and y directions, the movements from scan to scan of several fixed reference points within regions on a sample were analyzed. Edges of lipid defects and unincorporated M2 on the surface of the mica were commonly used as reference points.
This method allowed accurate determination of diffusion rates below 2 × 10⁻¹³ cm2/s (limited by the mean particle separation in our range of particle densities) and above 6 × 10⁻¹⁵ cm2/s (limited by resolution, drift, and the longest times between observations).
RESULTS
Supported planar bilayer formation
SPBs were readily formed from DPPC liposomes on mica after <10 min incubation in isosmotic conditions. They were sturdy (i.e., could not be easily removed by manual flushing), could be plowed aside by the AFM tip using a large applied force, and had occasional defects where mica could be imaged, demonstrating the bilayer surface to be ∼6 nm above the mica surface, which is in agreement with previous work in similar conditions (Mou et al., 1994). Individual lipid headgroups were never observed, presumably due to the lateral diffusion coefficient of DPPC in gel phase, which is likely to be comparable to dimyristoylphosphatidylcholine in the gel phase on the upper surface of a multibilayer (∼2 × 10⁻¹⁰ cm2/s; Balcom and Peterson, 1993).
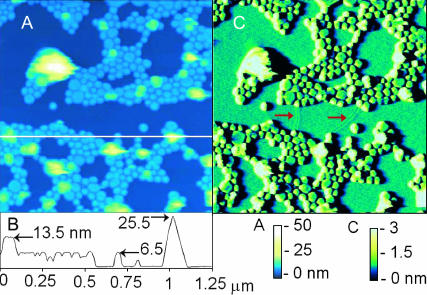
SPBs formed more quickly (<2 min) during incubation in hyperosmotic (∼50 mOsm higher than the inside of the liposomes) sucrose or electrolyte solution using protein-free liposomes. Fig. 2 shows a representative scan of a SPB formed under hyperosmotic conditions. The dark blue area in Fig. 2 A is the top of a nearly complete SPB. The evidence for this is the line defects seen near the middle of the deflection image (Fig. 2 C), indicative of incompletely merged bilayer domains. The light blue, round objects are single-bilayer disks that rise ∼6.5 nm above the SPB surface, as can be seen from the scan-line height profile (Fig. 2 B). The height of this second bilayer is slightly larger than the thickness of a single bilayer on mica (Leidy et al., 2002). Green double-bilayer disks (∼13 nm in height above SPB) are seen positioned among the lower light blue disks and presumably represent unsheared, flattened vesicles. The smallest of the single-bilayer disks are ∼35 nm in diameter and appear to have formed from half of a 32-nm diameter liposome, with other vesicles apparently ranging up to >150 nM in diameter. The yellow to white objects are much higher and more labile (evidenced by the variable height on successive scan lines, seen as yellow and white irregular areas in Fig. 2 A), indicating that they are larger, possibly unflattened, adsorbed liposomes. Objects in subsequent images that have heights, shapes, and lateral dimensions similar to the objects described above are referred to as “lipid structures.”
FIGURE 2.
Formation of SPBs from vesicles. AFM image of lipid layers formed from DPPC liposomes on mica; height (A) with a corresponding height contour (B) and deflection (C) images are displayed. The height image shows single- (light blue) and double-bilayer (green) disks and unflattened liposomes (yellow and white) adsorbed to a complete SPB (dark blue). The dark blue surface is known to be the surface of a complete SPB and not mica due to two line defects (red arrows) characteristic of an SPB that are visible near the middle of the deflection image. The horizontal line in the image shows the path of the height contour shown in B. The numbers in B indicate height of the indicated object above the surface of the underlying SPB. The ∼26-nm tall object is an adsorbed liposome.
Spontaneous and induced defects in the lipid bilayer were quite stationary. Commonly with proteoliposomes, a thin (∼2.5-nm) layer of particulate matter, having the appearance of unincorporated protein, was observed in defect regions (holes in the lipid) on the mica. It was found through several independent evidences that the particulate matter precluded SPB formation.
Isosmotic incubation solution produced no significant SPB formation from stock proteoliposome solution in 0–2 days. However, incubation in hyperosmotic (positive by 50–100 mOsm relative to the inside of the proteoliposomes) sucrose or electrolyte solution and incubation times of ∼30 min produced good (>50%) mica coverage by the SPB at room temperature.
Observation of M2 incorporated in a supported planar bilayer
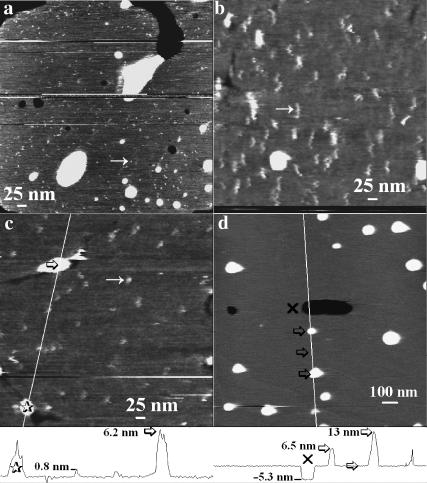
In samples prepared using stock proteoliposome solution, a high density (180 ± 90 μm−2) of small particles, ∼1 nm in height and uniform in apparent size (within a given scan), were observed (Fig. 3, a–c). These will be referred to as particles. As will be shown below most of these particles are mobile on the AFM-observable timescale. No mobile particles were observed in M2-free control samples (Fig. 3 d). However, a low density (∼3 μm−2) of stationary objects of height and size similar to particles was observed in DPPC liposome controls. The particles in Fig. 3, a–c, differ in the apparent diameter and shape of particles, evidently due to differences in the AFM tip used. To facilitate the description, we will assume that Fig. 3 b was obtained using a large elongated tip, whereas Fig. 3 a displays particles observed with an exceptionally sharp tip and Fig. 3 c an average tip. We note that the particle density appeared to be much greater in the sample scanned with an exceptionally sharp tip (Fig. 3 a), even though the protein content of the proteoliposome solution was unchanged.
FIGURE 3.
Apparent M2 particle size varies with tip radius and mobile particles are absent in protein-free liposomes. Height-encoded gray-scale AFM images ranging from black to white (black lowest, i.e., mica) in ∼3 nm. Scans a, b, and c are 560 nm square, whereas d is 1.5 μm square. All images were obtained under similar applied force in 100 mM sodium phosphate buffer (pH 7). The SPBs imaged were formed on mica using stock proteoliposome solution (a–c) or, as a control, DPPC liposomes (d). The tip was found to be responsible for the elongated shape of the particles in b, as their appearance changed to a shape similar to that in c between consecutive scans, indicating that the tip shape had changed. In a, the tip is exceptionally sharp as evidenced by better overall resolution and especially the smaller diameter of the observed particles. In c, a typical scan for an average resolution tip is shown. The diagonal lines in c and d indicate the path of the height cross sections shown in the height traces below c and d, respectively; the 𝒳, stars, and arrows indicate matching points in the scans and height contours. The heights are measured relative to the bilayer surface.
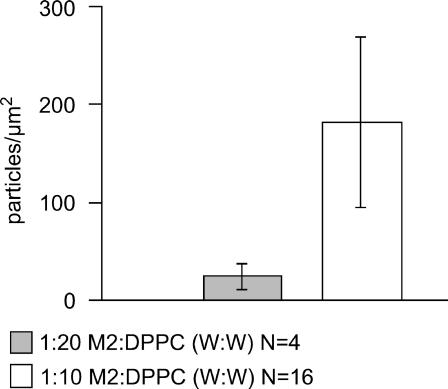
To evaluate whether the observed particle density was related to the lipid/protein ratio, the lipid/protein ratio of the stock proteoliposome solution was increased from 10:1 to 20:1 by direct addition of powdered DPPC (see Methods). A reduction in particle density to 24 ± 13 μm−2 was consequently observed (Figs. 4, a and b, and 5). In some cases (Fig. 4, b–d), particles were unevenly distributed throughout the SPB. Domains of higher particle density were separated from low/zero-density domains by visible boundaries in the SPB. These boundaries, which created incompletely joined bilayer regions and at times appeared as nothing more than curved lines, were seen frequently and were a useful indicator of a lipid bilayer as opposed to mica when imaging near-perfect bilayers (Fig. 2). Although particles were observed to move within high-density domains, they did not cross over the defects into low/zero-density domains. The size and shape of the SPB domains indicate that they result from SPB domains formed by one or several proteoliposomes/liposomes that have not completely coalesced, resulting in a noncontiguous bilayer. Domains of high particle density (formed mainly from proteoliposomes) and low/zero particle density (formed mainly from liposomes) indicate that mixing of proteoliposome and liposome components was incomplete.
FIGURE 5.
Particle number density decreases with decreased protein/lipid weight ratio incubating solution. One outlier data set was not included in this analysis. In the sample imaged with an exceptionally sharp tip a much higher number density than normal was observed (677 ± 93 particles/μm2, Fig. 3 a).
For most samples, M2 density with the stock proteoliposome solution varied between 100 and 300 molecules μm−2 over the widely (∼1-mm) separated areas scanned. However, with AFM tips giving the smallest particle size (i.e., the sharpest tips, as seen in Fig. 3 a), the observed particle density was up to 780 particles μm−2. At a mass ratio of 10:1 (DPPC/M2) ∼6,000 particles μm−2 was expected, assuming tetrameric oligomericity.
Height
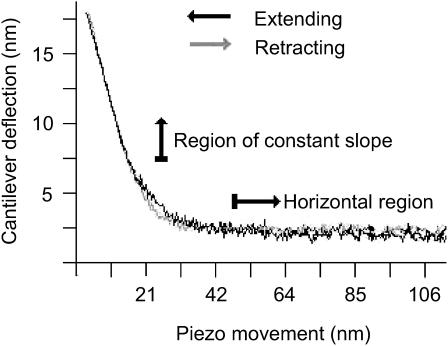
Individual particle heights above the bilayer, measured from the experiments represented in Fig. 3, a–c, and using bearing analysis, were monodisperse as seen in the histograms of Fig. 6. The mean heights ± one SD were 0.47 ± 0.12 nm (<300 pN applied force), 0.94 ± 0.25 nm (<600 pN, 300 pN median force), and 0.83 ± 0.22 nm (<300 pN) for samples measured with sharp, dull, and typical tips, respectively. In all of these scans no attractive force was detected and the long-range repulsive force between the sample and the tip was calculated at between 0 and 200 pN using the force-distance curve as previously described (Müller et al., 1999). Briefly, the repulsive force is determined by the length of the transition region between the horizontal (zero repulsive force) and constant-slope (hard-contact) regions (Fig. 7).
FIGURE 6.
M2 particle-height histograms for tips of apparently different radii. Particles were imaged in 18 separate scans using the dull (a), typical (b), and sharp (c) tips. Fig. 3, a–c, shows three of the images analyzed to produce these histograms. The number of particles analyzed for each histogram was ∼670.
FIGURE 7.
Force distance graph for protein-containing SPB, which displays cantilever deflection (y axis) versus piezo movement (x axis) as the tip approaches the sample (extending, indicated by the black line) and pulls away from the sample (retracting, indicated by the light gray line). The sample in this case is an SPB formed from the stock proteoliposome solution. This graph was chosen for its large repulsion for ease of demonstration. Tip sample repulsion was calculated by observing the amount of cantilever deflection between the horizontal and constant slope regions (10 nm in this graph). Using Hook's law and cantilevers (spring constant 60 pN/nm) one can calculate tip sample repulsion (600 pN in this graph). Imaging solution is 100 mM sodium phosphate buffer (pH 7.4).
Particle height was found to be slightly dependent on the tip size (Fig. 6). Although similar net forces (applied minus repulsive) were measured for all three tips, the sharp tip would exert a larger pressure on the protein at a given imaging force than a dull tip whose net force is supported over a larger surface area. Thus the correlation between protein height and apparent tip shape can be interpreted as largely a product of local pressure differences leading to differing levels of protein deformation.
Mobility
The particles were observed to move on a timescale (s) similar to the time between captured images. Upon examination of matching regions of two successive scans temporally separated by ∼80 s, only 18% of the 75 particles in the first scan had a particle within 5 nm of its position in the second scan. Thus 82% of the particles were observed to diffuse faster than the lower detection limit (6 × 10⁻¹⁵ cm2/s). Although tip-sample forces in contact AFM could certainly be large enough to move the particles, scans were made under low force conditions where interactions were minimized, and therefore played a small role in particle movement as demonstrated by the following observations and analysis.
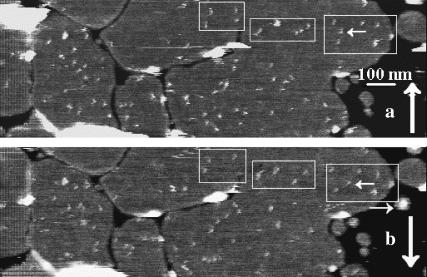
A high degree of correlation was found between the positions of particles in the upper area of two successive images where the first image was captured in the up scan direction and the second image was captured in the down scan direction, as shown in the upper portion of Fig. 8. This is apparent to the eye in the persistence of identifiable constellations outlined by boxes in the top parts of a and b. In this area, time between observations of the particles is short in successive scans. For instance, the constellations in the boxes are slightly different in b than in a. Conversely, very low correlation is seen in the lower part of the scans, which because of the scan directions, were more temporally separated. This behavior was observed in passing in all sequential scans of M2-containing SPBs and with more in-depth analysis in over 10 independent sets of scans. For regions within images separated by greater time gaps, vestiges of initial constellations could be identified, but assignments cannot be unambiguously made, so these data were not used in diffusion analysis.
FIGURE 8.
Importance of lag time in persistence of particle constellations. AFM images (1,500 nm × 454 nm) of SPBs derived from stock proteoliposome solution. The image is gray-scale height-encoded, white being farthest from the mica surface and black closest to it (the surface of the SPB is gray). Image a was acquired at the top after raster scanning in the direction indicated by the vertical white arrow, and image b was subsequently captured raster scanning downward. The speed of the tip along the slow-scan axis (up and down) is 29.8 nm/s (512 lines/scan, 10.17 lines/s), and therefore time between observations of particles ranges from 0.1 s for the top pixel line to 30.4 s for the bottom pixel line. The particles inside the white box display similar positions in scans a and b, demonstrating the principle of minimal constellation change. However, one particle moves more than the rest (denoted by the horizontal arrows). This particle moved with an average speed of 3.8 nm/s in the 7.6 s between observations, which corresponds to a diffusion coefficient of ∼3 × 10⁻¹³ cm2/s. Minimal movement of the lipid bilayer was also observed. The most noticeable example in this graph is the appearance of a small lipid island pointed to by the horizontal arrow in b that is not present in a.
If the observed movement were due to tip-sample interactions, similar magnitude changes in position would be expected for particles in all regions of the scan. However, because (as seen in Fig. 8) the particles in the lower part of the scan exhibited more movement than the particles in the upper part of the scan, tip-sample interactions must not be the major source of particle movement. Rather the movement appeared to be random in nature supporting the hypothesis that particle movement results from random thermal motion of the lipid-protein system.
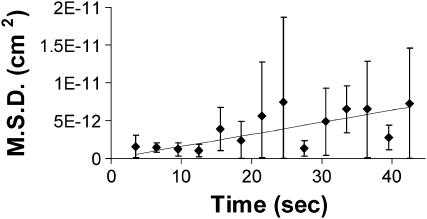
Further evidence of the random nature of particle movement is shown in Fig. 9. Fig. 9 displays the mean-square displacement (MSD) ± SD between two successive scans of 66 different particles in two separate samples. The time between observations for each particle is unique; therefore particles were grouped in 3-s bins and averaged. This graph shows that MSD increases with time; for a diffusive process, a large standard deviation is expected and is evident here. The fitted curve is the straight line expected for simple diffusion. A second-order polynomial term to represent drift (as might be expected for directed tip-induced motion) does not seem necessary to explain the observed fluctuations in position. Therefore largely random motion is suggested by this data.
FIGURE 9.
Mean-square displacement versus time can be fit to a line. The MSD between two consecutive scans of 66 different particles in five different areas of two samples is graphed versus time. The time between observations for each particle is unique; therefore particles were grouped in 3-s bins and averaged.
To further characterize the nature of particle movement, vectorial displacement was analyzed. Directed movement would not be expected along the fast scan (x) axis because the tip passes back and forth over the particles with no preferred direction. However, directed movement may be possible along the slow-scan (y) axis because the tip could interact with each particle from either top or bottom (depending on the y-scan direction) on each x scan, effectively nudging the particle along. Along the fast-scan (x) axis the average particle movement (± SD) was 7 ± 16 nm to the right in up-then-down scans and 4 ± 16 nm to the left in down-then-up scans. Along the slow-scan (y) axis the average particle movement was 9 ± 14 nm downward in up-then-down scans and 7 ± 11 upward in down-then-up scans. These data could indicate a directional component to particle movement; however, they support the hypothesis that particle movement is largely diffusional because the average movement is similar along both the fast- and slow-scan axis and is smaller than the standard deviation.
Based on these data, random walk behavior of the particles was assumed and an average lateral diffusion coefficient D of 4.4 ± 1.0 × 10⁻¹⁴ cm2/s (± standard error) was calculated. This value is consistent with D = 3.8 × 10⁻¹⁴ cm2/s obtained from the slope of a linear fit to the MSD data mentioned above.
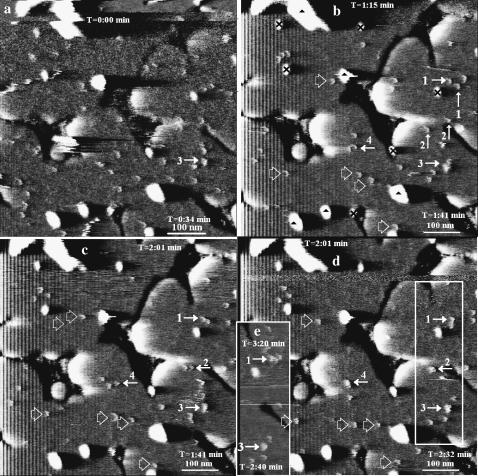
Fig. 10, a–e, further illustrates particle motions. The same types of objects as were identified previously were observed on the bilayer in this series of four whole and one partial scans. Particles were observed (∼1 nm in height and of the smallest lateral dimensions, arrows 1 and 2, Fig. 10 b). Some stationary objects (2.5 nm high) are denoted by the black 𝒳's in Fig. 10 b and adsorbed lipid structures (as large as 5–7 nm high) are denoted by the black triangles in b. The time stamps indicate the time at the start and finish of each scan relative to the top of scan a. The enumerated particles in scan b, which followed image a by 1:15 min, are seen to diffuse readily. The principle of minimal constellation change can be seen in the top regions of images c and d, which were separated by only ∼5 s because of the change of scan direction.
FIGURE 10.
Evolution of particle constellations and particle-particle interactions. AFM deflection images of a nearly complete SPB made with stock proteoliposome solution and imaged in 100 mM sodium phosphate buffer (pH 7.4). See caption to Fig. 4 for aid in interpretation. The corresponding height mode images displayed the same particle behavior and were not used for purely aesthetic reasons. The scans are consecutive and observation occurred at the upper and lower regions of the scans at times indicated in the upper and lower right corners of the images. All scans except e were taken at a uniform scan rate. The particles indicated by 1, 2, and 4 are 1 ± 0.1 nm high in b and c, but grow in lateral size and in height to 1.3 ± 0.1 nm after merging in d. The mean heights of the hollow-arrow marked particles is 1.0 ± 0.2, 1.0 ± 0.0, and 1.0 ± 0.2 nm in scans b, c, and d, respectively. Also, the mean height of particle 3 in scans a–d is 1.5 ± 0.3 nm and has larger lateral dimensions throughout the scans, indicating that it is composed of multiple particles.
These scans also illustrate interaction between particles. For instance the two particles identified with numeral 1 in scan b collide in scan c and remain associated and stationary in scans d and e, a period of 90 s. Likewise the particles indicated by arrows denoted 2 are separate in b (and a), associate in c, and merge in d. Particles 3 and 4 (the latter not uniquely identified in image a) appear to represent cases of similar interactions. The particles indicated by 1, 2, and 4 are 1 ± 0.1 nm high in Fig. 10, b and c, but grow in lateral size and in height to 1.3 ± 0.1 nm after merging in Fig. 10 d. Also the mean height of particle 3 in scans a–d is 1.5 ± 0.3 nm and has larger lateral dimensions throughout the scans, indicating that it is composed of multiple particles.
DISCUSSION
Identification of M2
As mentioned, there were many different objects observed regularly in images of SPBs formed with stock proteoliposome solution and protein-free liposomes. However, almost all of these can be positively identified as either lipid or M2. The high number density, small uniform size within a scan, and unique mobility of the “particles” make them easily distinguishable from other features on, in, or under the SPB. Several characteristics of these particles indicate their identity as M2. First, particles exhibiting these characteristics (particularly the mobility and density) are not found in M2-free control samples. Second, the observed heights and diameters of the particles are within reasonable expectations for the extramembranous domain of M2. Third, the particles largely display random walk movement which is characteristic of an object suspended within the lipid bilayer. And last, the density of observed particles is within one order of magnitude of the nominal density and decreases with decreased protein concentration.
The standard for particle identification was based on the average size and height of mobile particles. Thus, any stationary particles within the size and height range of the moving particles within a given scan were also considered to be M2. Also, the majority of stationary objects of size and height slightly larger than the particles (typically 1–2.5 nm) is thought to be aggregated M2, as discussed in the Density and Mobility sections below. These aggregates could only be positively distinguished from other contaminants of similar size in a small number of cases and so were not analyzed.
Although the data indicates that the particles are M2 protein, it is not obvious how many subunits they have from their shapes, sizes, or density. The particles are small enough that they could be monomers or partly submerged tetramers. If the particles were monomers, we would expect to commonly observe aggregates of four particles based on the expected tetrameric conformation. The lack of observed tetrameric aggregates suggests that the particles themselves are tetramers. At the protein concentration used here, 89 μM in the undiluted samples, the expected concentration of monomers predicted from the tetramer dissociation constant of 2.5 × 10⁻¹⁷ M3, and the octamer dissociation constant of 1.58 × 10−37 M7 obtained by analytical ultracentrifugation for the M2 protein in dodecylphosphocholine micelles (Kochendoerfer et al., 1999), is 4.6 μM, and the tetramer and octamer concentrations are 18.4 μM and 1.4 μM, respectively. Because our experiments are done in bilayers rather than in micelles, we expect this to represent a lower limit on the relative tetramer (and octamer) concentrations. Therefore the ratio of tetramers to monomers is expected to be at least 4. Furthermore it is possible that monomer pairs may be linked by disulfide bonds between Cys17 residues, which would further enhance the likelihood of the tetrameric state.
Height
There are many factors known to influence the observed height of biological samples measured in contact-mode AFM. They include surface charge density of the tip and the scanned surface, the ionic strength of the imaging buffer (Müller and Engel, 1997; Müller et al., 1999) and the applied force (Müller et al., 1995, 1997). The following is an analysis of how the measured particle heights were affected by these three factors in the current study.
The surface charge of Si3N4 tips is known to be negative above pH 6 (−0.032 C/m2 at pH 7; Butt, 1991). The Henderson-Hasselbalch equation predicts a surface charge density of −0.002 C/m2 for our samples, assuming 1000 M2 tetramers μm−2 of SPB surface. The long-range repulsive force produced by the electrostatic interaction of the tip and the SPB surface is expected to decline with increased ionic strength of the buffer. This was observed with force-distance curves measured on SPBs (like the one shown in Fig. 7), which revealed typical repulsive forces between 0 and 100 pN at 100 mM monovalent salt concentrations. In this study the typical force applied to the cantilever was 300 pN. While imaging purple membrane bacteriorhodopsin protein, Müller and co-workers found that a 300–600 pN applied force (with ∼100 pN repulsive force) produces only reversible distortions (Müller et al., 1995). Therefore some protein deformation of M2 is likely, but should not be permanent. Of course, in this study, fluctuations in applied force are expected because the force applied to the cantilever was adjusted while imaging in response to vertical drift. Therefore some regions were scanned at applied forces much less than 300 pN as evidenced by the periodic disengagement streaks seen in some of the scans (i.e., bottom of Fig. 1 b). Consequently the most accurate heights are probably those on the higher end of the bell curve of heights seen in Fig. 6, which presumably represent the heights of proteins scanned with less applied force. Also, the most accurate height values are thought to be those obtained with the typical and dull tips, where pressure on the protein was minimized. As seen in Fig. 6, height values from the median to the upper end of the bell curve range between 1 and 1.5 nm for the typical tip. Therefore, it is concluded that the most common oligomeric unit of M2 observed rises between 1 and 1.5 nm above the bilayer surface.
Assuming a protein density of 1.4 g/cm3 (Harpaz et al., 1994) and hemispherical shape, a tetramer of 60-residue C-termini (including a tag of six histidines) is 35 nm3 in volume and would rise 2.6 nm above the hydrophobic region of the bilayer. A tetramer of 24-residue N-termini would be 13 nm3 in volume and 1.8 nm in height. The average head group thickness in a DPPC bilayer is ∼0.5 nm (Israelachvili, 1985); therefore, the intra- and extraviral portions of the protein would rise 2.1 and 1.3 nm above the surface of the SPB. The measured height of 1–1.5 nm agrees well with the expected N-terminal height.
Diameter and oligomericity
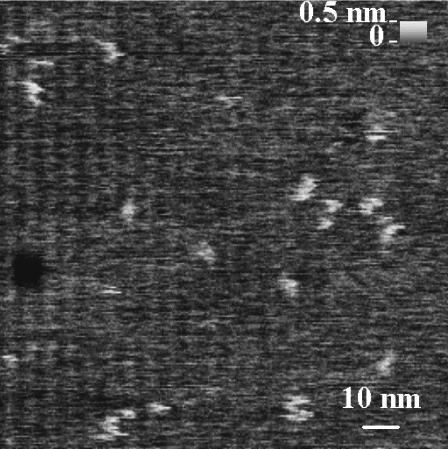
The apparent diameter of objects is highly tip-dependent in AFM when the radius of curvature of the object being scanned is similar to the radius of curvature of the tip. The mean full width at half maximum (FWHM) diameter obtained with the sharp tip was ∼4 nm (0.5 nm mean height, Fig. 11). However, the apparent protein diameter is undoubtedly broadened due to the finite extent of the tip. An analysis of oxide-sharpened silicon nitride tips showed the sharpest tips to have a radius of 1 nm and a 30° conical angle (Sheng et al., 1999). This geometry for our sharpest tip and a hemispherical protein shape yields an approximate measured diameter of 2 nm. However, tip-induced deformation of the sample, which is more pronounced with the sharp tip (as evidenced by the reduced height data) could diminish the apparent observed width (Yang et al., 1996). Furthermore dull tips make the particles appear much larger in diameter (Fig. 3 c), often 10–20 nm, but this reflects the tip diameter more than the particle diameter.
FIGURE 11.
Enlargement of highest-resolution image. AFM image of a 100-nm2 region of a SPB made with stock proteoliposome solution. The white particles are M2, whereas the black circular area is a defect in the SPB. The mean FWHM of the particles is ∼4 nm. The original scan was 230 nm2.
Tetrameric M2 widths (at the SPB surface) were calculated at 2.8 nm (N-terminus FWHM) and 4.4 nm (C-terminus FWHM) assuming a hemispherical and spherical segment shape of 13 and 35 nm3 volume (respectively) that both rise 1.3 nm above the bilayer surface. On the other hand, monomeric M2 diameters are 1.7 nm (N-terminus) and 2.7 nm (C-terminus), assuming a cylindrical shape and volumes of 3.25 and 8.75 nm3, respectively, that both rise 1 nm above the bilayer surface. Thus, the mobile M2 molecules, which were measured at ∼2 nm diameter (FWHM), are of dimensions expected for monomers. However, given the experimental and theoretical uncertainties, the apparent diameter is not inconsistent with the expected tetrameric structure.
As mentioned in Results, it is difficult to discern the oligomericity for these freely mobile particles from their size and shape, probably because they move somewhat on the time scale of image sweeps and because the tip has a similar radius of curvature as the particle. In addition the sharpest tips, which give the best lateral resolution, may distort the lipid and protein surfaces, yielding lower apparent height and width (Yang et al., 1996). Furthermore, in the undistorted structure the protein terminus may be partially buried in the membrane due to hydrophobic forces.
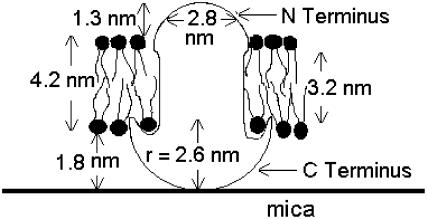
The diagram in Fig. 12 illustrates the apparent dimensions of the particles based on the following observations and assumptions: height data obtained with a typical tip, FWHM obtained with a sharp tip, and assumed hemispherical shape resulting in a displayed FWHM width of 2.8 nm and a height of 1.3 nm. The C-terminus representation is based on the calculated volume and assumed hemispherical shape, with no intention of considering the volume of the amphipathic helix (Tian et al., 2003). Contact of the C-terminus with the mica is illustrated, but similar speculations could be made for contact with the N-terminus.
FIGURE 12.
This diagram for the protein dimensions is based on an assumption of 0.7 gm cm−3 protein density, hemispheric protein shape, the number of transmembrane and extramembrane residues, the approximate water-layer thickness, and the measured height and width of the observed particles. For this diagram, it is assumed that the larger C-terminus is responsible for the contact with mica that hinders diffusion to the observable range. However, the shape of the C-terminus is probably more complex than is depicted here. The opposite orientation cannot be ruled out. Likewise, even though particle distribution is random, there is no observed bimodality to shapes or sizes, so we conclude that either both termini are similar or only one of the two termini is observable.
Density
Observed particle densities were only ∼5% of the expected value. Several factors may account for the low and variable densities observed. The wide range in observed densities may be a result of variations in resolution and suggests that identification of some proteins may be difficult, even at the best resolution. It is possible that a large fraction of proteins is much more mobile than those observed and consequently their positions essentially indeterminate on the AFM timescale, as is the case for the lipid molecules. This behavior is seen in Annexin V and cytochrome b5 proteins in a lipid bilayer on quartz where ∼25% of the proteins move with diffusion coefficients close to that of lipids (∼1 × 10⁻⁸ cm2/s), whereas ∼75% diffuse at lower rates (<5 × 10⁻¹² cm2/s; Wagner and Tamm, 2000). In addition, we note that 1), the particle counts disregarded large stationary objects, some of which could be aggregates; 2), possibly only one terminal of the proteins is visible and half or more may be oriented in the wrong direction for visualization; and, 3), an unknown fraction of protein was seen to be unincorporated. These factors could all lead to underestimation of the protein density.
As shown in Fig. 5, 183 ± 88 particles/μm2 were observed when using a 10:1 lipid/protein ratio and 24 ± 13 particles/μm2 were observed when incubating with a 20:1 lipid/protein weight ratio. M2 was found to inhibit SPB formation. The 20:1 samples contained a mixture of liposomes and proteoliposomes (Fig. 4). Because liposomes could form SPBs more readily than proteoliposomes the lower-than-expected particle density for the 20:1 samples is thought to be the result of preferential fusion of liposomes to the mica surface.
Mobility
The diffusion coefficient reported here for M2 (4.4 ± 1 × 10⁻¹⁴ cm2/s) is ∼104-fold slower than D expected for DPPC in gel phase on the upper surface of a multibilayer (Balcom and Peterson, 1993). However, ∼75% of Annexin V and cytochrome b5 proteins diffuse at rates too slow to be detected by image analysis of epifluorescence micrographs (<5 × 10⁻¹² cm2/s) in planar POPC and POPC:POPG (9:1) bilayers when supported directly on quartz (Wagner and Tamm, 2000).
It is probable that the decrease in protein mobility observed in bilayers supported on a hydrophilic surface is caused by protruding transmembrane proteins that interact with the substrate (Kalb et al., 1992; Wagner and Tamm, 2000). It would be expected, then, that M2 would exhibit limited mobility because the heights of the extra-bilayer region of mobile M2 particles (∼1–1.5 nm) are comparable to the thickness of the hydration layer between the mica and the bilayer (∼1–2 nm). It may well be that we detect only the less protrusive side because proteins with the more protrusive side up move too fast, for lack of contact with the mica on the underside, to be detected. Aggregation of mobile particles results in increased height and greater immobilization (Fig. 10). The observed increase in height may be due to decreased applied force per particle in higher oligomers of M2 making them less deformable by the tip, and/or an actual increase in the height of higher oligomers of M2. If there is an actual increase in height of the particles upon forming higher oligomers perhaps the increased protrusion of the protein observed on the accessible surface of the SPB is matched on the distal side, causing increased friction with the mica surface to retard movement.
The role of M2 in the inhibition of SPB formation
In the course of these experiments, we noted that proteoliposomes were much slower to form SPBs, which were often incomplete, compared to liposomes. Several results not detailed here suggest that this behavior is due to coating of the mica surface by unincorporated protein. In addition, there might be an effect of integral membrane protein on vesicle malleability or lipid-mica interactions. Steric repulsion between the mica surface and the adsorbing vesicle could conceivably limit contact between the two surfaces, slowing vesicle fusion kinetics. However, this explanation is somewhat dubious because human insulin receptors, found to have extramembranous heights of ∼5 and 9 nm when reconstituted at a 105:1 lipid-to-protein mass ratio, enhanced SPB formation from vesicles on mica (Slade et al., 2002). Although this protein concentration is lower than used here, M2 has a smaller extra-membranous height at 1–1.5 nm and would be less likely to cause any steric hindrance. Therefore unincorporated M2 on the surface of the mica appears to be the main hindrance to SPB formation.
CONCLUSION
In this study we have made single-molecule observations of M2 in a near-physiologic environment incorporated in the lipid bilayer. Osmotic shrinkage of vesicles was found to dramatically enhance SPB formation. Measured heights of the extraviral domains of M2 (1–1.5 nm) agree well with expectations based on primary structure of the protein and available solid-state NMR data (Tian et al., 2003). M2 was generally observed to be mobile when incorporated in the bilayer and the tip was not found to be the major source of particle movement, which was largely random in nature. Lateral diffusion of the protein within the SPB was observed and quantified (4.4 ± 1 × 10⁻¹⁴ cm2/s). Evidence of some protein-protein interactions were observed along with aggregation. In future studies, it would be desirable to further evaluate the particle oligomericity, perhaps using molecular tags to enhance identification and sharper tips to improve resolution, and to analyze aggregation properties and kinetics. This work demonstrates that protein-protein interactions can be visualized directly.
Acknowledgments
We thank Shawn Crook who performed preliminary AFM studies of SPBs, Timothy A. Cross at Florida State University for providing the M2/DPPC proteoliposome solution, and Dixon Woodbury at Brigham Young University for experimental advice and use of vesicle sizing equipment.
This work was supported in part by National Institutes of Health grant AI23007.
References
- Ando, T., N. Kodera, E. Takai, D. Maruyama, K. Saito, and A. Toda. 2001. A high-speed atomic force microscope for studying biological macromolecules. Proc. Natl. Acad. Sci. USA. 98:12468–12472. [DOI] [PMC free article] [PubMed] [Google Scholar]
- Balcom, B. J., and N. O. Peterson. 1993. Lateral diffusion in model membranes is independent of the size of the hydrophobic region of molecules. Biophys. J. 65:630–637. [DOI] [PMC free article] [PubMed] [Google Scholar]
- Brian, A. A., and H. M. McConnell. 1984. Allogenic stimulation of cytotoxic T cells by supported planar membranes. Proc. Natl. Acad. Sci. USA. 81:6159–6163. [DOI] [PMC free article] [PubMed] [Google Scholar]
- Butt, H.-J. 1991. Measuring electrostatic, van der Waals, and hydration forces in electrolyte solutions with an atomic force microscope. Biophys. J. 60:1438–1444. [DOI] [PMC free article] [PubMed] [Google Scholar]
- Grambas, S., and A. J. Hay. 1992. Maturation of influenza A virus hemagglutinin—estimates of the pH encountered during transport and its regulation by the M2 protein. Virology. 190:11–18. [DOI] [PubMed] [Google Scholar]
- Granéli, A., J. Rydström, B. Kasemo, and F. Höök. 2003. Formation of supported lipid bilayer membranes on SiO2 from proteoliposomes containing transmembrane proteins. Langmuir. 19:842–850. [Google Scholar]
- Groves, J. T., L. K. Mahal, and C. R. Bertozzi. 2001. Control of cell adhesion and growth with micropatterned supported lipid membranes. Langmuir. 17:5129–5133. [Google Scholar]
- Harpaz, Y., M. Gerstein, and C. Chothia. 1994. Volume changes on protein folding. Structure. 2:641–649. [DOI] [PubMed] [Google Scholar]
- Israelachvili, J. 1985. Intermolecular and Surface Forces. Academic Press, London.
- Jass, J., T. Tjärnhage, and G. Puu. 2000. From liposomes to supported, planar bilayer structures on hydrophilic and hydrophobic surfaces: an atomic force microscopy study. Biophys. J. 79:3153–3163. [DOI] [PMC free article] [PubMed] [Google Scholar]
- Kalb, E., S. Frey, and L. K. Tamm. 1992. Formation of supported planar bilayers by fusion of vesicles to supported phospholipid monolayers. Biochim. Biophys. Acta. 1103:307–316. [DOI] [PubMed] [Google Scholar]
- Keller, C. A., K. Glasmäster, V. P. Zhdanov, and B. Kasemo. 2000. Formation of supported membranes from vesicles. Phys. Rev. Lett. 84:5443–5446. [DOI] [PubMed] [Google Scholar]
- Kochendoerfer, G. G., D. Salom, J. D. Lear, R. Wilk-Orescan, S. B. Kent, and W. F. DeGrado. 1999. Total chemical synthesis of the integral membrane protein influenza A virus M2: role of its C-terminal domain in tetramer assembly. Biochemistry. 38:11905–11913. [DOI] [PubMed] [Google Scholar]
- Kumar, S., and J. H. Hoh. 2000. Direct visualization of vesicle-bilayer complexes by atomic force microscopy. Langmuir. 16:9936–9940. [Google Scholar]
- Leidy, C., T. Kaasgaard, J. Crowe, O. Mouritsen, and K. Jorgensen. 2002. Ripples and the formation of anisotropic lipid domains: imaging two-component supported double bilayers by atomic force microscopy. Biophys. J. 83:2625–2633. [DOI] [PMC free article] [PubMed] [Google Scholar]
- Lin, H., R. Bhatia, and R. Lal. 2001. Amyloid β protein forms ion channels: implications for Alzheimer's disease pathophysiology. FASEB J. 15:2433–2443. [DOI] [PubMed] [Google Scholar]
- Mou, J., J. Yang, C. Huang, and Z. Shao. 1994. Tris(hydroxymethyl)aminomethane (C4H11NO3) induced a ripple phase in supported unilamellar phospholipid bilayers. Biochemistry. 33:4439–4443. [DOI] [PubMed] [Google Scholar]
- Mould, J. A., J. E. Drury, S. M. Frings, U. B. Kaupp, A. Pekosz, R. A. Lamb, and L. H. Pinto. 2000. Permeation and activation of the M2 ion channel of influenza A virus. J. Biol. Chem. 275:31038–31050. [DOI] [PubMed] [Google Scholar]
- Müller, D. J., G. Büldt, and A. Engel. 1995. Force-induced conformational change of bacteriorhodopsin. J. Mol. Biol. 249:239–243. [DOI] [PubMed] [Google Scholar]
- Müller, D., and A. Engel. 1997. The height of biomolecules measured with the atomic force microscope depends on electrostatic interactions. Biophys. J. 73:1633–1644. [DOI] [PMC free article] [PubMed] [Google Scholar]
- Müller, D. J., A. Engel, J. Carrascosa, and M. Vélez. 1997. The bacteriophage ϕ29 head-tail connector imaged at high resolution with the atomic force microscope in buffer solution. EMBO J. 16:2547–2553. [DOI] [PMC free article] [PubMed] [Google Scholar]
- Müller, D. J., D. Fotiadis, S. Scheuring, S. A. Müller, and A. Engel. 1999. Electrostatically balanced subnanometer imaging of biological specimens by atomic force microscope. Biophys. J. 76:1101–1111. [DOI] [PMC free article] [PubMed] [Google Scholar]
- Müller, D. J., H. Janovjak, T. Lehto, L. Kuerschner, and K. Anderson. 2002. Observing structure, function and assembly of single proteins by AFM. Prog. Biophys. Mol. Biol. 79:1–43. [DOI] [PubMed] [Google Scholar]
- Nollert, P., H. Kiefer, and F. Jähnig. 1995. Lipid vesicle adsorption versus formation of planar bilayers on solid surfaces. Biophys. J. 69:1447–1455. [DOI] [PMC free article] [PubMed] [Google Scholar]
- Puu, G., and I. Gustafson. 1997. Planar lipid bilayers on solid supports from liposomes – factors of importance for kinetics and stability. Biochim. Biophys. Acta. 1327:149–161. [DOI] [PubMed] [Google Scholar]
- Reimhult, E., F. Höök, and B. Kasemo. 2003. Intact vesicle adsorption and supported biomembrane formation from vesicles in solution: influence of surface chemistry, vesicle size, temperature, and osmotic pressure. Langmuir. 19:1681–1691. [Google Scholar]
- Reviakine, I., and A. Brisson. 2000. Formation of supported phospholipid bilayers from unilamellar vesicles investigated by atomic force microscopy. Langmuir. 16:1806–1815. [Google Scholar]
- Sakaguchi, T., Q. Tu, L. H. Pinto, and R. A. Lamb. 1997. The active oligomeric state of the minimalistic influenza virus M2 ion channel is a tetramer. Proc. Natl. Acad. Sci. USA. 94:5000–5005. [DOI] [PMC free article] [PubMed] [Google Scholar]
- Schabert, F., and A. Engel. 1994. Reproducible acquisition of Escherichia coli porin surface topographs by atomic force microscopy. Biophys. J. 67:2394–2403. [DOI] [PMC free article] [PubMed] [Google Scholar]
- Seitz, M., E. Ter-Ovanesyan, M. Hausch, C. K. Park, J. A. Zasadzinski, R. Zentel, and J. N. Israelachvili. 2000. Formation of tethered supported bilayers by vesicle fusion onto lipopolymer monolayers promoted by osmotic stress. Langmuir. 16:6067–6070. [DOI] [PMC free article] [PubMed] [Google Scholar]
- Sheng, S., D. M. Czajkowsky, and Z. Shao. 1999. AFM tips: how sharp are they? J. Microsc. 196:1–5. [DOI] [PubMed] [Google Scholar]
- Slade, A., J. Luh, S. Ho, and C. M. Yip. 2002. Single molecule imaging of supported planar lipid bilayer-reconstituted human insulin receptors by in situ scanning probe microscopy. J. Struct. Biol. 137:283–291. [DOI] [PubMed] [Google Scholar]
- Tian, C., P. F. Gao, L. H. Pinto, R. A. Lamb, and T. A. Cross. 2003. Initial structural and dynamic characterization of the M2 protein transmembrane and amphipathic helices in lipid bilayers. Protein Sci. 12:2597–2605. [DOI] [PMC free article] [PubMed] [Google Scholar]
- Tian, C., K. Tobler, R. A. Lamb, L. H. Pinto, and T. A. Cross. 2002. Expression and initial structural insights from solid-state NMR of the M2 proton channel from influenza A virus. Biochemistry. 41:11294–11300. [DOI] [PubMed] [Google Scholar]
- van Noort, S. T. J., K. O. van der Werf, B. G. de Grooth, and J. Greve. 1999. High speed atomic force microscopy of biomolecules by image tracking. Biophys. J. 77:2295–2303. [DOI] [PMC free article] [PubMed] [Google Scholar]
- Wagner, M., and L. Tamm. 2000. Tethered polymer-supported planar lipid bilayers for reconstitution of integral membrane proteins: silane-polyethyleneglycol-lipid as a cushion and covalent linker. Biophys. J. 79:1400–1414. [DOI] [PMC free article] [PubMed] [Google Scholar]
- Wang, J., S. Kim, F. Kovacs, and T. A. Cross. 2001. Structure of the transmembrane region of the M2 protein H+ channel. Protein Sci. 10:2241–2250. [DOI] [PMC free article] [PubMed] [Google Scholar]
- Yang, J., J. Mou, J.-Y. Yuan, and Z. Shao. 1996. The effect of deformation on the lateral resolution of atomic force microscopy. J. Microsc. 182:106–113. [DOI] [PubMed] [Google Scholar]


