Abstract
OmpF from the outer membrane of Escherichia coli is a general porin considered to be the main pathway for β-lactam antibiotics. The availability of a high-resolution crystal structure of OmpF and new experimental techniques at the single-molecule level have opened the way to the investigation of the microscopic mechanisms that allow the passage of antibiotics through bacterial pores. We applied molecular dynamics simulations to investigate the translocation process of ampicillin (Amp) through OmpF. Using a recent algorithm capable of accelerating molecular dynamics simulations we have been able to obtain a reaction path for the translocation of Amp through OmpF. The mechanism of passage depends both on the internal degrees of freedom of Amp and on interactions of Amp with OmpF. Understanding this mechanism would help us design more efficient antibiotics and shed light on nature's way of devising channels able to enhance the transport of molecules through membranes.
INTRODUCTION
A necessary step in an antibacterial treatment with antibiotics is their translocation across the outer membrane. In Escherichia coli the OmpF channel is a general diffusion porin which provides a translocation pathway for small molecules, water, and ions inward and outward through the outer membrane. Although probably not optimized for the passage of harmful antibiotics, OmpF is believed to be also the main pathway for β-lactam antibiotics, since resistant strains of E. coli have shown expression deficiency of OmpF (Nikaido, 1989).
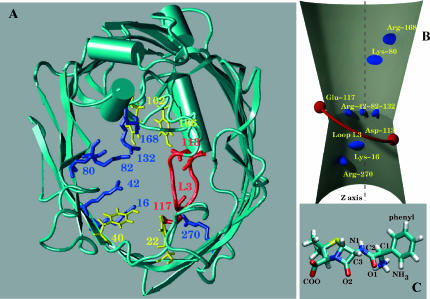
Recently, an individual OmpF protein was reconstituted into a planar lipid membrane and used to investigate the passage of a β-lactam antibiotic, ampicillin (Nestorovich et al., 2002). The interaction between the ampicillin and the channel was probed measuring the flow of ions induced by a voltage difference. The current detected shows some interruption for periods of 100–500 μs, due to the blockage of the channel for the presence of Amp. Kinetic analysis of the binding reaction at different pH and ionic strengths of the aqueous buffer solution suggests that the interactions are principally of an electrostatic nature and that the transported species is the zwitterionic form of Amp (see Fig. 1 C).
FIGURE 1.
(A) View of the constriction zone along the z direction. The important residues are in stick, the Asp and Glu in red, the Arg and Lys in blue, the Tyr in yellow. The loop L3 is in red. (B) Schematic view of OmpF along y with the charged residues. (C) Ampicillin molecule in an all-atom representation with atom labels.
The high-resolution structure of OmpF (Cowan et al., 1992) revealed a narrow region in the channel constituted by charged amino acids, three Arg (42, 82, 132) facing one Asp (113) and a Glu (117) (Fig. 1, A and B). Both its smallness and the presence of charged residues seem to indicate that this region is critical for the transport of Amp through OmpF. The channel is divided by the plane of the three Args into two roughly symmetric regions. In the two halves there are charged residues placed almost symmetrically: Glu117, Lys80, and Arg168 in the upper region, and Asp113, Lys16, and Arg270 in the lower region. Two hydrophobic pockets are also present near Glu117 and Asp113, constituted by Tyr22, 40 and Tyr102, 106, respectively. This seems to indicate that transport in this channel could occur in both directions with a similar mechanism.
However, when looking at the x-ray structure we can only speculate about the translocation of molecules and how Amp blocks the channel for permeating ions. Once the structure is known, computer simulations have the potential to investigate physical processes with a very high resolution in time and space, as, for example, the permeation of water through aquaporins (de Groot and Grubmüller, 2001; Tajkhorshid et al., 2002). Molecular dynamics (MD) simulations of OmpF have been used to investigate the rigidity of the porin backbone structure (Watanabe et al., 1997), the transport of ions for the wild-type and a few mutants (Phale et al., 2001; Im and Roux, 2002; Suenaga et al., 1998), and the transport of small molecules (Robertson and Tieleman, 2002), but no diffusion of antibiotics has yet been investigated. Here we present a MD simulation of the translocation of the zwitterionic form of Amp through OmpF, as in the experiment of Nestorovich et al. (2002). Particular attention has been devoted to the blockage of the channel when Amp is near the constriction zone, the narrowest region of OmpF.
Biological processes involve a large number of atoms and several timescales. Standard MD algorithms are not able to investigate rare events, their timescale being limited to ∼100 ns. However, a new algorithm developed in our group is able to go beyond standard methods (Laio and Parrinello, 2002) and appears to be superior to other methods proposed in the past to accelerate MD simulations (Grubmüller, 1995; Isralewitz et al., 2001) and applied to biological systems (Jensen et al., 2002). It consists of a history-dependent MD where one or more collective variables are chosen to guide the process at a coarse-grained level (metadynamics). With a defined frequency a repulsive potential is added to the Hamiltonian, preventing the system from revisiting conformations described by the instantaneous values of the collective variables. In this article we apply this new method to investigate the translocation of Amp through OmpF, obtaining a description of the whole process and evaluating the free-energy barriers to cross and escape the constriction zone.
MATERIALS AND METHODS
Classical MD
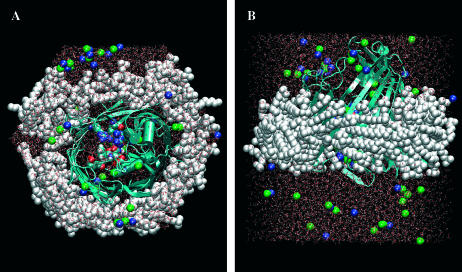
The model consists of one monomer of OmpF (pdb-id: 2OMF, resolution 2.4 Å) embedded in a hydrophobic environment of detergent molecules (lauryl dimethyl amine oxide, LDAO) and solvated with 7,000 water molecules. We chose to simulate just one monomer, to permit fast simulations: the three monomers have exactly the same structure (primary and tertiary) and, as shown by experiments and simulations, they also behave independently with respect to the permeation of ions and antibiotics (Im and Roux, 2002; Nestorovich et al., 2002). From the point of view of the antibiotic transport, monomer and trimer might differ only in their behavior at the channel entrance, where ampicillin can get in contact with the external loops of OmpF. However, here we focus solely on the constriction zone of OmpF. Given the irregularity of the external surface of the OmpF monomer, we preferred to use detergent molecules rather than a phospholipid bilayer. LDAO is a common detergent used to crystallize membrane proteins such as the photosynthetic reaction center of bacteria (Roth et al., 1989). As shown in a recent modeling of another membrane protein (Ceccarelli and Marchi, 2003) detergent molecules rearrange to form a fused micelle around the protein and in our case they adapt to the irregular surface of the monomer better than phospholipids. Residues were protonated as in Im and Roux (2002) and we added 29 CL− and 39 K+ to neutralize the protein charges. We described the system at an all-atom level, see Fig. 2, using the Amber potential and TIP3P for water (Cornell et al., 1995). For Amp and LDAO we used the Amber potential for the bonded and Lennard-Jones terms and restrained electrostatic potential charges for the electrostatic as described in Ceccarelli et al. (2003). Hexagonal periodic boundary conditions were applied on the x-y plane. The initial simulation box edges are 70 × 70 × 80 Å for a total system of ∼33,000 atoms. Electrostatic interactions were evaluated using the soft particle mesh Ewald schemes (Essmann et al., 1995) with 80 × 80 × 96 grid points, k = 0.40 Å−1, and a cutoff of 10 Å, as for the Lennard-Jones energy terms. We used a MTS-Respa integrator (Tuckerman et al., 1992) with five shells, with a time step, respectively, of 12-4-2-1-0.5 fs in conjunction with the SHAKE algorithm (Ryckaert et al., 1977) to keep bond lengths involving hydrogens fixed. The simulations were done at 0.1 MPa and 300 K with Nosé thermostat. During the equilibration (2 ns) the detergent fused around the external surfaces of OmpF and the total volume of the box reached a constant value. Then we decided to perform all simulations with a fixed hexagonal box (68.4 × 68.4 × 78.1 Å). All simulations were performed on a single AMD 2.0 Ghz (Sunnyvale, CA) using the program ORAC (Procacci et al., 1997; Marchi and Procacci, 1999).
FIGURE 2.
Snapshots of the simulated system on the z (A) and y (B) planes.
History-dependent MD
To overcome the timescale problem, we exploit a novel method for exploring the properties of multidimensional free-energy surfaces (FES) of complex many-body systems (Laio and Parrinello, 2002; Iannuzzi et al., 2003; Micheletti et al., 2003). The gist of the method is to identify the variables that are of interest but difficult to sample, since the stable minima in the space spanned by these variables are separated by barriers that cannot be cleared in the simulation time available. These variables are functions of the atomic coordinates of the system, and will be denoted sα(r). A history-dependent dynamics is constructed in the space of these variables, designed to compensate, as the simulation proceeds, the underlying free energy F(s). Like in Iannuzzi et al. (2003), we introduce an extended Hamiltonian coupling the collective variables sα(r) with a set of extra dynamic variables sα:
 |
(1) |
If the masses Mα and the coupling constants kα are properly chosen, the (sα − sα(r)) are adiabatically separated from the atomic subsystem, and their motion can be described by a Langevin dynamics driven by the forces  (Iannuzzi et al., 2003). Hence, imposing an artificial adiabatic separation permits an indirect estimate of the derivative of the free energy. This allows an iterative reconstruction of F(s) by biasing the dynamics of the collective variables with a history-dependent term (Laio and Parrinello, 2002; Iannuzzi et al., 2003; Micheletti et al., 2003):
 |
(2) |
where the time interval Δt between the placement of two successive Gaussians, the Gaussian width δs, and the Gaussian height w are free parameters that affect the efficiency and the accuracy of the algorithm. The component of the forces coming from the Gaussian will discourage the system from revisiting the same spot, accumulating in the free-energy wells, and allowing the system to migrate from well to well. In ideal conditions, after a long time the sum of the Gaussian terms will compensate the underlying F(s) and the system will be free to diffuse on a flattened landscape. Assuming that the masses are large enough to ensure adiabatic separation, the first relevant quantity is the (average) kinetic energy Ts of the collective variables  If this is larger than the barriers in F(s), the system will overcome the barriers for purely kinetic reasons, which is highly undesirable. Hence, we thermostat the (sα − sα(r)) to a temperature of 300 K, so that the relevant barriers (of a few kcal/mol) can be crossed only for the effect of the time-dependent potential.
RESULTS AND DISCUSSION
Standard MD
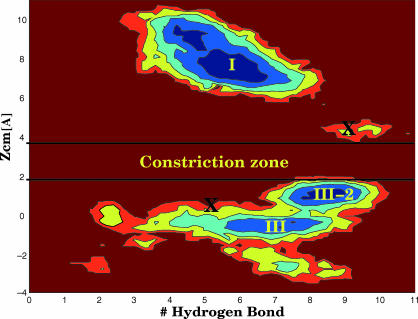
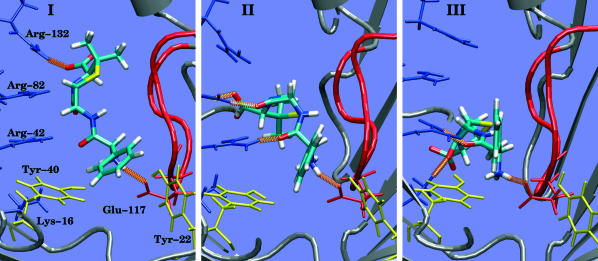
After the system was relaxed as described above we placed Amp by hand near the constriction zone, where a global minimum was found previously (Nestorovich et al., 2002). Since we do not use either the same force field or the simulation scheme of Nestorovich et al. (2002), we did not use the same coordinates of Amp. However, our starting configuration shares the main features of that minimum, and the contacts between Amp and the charged amino acids of the constriction zone are the same (NH3 interacting with Glu117 and COO with Arg132, the phenyl pointing toward the upper region). We performed two standard MD simulations that lasted 4.5 ns each. The initial coordinate of the center of mass of Amp with respect to the z axis was in one simulation 4 Å above the plane of the three arginines (Arg82 is at 2 Å along the z axis of OmpF defined in Fig. 1 B) and in the other 0.5 Å below. We used two coordinates to analyze the simulations: the number of hydrogen bonds between Amp and OmpF, and z. Whereas the latter allows us to follow Amp along the direction of diffusion, the former takes into account the interactions between Amp and OmpF. The two simulations sample two disconnected regions in the space of these two coordinates (see Fig. 3), in the extracellular side (z > 4 Å) and in the intracellular side (z < 2 Å), respectively. Despite the symmetry of the channel, the interactions of Amp in the two halves are not symmetric: Amp has a preferential direction, that of the permanent dipole (from NH3 to COO), and the phenyl group perpendicular to this direction. In the extracellular region Amp assumes a conformation (labeled I) in which the dipole is perpendicular to the z axis of the channel: NH3 is interacting with Glu117, COO with Arg82–132 and the phenyl group is near Tyr22, 40, or Tyr22, 32 and Phe118. In the intracellular region Amp assumes a conformation (III-2) which is similar to I, but now staying just below the plane of the three Arginines, NH3 interacts with Asp113 and COO with Arg42, 82. This conformation would be symmetrical with respect to I except for the position of the phenyl group, which is pointing up instead of down. The other conformation, III, differs in the dipole orientation, which is now parallel to the z axis: NH3 interacts with Glu117 and COO with Lys16. Moreover the central part of Amp is between the arginines and the loop L3, with O1 interacting with Arg82 and N1-H with a backbone carbonyl. All these conformers are able to block the channel to the passage of ions.
FIGURE 3.
Contour plot of the free energy surface (each color is 0.5 kcal/mol) obtained with two standard MD simulations of 4.5 ns each. Crosses label the initial configurations.
Metadynamics
The standard MD simulations sample a limited region around the initial conformations and are not able to enter into the constriction zone. This limitation can be overcome by the metadynamics, using as collective variables the number of hydrogen bonds and the position along z. Starting from the most likely conformations of Amp near the constriction zone we performed several metadynamics simulations with the following parameters: w = 1.0 kJ/mol, Δt = 1 ps, δs = 0.6. Amp prefers to exit from the channel (from the low z side if the simulation starts from III, from the high z side if the simulation starts from I) rather than diffuse through the constriction zone. The barriers to escape are of the order of 5 kcal/mol. This indicates that the rate-limiting step of the process involves translocation through the constriction zone, from I to III.
Mechanism to overcome the pore
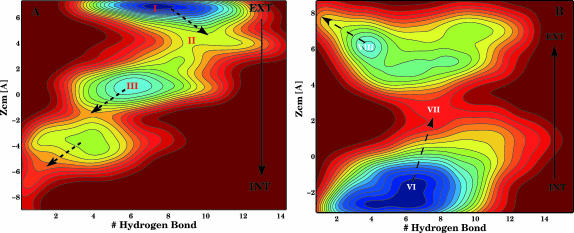
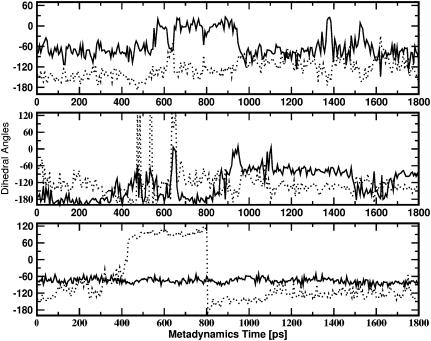
We started a metadynamics simulation with the above parameters with a conformer from the basin I and putting a wall at z =7 Å to oblige Amp to enter the constriction zone. The free-energy surface explored during this simulation is reported in Fig. 4 A, and in Fig. 5 we show one representative conformer each for the regions I, II, and III. The simulations performed (between 2 and 3 ns each) do not allow a quantitative analysis of the free-energy differences between regions I and III because no recrossing was obtained. However, we can calculate the height of the free-energy barrier needed for escaping a minimum and we can obtain an understanding of the translocation mechanism. Amp passes from I to III (Ext-to-Int, or extracellular-to-intercellular), changing the dipole orientation, through a new conformer, II, that can be considered the intermediate. This conformer stays in the constriction zone (2 Å < z < 4 Å) maintaining the interaction of NH3 with Glu117, while COO moves below the Arg cluster and closer to Lys16. The oxygen O1 and O2 are now interacting with the Args cluster. Looking at the internal coordinates of Amp we observed that in II the internal dihedral angle C2-N1-C3-O2 (ω1) (see Fig. 1 C) has a value of 20° (see Fig. 7 A). This value was not observed in either standard simulations or with metadynamics simulations in the extra- and intracellular regions. In I and III ω1 fluctuates around −80° (see Fig. 7 A). The flexibility of ω1 helps Amp to move through the constriction zone and to reorient the dipole (see Fig. 5, from I to III). The barrier to overcoming the constriction zone (from I to II) is of the order of 10 kcal/mol, larger than the barrier evaluated to exiting the channel from states I or III, 5 kcal/mol. We also performed another metadynamics starting from III and III-2 and imposing a wall at z = −2 Å to evaluate the barrier of recrossing. We did not obtain any recrossing even for a biasing potential >20 kcal/mol. Hence, once Amp passes the constriction zone, it prefers to diffuse in the intracellular region instead of recrossing the barrier. The orientation of Amp in state III or III-2, with the phenyl group pointing up, seems to increase enormously the energy needed to overcome the constriction zone.
FIGURE 4.
Contour plot of the free energy surfaces, each color is 1 kcal/mol of difference. The calculation does not give the relative probability of the minima because we did not observe a recrossing. Only the free energy barriers along the arrows are meaningful. (A) Process Ext-to-Int and (B) Int-to-Ext.
FIGURE 5.
All-atom representation viewed along z of the most characteristic conformations sampled during the process Ext-to-Int (see Fig. 4 for the position on the free energy surface). Contacts: I, COO-Arg132, NH3- Glu117; II, COO-Arg82, O2-Arg82, O1-Arg42, NH3- Glu117; and III, O2-Lys16, O1-Arg42, NH3- Glu117.
FIGURE 7.
Values of the ω1 (solid line) and ω2 (dotted line) torsional angles of Amp during the metadynamics simulations. (A) Process Ext-to-Int; (B) process Int-to-Ext; and (C) process Ext-to-Int with ω1 restrained at −80°.
The recrossing and the inverted reaction: directionality of translocation
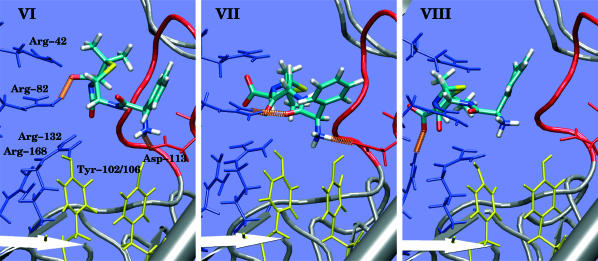
To probe the translocation Int-to-Ext we performed another metadynamics simulation starting with Amp in the intracellular region as in III-2 but now with the phenyl pointing down (Fig. 6, state VI), and with a wall at z = −3 Å. This conformation is symmetrically related to I: now NH3 interacts with Asp113 instead of Glu117 and COO interacts with Arg42, 82 instead of Arg82, 132. Moreover the phenyl group is now close to Tyr102, 106 instead of Tyr22, 40. The calculated free-energy surface is reported in Fig. 4 B and shows a barrier of 14 kcal/mol instead of 10 kcal/mol. This difference is due to the positions of Tyr102, 106, which oblige Amp to sit in a different position than in I (see also in Fig. 7 B the different values of ω1 sampled). The steps to overcome the constriction zone are like in the process Ext-to-Int: the fluctuations of ω1 allow Amp to move up with COO closer to Arg168 (instead of Lys80, which is oriented toward the mouth of the channel), O2 and O1 interact with Arg82 (see Fig. 6, from VI to VII). When ω1 changes to a value of −180° NH3 breaks the interaction with Asp113 and the dipole of Amp reorients parallel to the z axis (see Fig. 6, VIII). Now COO interacts with Arg168 and O1 with Arg82; Amp is in the upper region. An alternative path for the Int-to-Ext translocation is found when starting the metadynamics from VI. NH3 moves along the loop L3, interacting with the carbonyl groups, from Asp113 to Glu117. Here the phenyl finds another hydrophobic pocket with two methyl groups, Val18, 337 and Tyr310. COO changes from Arg42, 82 to Arg82, 132 and O1 interacts with Arg42. The fluctuations of ω1 together with the other dihedral angle around the bond C1-C2 (ω2) play a key role in the passage of the antibiotic through the constriction zone: COO breaks the interaction with Arg82, 132 to find Lys80 and Arg168 above the Arg cluster. NH3 is still interacting with Glu117 even if z is lower. Then COO breaks the interaction with Lys80 to find Arg168, NH3 breaks with Glu117, and Amp leaves the constriction zone. Also for this path the barrier to overcoming the constriction zone is similar to the previous one, 15 kcal/mol.
FIGURE 6.
All-atom representation viewed along z of the most characteristic conformations sampled during the process Int-to-Ext (see Fig. 4 for the position on the free energy surface). Contacts (in orange): VI, COO-Arg82, NH3-Asp113; VII, O2-Arg82, O1-Arg82, NH3-Asp113; and VIII, COO- Arg168.
The role of flexibility of Amp
Our simulations suggest that the flexibility of Amp plays a key role in the passage of the antibiotic through the constriction zone. The dihedral angle ω1 changes from −80° to 20° and then again to −80°, passing from region I to region III in the process Ext-to-Int (see Fig. 7 A). To evaluate quantitatively the effect of flexibility we performed another metadynamics simulation with a restraint on the value of ω1 at −80°. We started the simulation with Amp in basin I as above, with its orientation perpendicular to the z axis. The translocation mechanism is very significantly modified by this restraint. The key event for the passage is, in this case, a dihedral transition for the angle ω2 (see Fig. 7 C) that allows Amp to reorient parallel to the z axis. The translocation through the pore in this more extended conformation proceeds with a smaller number of contacts between Amp and the pore walls, implying a free-energy barrier several kcal/mol higher.
CONCLUSIONS
Mechanism
Once Amp is in contact with the constriction zone, where charged amino acids interact with the charged group of Amp, the flexibility of Amp plays an important role in the translocation process. Amp reorients from perpendicular to parallel to the axis of the channel, changing an internal dihedral angle whose flexibility helps the breaking of hydrogen bonds.
Directionality
The translocation process of Amp presents a high directionality: when Amp has COO pointing toward the constriction zone, it can overcome this region with a barrier of the order of 10–15 kcal/mol. For the recrossing this barrier is larger, >20 kcal/mol. This allows Amp to diffuse in the solvent and the recrossing is strongly disfavored.
Symmetry of the channel
The charged residues of the channel are in a quasisymmetric position with respect to the plane of the three arginines. Hydrophobic pockets exist near Glu117 (Tyr22, 40) and Asp113 (Tyr102, 106) but the position of their phenyl groups breaks the symmetry: the mechanism is maintained for the translocation Ext-to-Int and Int-to-Ext but with a different barrier.
Stericity
The bottleneck of the process is the passage of the constriction zone. The stericity plays an important role in the translocation, consistently with the experimental findings that bacteria that are able to change the dimension of the constriction zone by mutating become resistant to antibiotics (Simonet et al., 2000; Jeanteur et al., 1994). In a forthcoming study we will present theoretical and experimental results on a mutated OmpF that support this speculation. Our simulations showed that translocation is highly influenced by the properties of Amp: its flexibility, the presence of a preferential direction, and the phenyl group on one side. This could suggest new strategies for designing drugs with an improved penetration efficiency.
Christophe Danelon's present address is Institute of Biomolecular Sciences, EPF Lausanne, CH-1015 Lausanne, Switzerland.
Matteo Ceccarelli's present address is Dept. of Physics and Sardinian Laboratory for Computational Materials Science, University of Cagliari, Italy.
References
- Ceccarelli, M., and M. Marchi. 2003. Simulation and modeling of the rhodobacter sphaeroides bacterial reaction center: structure and interactions. J. Phys. Chem. B. 107:1423–1431. [Google Scholar]
- Ceccarelli, M., P. Procacci, and M. Marchi. 2003. An ab initio force field for the cofactors of bacterial photosynthesis. J. Comput. Chem. 24:129–142. [DOI] [PubMed] [Google Scholar]
- Cornell, W. D., P. Cieplak, C. I. Bavly, I. R. Gould, K. M. Merz, Jr., D. M. Ferguson, D. C. Spellmeyer, T. Fox, J. W. Caldwell, and P. Kollmann. 1995. A second generation force field for the simulation of proteins, nucleic acids, and organic molecules. J. Am. Chem. Soc. 117:5179–5197. [Google Scholar]
- Cowan, S. W., T. Schirmer, G. Rummel, M. Steiert, R. Ghosh, R. A. Pauptit, J. N. Jansonius, and J. P. Rosenbusch. 1992. Crystal structures explain functional properties of two E. coli porins. Nature. 358:727–733. [DOI] [PubMed] [Google Scholar]
- de Groot, B. L., and H. Grubmüller. 2001. Water permeation across biological membranes: mechanism and dynamics of aquaporin-1 and glpf. Science. 294:2353–2357. [DOI] [PubMed] [Google Scholar]
- Essmann, U., L. Perera, M. L. Berkowitz, T. Darden, H. Lee, and L. G. Pedersen. 1995. A smooth particle mesh Ewald method. J. Chem. Phys. 103:8577–8593. [Google Scholar]
- Grubmüller, H. 1995. Predicting slow structural transitions in macromolecular systems: conformational flooding. Phys. Rev. E. 52:2893–2906. [DOI] [PubMed] [Google Scholar]
- Iannuzzi, M., A. Laio, and M. Parrinello. 2003. Efficient exploration of reactive potential energy surfaces using Car-Parrinello molecular dynamics. Phys. Rev. Lett. 90:238302. [DOI] [PubMed] [Google Scholar]
- Im, W., and B. Roux. 2002. Ions and counterions in a biological channel: a molecular dynamics simulation of OmpF porin from Escherichia coli in an explicit membrane with 1 M KCl aqueous salt solution. J. Mol. Biol. 319:1177–1197. [DOI] [PubMed] [Google Scholar]
- Isralewitz, B., M. Gao, and K. Schulten. 2001. Steered molecular dynamics and mechanical functions of proteins. Curr. Opin. Struct. Biol. 11:224–230. [DOI] [PubMed] [Google Scholar]
- Jeanteur, D., T. Schirmer, D. Fourel, V. Simonet, G. Rummel, C. Widmer, J. P. Rosenbusch, F. Pattus, and J. M. Pages. 1994. Structural and functional alterations of a colicin-resistant mutant of OmpF porin from Escherichia coli. Proc. Natl. Acad. Sci. USA. 91:10675–10679. [DOI] [PMC free article] [PubMed] [Google Scholar]
- Jensen, M. O., E. Tajkhorshid, S. Park, and K. Schulten. 2002. Energetics of glycerol conduction through aquaglyceroporin glpf. Proc. Natl. Acad. Sci. USA. 99:6731–6736. [DOI] [PMC free article] [PubMed] [Google Scholar]
- Laio, A., and M. Parrinello. 2002. Escaping free-energy minima. Proc. Natl. Acad. Sci. USA. 20:12562–12566. [DOI] [PMC free article] [PubMed] [Google Scholar]
- Marchi, M., and P. Procacci. 1999. Coordinates scaling and multiple time step algorithms for simulation of solvated proteins in the NPT ensemble. J. Chem. Phys. 109:5194–5202. [Google Scholar]
- Micheletti, C., A. Laio, and M. Parrinello. 2003. Reconstructing the density of states by history-dependent metadynamics. Phys. Rev. Lett. 92:170601. [DOI] [PubMed] [Google Scholar]
- Nestorovich, E. M., C. Danelon, M. Winterhalter, and S. M. Bezrukov. 2002. Designed to penetrate: time-resolved interaction of single antibiotic molecules with bacterial pores. Proc. Natl. Acad. Sci. USA. 99:9789–9794. [DOI] [PMC free article] [PubMed] [Google Scholar]
- Nikaido, H. 1989. Outer membrane barrier as a mechanism of antimicrobial resistance. Antimicrob. Agents Chemoter. 33:1831–1836. [DOI] [PMC free article] [PubMed] [Google Scholar]
- Phale, P. S., A. Philippsen, C. Widmer, V. P. Phale, J. P. Rosenbusch, and T. Schirmer. 2001. Role of charged residues at the OmpF porin channel constriction probed by mutagenesis and simulation. Biochemistry. 40:6319–6325. [DOI] [PubMed] [Google Scholar]
- Procacci, P., E. Paci, T. Darden, and M. Marchi. 1997. Orac: a molecular dynamics program to simulate complex molecular systems with realistic electrostatic interactions. J. Comput. Chem. 18:1848–1862. [Google Scholar]
- Robertson, K. M., and D. P. Tieleman. 2002. Orientation and interactions of dipolar molecules during transport through OmpF porin. FEBS Lett. 528:53–57. [DOI] [PubMed] [Google Scholar]
- Roth, M., A. Lewit-Bentley, H. Michel, J. Deisenhofer, R. Huber, and D. Oesterhelt. 1989. Detergent structure in crystals of a bacterial photosynthetic reaction centre. Science. 340:659–662. [Google Scholar]
- Ryckaert, J. P., G. Ciccotti, and H. J. C. Berendsen. 1977. Numerical integration of the cartesian equations of motion of a system with constraints: molecular dynamics of n-alkanes. J. Comput. Phys. 23:327–341. [Google Scholar]
- Simonet, V., M. Mallea, and J. M. Pages. 2000. Substitutions in the eyelet region disrupt cefepime diffusion through the Escherichia coli OmpF channel. Antimicrob. Agents Chemother. 44:311–315. [DOI] [PMC free article] [PubMed] [Google Scholar]
- Suenaga, A., Y. Komeiji, M. Uebayasi, T. Meguro, M. Saito, and I. Yamato. 1998. Computational observation of an ion permeation through a channel protein. Biosci. Rep. 18:39–47. [DOI] [PubMed] [Google Scholar]
- Tajkhorshid, E., P. Nollert, M. O. Jensen, L. J. W. Miercke, J. O'Connell, R. M. Stroud, and K. Schulten. 2002. Control of the selectivity of the aquaporin water channel family by global orientational tuning. Science. 296:525–530. [DOI] [PubMed] [Google Scholar]
- Tuckerman, M. E., B. Berne, and G. Martyna. 1992. Reversible multiple time scale molecular dynamics. J. Chem. Phys. 97:1990–2001. [Google Scholar]
- Watanabe, M., J. Rosenbusch, T. Schirmer, and M. Karplus. 1997. Computer simulations of the OmpF porin from the outer membrane of Escherichia coli. Biophys. J. 72:2094–2102. [DOI] [PMC free article] [PubMed] [Google Scholar]


