Abstract
The fragment Aβ(25–35) of the Alzheimer's amyloid β -peptide, like its full-length peptide Aβ(1–42), has shown neurotoxic activities in cultured cells. The conformational preference of this important peptide is examined here in solution, gel, and film states (obtained with organic and aqueous solvents) by vibrational circular dichroism spectroscopy for the first time. For comparative studies, vibrational absorption and electronic circular dichroism measurements were also carried out under identical conditions. The peptide was found to adopt β-sheet and β-turn structures, with their relative proportions changing in different environments.
INTRODUCTION
Amyloid β (Aβ) peptide is a proven major contributing component of neuritic plaques of Alzheimer's disease (AD) (Sambamurthi et al., 2002; Behl, 1997). The formation of fibrillar deposits of Aβ peptide in brain is a key step in the pathogenesis of this disease, since the conversion of Aβ from soluble monomer to insoluble fibril is considered to cause the neuronal degeneration and clinical dementia in AD patients. Recent biophysical studies such as electron microscopy, solid-state NMR, Fourier transform infrared (FTIR), and electronic circular dichroism (ECD) spectra indicated that the Aβ fibrils exhibit a high β-sheet content (Serpell, 2000; May et al., 1992; Mager, 1998). The conversion of normal Aβ peptides with water-soluble α-helical/random coil structures into the insoluble Aβ aggregates with an extensive β-sheet content is considered to be the predominant event in the onset of AD. The normal Aβ peptides with α-helical conformations are reported as being nontoxic or less toxic, but the neurotoxicity is observed to increase with the formation of β-sheet structure (Behl, 1997; May et al., 1992; Simmons et al., 1994). It has been reported that Aβ fibrillogenesis is kinetically dependent on the nucleation-dependent polymerization (Lomakin et al., 1997). However, the exact mechanism of Aβ aggregation is not yet clear. The full-length Aβ peptide, which is responsible for AD, contains 42 amino acid residues. The interesting property of Aβ peptide is that its various fragments (with residues 1–28 (Burdick et al., 1992), 25–35 (Pike et al., 1995), and 34–42 (Halverson et al., 1990)) also show similar biophysical and biochemical properties as those of full-length Aβ(1–42) peptide.
Spectroscopic measurements provide powerful pathways to analyze the secondary structure of peptides, polypeptides, and proteins in different microenvironments. FTIR and ECD spectroscopies were widely used (Pelton and McLean, 2000; Lin et al., 2003) for secondary structural analyses. Most optical spectroscopic secondary structure studies of peptides involve the use of ECD measured for the n-π* and π-π* transitions of the amide linkage (Yang et al., 1986; Johnson, 1985; Manning, 1989). On the other hand, the FTIR method is based on the assignment of vibrational band positions to different secondary structures. The carbonyl stretching bands from the amide group, referred to as Amide I bands, appearing in the 1700–1600 cm−1 region were frequently used for the assignment of different secondary structures of biomolecules, since this Amide I band position was noted to depend on the type of structure (Haris and Chapman, 1995; Cooper and Knutson, 1995).
A new vibrational spectroscopy technique, vibrational circular dichroism (VCD) spectroscopy, has emerged recently, which differentiates among different secondary structures of proteins and peptides in aqueous and nonaqueous solvent conditions (Keiderling, 2002; Baumruk and Keiderling, 1993; Pancoska et al., 1989; Polavarapu and Zhao, 2000; Zhao et al., 2000; Zhao and Polavarapu, 2001; Yoder et al., 1995). VCD measures the difference in absorbance for left and right circularly polarized infrared radiation. Keiderling and coworkers carried out a series of VCD studies to analyze the conformational preference of polypeptides in solution and thin film state (Keiderling, 1986; Hilario et al., 2003; Yasui and Keiderling, 1986; Keiderling et al., 1999; Keiderling and Xu, 2002; Narayanan et al., 1986, 1985). Other research groups have also reported the VCD of several peptides and polypeptides under different conditions (Wang and Polavarapu, 2003; Eker et al., 2002; Borics et al., 2003; Urbanova et al., 2001).
This study addresses the question of the structure of Aβ(25–35) peptide, one of the active fragments of Aβ(1–42) peptide, at higher concentration in membraneous (methanol), aggregated (acidic solution), and nonaggregated (dimethylsulfoxide, DMSO) conditions using VCD spectroscopy for the first time. The amino acid sequence of Aβ(25–35) peptide is NH2-Gly-Ser-Asn-Lys-Gly-Ala-Ile-Ile-Gly-Leu-Met-COOH, where the first Gly represents the amino acid 25 and the last Met represents the amino acid 35. The Aβ(25–35) peptide is also investigated in gel state for the first time. Comparative studies are also carried out using vibrational absorption and ECD. The conformational preference of Aβ(25–35) peptide film is also investigated using vibrational absorption and VCD spectroscopy.
EXPERIMENTAL
All fluorenyl-9-methoxycarbonyl (Fmoc)-amino acids, pentafluorophenol, and Wang resin were purchased from Nova Biochem (San Diego, CA). Aβ(25–35) peptide was synthesized by manual solid-phase methodology on Wang resin using standard procedures (Chan and White, 2000). The required Fmoc N-protected amino acids were converted into their active esters using pentafluorophenol, except for serine amino acid (followed by anhydride method). 1-hydroxybenzotriazole hydrate was used during the coupling of active ester of Fmoc-amino acids. Fmoc deprotection was achieved with 20% (v/v) piperidine in N, N-dimethylformamide. Peptidyl-resin was cleaved with a mixture of trifluoroacetic acid, ethanedithiol, thioanisole, and anisole in the ratio 90:3:5:2, respectively. After cleavage, the resin was removed by filtration and the crude peptide was isolated by precipitation from the cleavage solution by the addition of cold ether. The identity and purity of the peptide was assessed by matrix-assisted laser desorption ionization time-of-flight mass spectrometry (theoretical MW = 1060.8; experimental MW = 1060) and reverse-phase high-performance liquid chromatography (HPLC), respectively. High pure methanol (HPLC grade) was used for spectroscopic measurements.
Vibrational circular dichroism
All VCD spectra were recorded on a commercial Chiralir spectrometer (Bomem-BioTools, Quebec, Canada) modified to minimize the artifacts using double polarization modulation method (Nafie, 2000). These modifications are as follows: the light from interferometer, brought to an external bench using a BaF2 lens, is passed through a linear polarizer, photoelastic modulator (PEM), sample, a second PEM, ZnSe focusing lens, and to the detector. The detector signal is processed by two electronic paths. In one, the low-frequency signal is isolated with a low-pass filter and Fourier-transformed. In the second path, the high frequency component is isolated with a high pass filter and analyzed with two lock-in amplifiers. One lock-in amplifier is tuned to the frequency (37.07 kHz) of the first PEM and the second lock-in amplifier is tuned to the frequency (36.95 kHz) of the second PEM. The outputs of these lock-in amplifiers are fed to a low-pass filter, subtracted, and Fourier-transformed. All spectra were collected at a resolution of 8 cm−1 with 1 h data acquisition time except for film, where 20-min acquisition was used.
For solution VCD measurements, stock solutions (10 mg/mL) of Aβ(25–35) were prepared using methanol-d or DMSO-d6 solvent. For time-dependent VCD measurements methanol solvent was used. The baseline for peptide VCD spectra was obtained from the corresponding VCD spectrum of solvent obtained under the same conditions. For infrared (IR) absorption spectra, the solvent spectra were subtracted from the solution spectra.
For the gel VCD measurements, ∼25–30 μL of gel obtained from aged solution (10 mg/mL) in methanol-d or acetate buffer was placed between two CaF2 plates (2.5 cm diameter) to give an absorbance between 0.3 and 0.6 for the dominant amide I band. The acetate buffer (pD 3) used here was prepared using D2O solution. For IR absorption spectra, the solvent spectra were subtracted from gel spectra until the characteristic solvent absorption band was removed. The VCD baseline was obtained from the VCD of a blank CaF2 window obtained under the same conditions as the gel VCD spectra.
For the film VCD measurements, ∼150 μL of Aβ(25–35) peptide stock solution (10 mg/mL) in methanol-d was cast onto a 2.5-cm diameter CaF2 window. The evaporation was continued at room temperature until a dry film was formed on the CaF2 window. Film samples were tested for satisfactory VCD characteristics by rotating the film through 90°, 180°, and 270° about the light beam axis. For all data reported here, the VCD sign pattern is independent of the rotational position of the film. The baseline for the VCD spectrum was obtained from the VCD of a blank CaF2 window obtained under the same conditions as those used for obtaining the film VCD spectrum.
Electronic circular dichroism
All ECD measurements were made on JASCO J720 spectropolarimeter at 25°C. The instrument was calibrated with ammonium d-camphor-10-sulfonate. All spectra reported in this study are an average of three individual scans. For solution ECD measurements, a concentration of 5 mg/mL or 10 mg/mL in methanol solvent or acetate buffer (pH 3) and a 0.01-cm circular quartz cell were used. The acetate buffer was prepared using H2O solution. The spectra were recorded at a scan speed of 20 nm/min and a time constant of 0.125 s. The parameters like bandwidth of 1 nm, resolution of 1 nm, and sensitivity of 100 mdeg were fixed before recording the spectra. The corresponding solvent spectrum was subtracted from the ECD spectrum of peptide solution. The resulting spectra were further processed for smoothening when needed. The kinetics of Aβ(25–35) peptide aggregation was monitored by recording the ECD spectra at different time intervals. For gel ECD measurements, ∼20 μL of gel was placed between two circular quartz windows. Measurements were carried out for the gels that are formed from solutions containing 5 and 10 mg/mL. The parameters for recording the gel-state ECD spectra were the same as those for recording the solution spectra except for a time constant of 0.5 s, scan speed of 50 nm/min, and sensitivity of 50 mdeg. For all samples under the above conditions, the HT voltage remained well within the limits required for a reliable measurement.
RESULTS AND DISCUSSION
Conformation of Aβ(25–35) in solution state
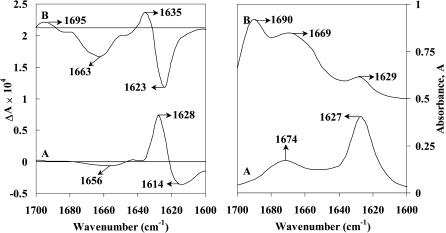
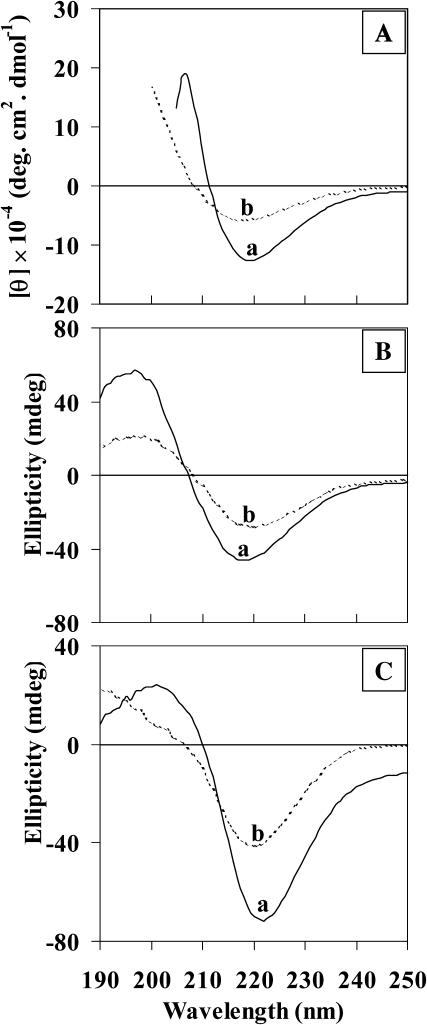
The VCD and absorption spectra of Aβ(25–35) peptide in methanol-d and DMSO-d6 solvents are shown in Fig. 1. For comparative studies ECD spectra were also recorded in methanol (Fig. 2 A). The ECD spectra in DMSO are not useful for secondary structural analysis of peptides and proteins due to interfering absorption from the solvent below 268 nm.
FIGURE 1.
VCD (left panel) and absorption (right panel) spectra of Aβ(25–35) peptide in the amide I region in methanol-d (curve A) and in DMSO-d6 (curve B), (concentration 10 mg/mL, path length 100 μM). The spectra are shifted upwards for clarity.
FIGURE 2.
ECD spectra of Aβ(25–35) peptide in methanol solution (A), peptide gel formed in methanol (B), and in acetate buffer (pH 3) (C) at two different concentrations. Curves a and b: 10 mg/mL and 5 mg/mL, respectively.
Previous reports on Aβ peptide suggested that a physicochemical interaction of Aβ peptides with a negatively charged membrane surface might be responsible for the toxic effect of Aβ to neuronal cells (Hertel et al., 1997). Recent studies also suggested that soluble Aβ associates with lipid bilayers and aggregates at the membrane surface (Lin et al., 2001; Hirakura et al., 1998). In this context, methanol provides a low dielectric environment simulating that existing near the negatively charged membrane surface (Bychkova et al., 1996). The structure of Aβ(25–35) peptide in methanol (a membrane-mimicking organic solvent), has not been reported previously.
The VCD spectrum of Aβ(25–35) peptide in methanol-d (10 mg/mL) shows a negative band at 1614 cm−1, an intense positive band at 1628 cm−1, and a weak negative band at 1656 cm−1 (Fig. 1, curve A). A similar (− +, −)-type VCD pattern was also observed for β-sheet forming homooligopeptide, Boc-(L-Val)7-OMe, in trifluoroethanol by Narayanan et al. (1986). Moreover, the appearance of amide I band in the absorption spectrum (Fig. 1, curve A) at 1627 cm−1 also indicates β-sheet structure. The appearance of the weak absorption band at 1674 cm−1 can be due to antiparallel β-sheet conformation (Krimm and Bandekar, 1986). It should be noted (Vass et al., 2003) that both β-sheet and β-turn structures exhibit absorption bands in the higher frequency amide I region (1690–1670 cm−1) along with bands in the lower frequency amide I region (1640–1620 cm−1). But Vass et al. suggested that the relative intensities of β-turn bands (I1690−1670/I1640−1620 between 2:1 and 3:2) are different from those for antiparallel β-sheets (I1690−1670/I1640−1620 between 1:10 and 1:8). Since the relative absorption intensity ratio, I1674/I1627 = 1:2.4, for Aβ(25–35) peptide in methanol-d is in between that for antiparallel β-sheet and β-turn structures, some amount of β-turn conformation may not be ruled out. The ECD spectrum in methanol at 10 mg/mL concentration (Fig. 2 A, curve a) shows the negative band at 219 nm (n-π* transition) and positive band at 208 nm with crossover point at 212 nm. These bands are characteristic of peptides having predominantly β-sheet conformation. To study the concentration effect, the ECD measurements were also carried out at a lower concentration of 5 mg/mL (Fig. 2 A, curve b). The ECD spectrum at 5 mg/mL shows a negative band at ∼218 nm, broader than that at 10 mg/mL, with crossover point at 209 nm. This suggests that the Aβ(25–35) peptide adopts predominantly β-sheet conformation at higher concentration, and β-sheet along with some admixture of other secondary structure at lower concentration. These results, obtained at relatively higher concentration in methanol-d, are relevant to Alzheimer's disease since the mechanism of fibril formation of Aβ peptides involved in AD depends on two major factors, namely higher concentration of Aβ peptide and interaction of Aβ peptide with membrane surfaces.
Previous reports (Terzi et al., 1994a,b) indicated that in lipid environment, the attraction between cationic peptides and negatively charged membrane facilitates β-sheet conformation for Aβ(25–35) peptide. In the absence of lipid environment, and at low concentration of peptide, random coil conformation was preferred. In buffer solution at pH 7.4, β-sheet conformation that was independent of concentration has been suggested for Aβ(25–35) peptide (Terzi et al., 1994a). Even in trifluoroethanol, an α-helix promoting solvent, ECD spectra suggested β-sheet conformation for Aβ(25–35) peptide (Laczko et al., 1994). In lithium dodecyl sulfate micelles (Kohno et al., 1996), NMR spectral results for Aβ(25–35) peptide were interpreted in terms of short α-helix in the C-terminal position. This study clearly suggests the formation of β-sheet structure in methanol at the concentrations employed.
One might question the relevance of DMSO to intra- or extracellular conditions, but El-Agnaf et al. (1998) suggested that DMSO is a pragmatic choice. This is based on the observations of Sorimachi and Craik (1994), that DMSO does not abolish the biological activity, and of Amodeo et al. (1991), that the liquid phases in the cytoplasm and within receptor-binding sites are characterized by higher viscosity than bulk water. DMSO or another higher viscosity liquid was suggested to be more realistic than water in modeling these environments. In addition, DMSO is known to prevent aggregation and precipitation of Aβ peptides (Garzon-Rodriguez et al., 1997; Shen and Murphy, 1995). Previous structural analysis of Aβ(25–35) peptide using NMR (El-Agnaf et al., 1998) in DMSO suggested various possibilities for secondary structure, including random coil, a linear antiparallel β-sheet, or a β-hairpin. But in a different study (Tauro et al., 2002), using two-dimensional NMR spectroscopy, Aβ(25–35) peptide was suggested to adopt a type I β-turn around C-terminal residues (-Ile-Gly-Leu-Met-) in DMSO-d6.
The VCD and vibrational absorption spectra of Aβ(25–35) peptide in DMSO-d6 (10 mg/mL) are shown in Fig. 1 (curve B). The major bands at 1690, 1669, and 1629 cm−1 observed in the absorption spectrum (Fig. 1, curve B) of Aβ(25–35) peptide in DMSO-d6 indicates that β-turn structure predominates. The relative intensity ratio, I1690/I1629 = 3:2, for Aβ(25–35) peptide in DMSO-d6 suggests the presence of predominantly β-turn conformation. The corresponding VCD spectrum (Fig. 1, curve B) shows a negative band at 1663 cm−1 and weak positive band at 1695 cm−1, characteristic of β-turn conformation (Zhao et al., 2000). These results suggest that the secondary structure of Aβ(25–35) peptide in DMSO-d6 is dominated by solvent mediated β-turn. The S=O group in DMSO-d6, a strong hydrogen bond acceptor, will compete with C=O groups for hydrogen bonding with H–N of the peptide chain. In DMSO-d6, sufficient C=O-H–N bonds are broken due to competition of S=O to form S=O-H–N. In addition, some broken C=O-H–N groups may be free. The bands at higher wavenumber probably reflect the absorption of free C=O groups. The bands in the 1645–1635 cm−1 region for β-turn structures are influenced by intramolecular hydrogen bonding (Vass et al., 2003), which is probably responsible for the strong negative VCD couplet (negative band at 1623 cm−1 and positive band at 1635 cm−1) unlike that in methanol-d, where antiparallel β-sheet conformation is implicated (vide supra). In methanol, the hydrogen bond between polypeptide backbone and solvent is less favored, resulting in a prominent β-sheet formation. It is worth noting here that Aβ(25–35) peptide was found, by two-dimensional NMR spectroscopy (Tauro et al., 2002), to adopt a type I β-turn around C-terminal residues (-Ile-Gly-Leu-Met-) in DMSO-d6. Recently, Bond et al. (2003) have also shown by the x-ray diffraction method that the C-terminal hydrophobic residues (-Ile-Ile-Gly-Leu-Met-) adopt β-turn conformation. Our VCD results on Aβ(25–35) peptide in DMSO clearly indicate the presence of predominantly β-turn conformation.
Conformation of Aβ(25–35) peptide in gel state
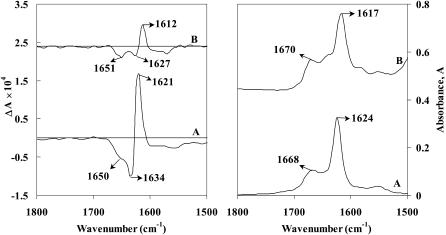
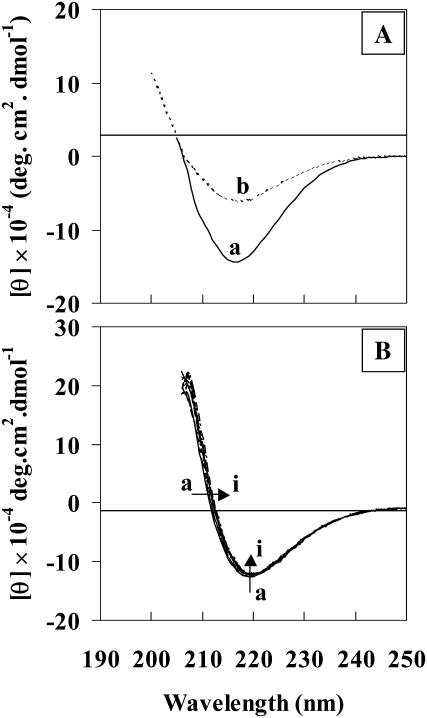
The structure of Aβ(25–35) peptide gel formed from aqueous and organic solvents is reported here for the first time. The Aβ(25–35) peptide gel was obtained separately in methanol-d and acetate buffer (pD 3) after incubating the stock solution (10 mg/mL) at room temperature for 24 h. Acidic condition was chosen because it promotes the formation of toxic fibrils from Aβ peptides (Su and Chang, 2001). Since acidic pH values have been shown to promote the self-assembly of Aβ, which seems to be responsible for AD, elucidating the structure of Aβ(25–35) in acidic environment at higher concentration may shed more light in the self-assembly of Aβ. In this case, Aβ(25–35) peptide gel formation in acetate buffer solution occurs in ∼2 h, which is faster than the 15 h required for gel formation in methanol (as observed by visual inspection). Fig. 3 shows the VCD and absorption spectra of Aβ(25–35) peptide gel in methanol-d (curve A) and acetate buffer (curve B). The VCD spectrum in methanol-d shows a weak negative band at ∼1600 cm−1, a strong positive band at 1621 cm−1, and a negative band at 1634/1650 cm−1. A similar (−, +, −)-type VCD spectrum was noted earlier for Aβ(25–35) peptide in methanol solution and also for β-sheet forming homooligopeptide, Boc-(L-Val)7-OMe, both in film and solution states, by Narayanan et al. (1986). The vibrational absorption spectrum of Aβ(25–35) peptide gel derived from methanol-d (Fig. 3, curve A) shows an intense amide I band at 1624 cm−1, which is due to β-sheet structure. The presence of a weak band at 1668 cm−1 can be assigned to antiparallel β-sheet structure. However, since the observed intensity ratio, I1668/I1624 = 1:3, is in between that for β-sheet and β-turn a small proportion of β-turn structure may not be ruled out. Recently, Bond et al. (2003) have suggested that Aβ(25–35) peptide takes a reverse turn at Gly33, which results in intramolecular hydrogen bonding between the antiparallel chains. The corresponding ECD spectrum (Fig. 2 B) of both higher (10 mg/mL, curve a) and lower (5 mg/mL, curve b) concentration gel formed in methanol, show a single intense negative band around 218–220 nm and a positive band around 197–199 nm with a crossover point around 208–209 nm, which are characteristic of peptides adopting β-sheet conformation. In the case of Aβ(25–35) peptide gel formed in acetate buffer, VCD spectrum (Fig. 3, curve B) shows similar VCD features (positive couplet with positive bias) as observed in methanol (Fig. 3, curve A). However, in acetate buffer, the spectrum shows a well-resolved negative band at 1651 cm−1, unlike in methanol. The vibrational absorption spectrum is similar to that observed for the gel formed from methanol, except for minor frequency shifts and an additional weak band at ∼1650 cm−1. ECD spectra of the gel formed in acetate buffer also indicate predominant β-sheet structure both at higher (Fig. 2 C, curve a) and lower (Fig. 2 C, curve b) concentrations. A similar structural feature can be deduced from ECD spectra in acetate buffer solution (Fig. 4 A). The gel formed from higher concentration solution (Fig. 2 C, curve a) shows a greater baseline shift in the ECD spectrum than that at lower concentration (Fig. 2 C, curve b). This suggests that the size of the aggregate formed at higher concentration is greater than that formed at lower concentration.
FIGURE 3.
VCD (left panel) and absorption (right panel) spectra of Aβ(25–35) peptide gel formed in methanol-d (A) and acetate (pD 3) buffer (B) (concentration 10 mg/mL). The spectra are shifted upwards for clarity.
FIGURE 4.
(A) ECD spectra of Aβ(25–35) peptide in acetate buffer solution (pH 3) at two different concentrations, (a) 10 mg/mL, and (b) 5 mg/mL. (B) ECD spectra of Aβ(25–35) peptide in methanol (10 mg/mL, path length 0.01 cm) at different time intervals (h). Curves a through i: 0, 1, 2, 3, 4, 5, 6, 7, and 24 h.
Kinetics of Aβ(25–35) peptide aggregation
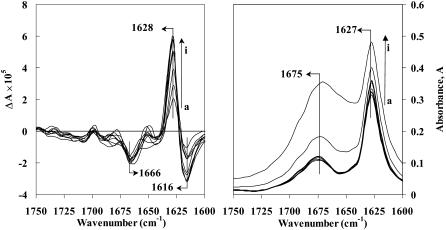
The conformational events that occur after initial β-sheet aggregate formation of Aβ(25–35) peptide in methanol (10 mg/mL) were monitored by VCD and ECD. Here methanol was used instead of methanol-d for VCD measurements, because the hydrogen-deuterium exchange process involved between amide protons and solvent can interfere with time-dependent structural changes as inferred from changes in IR absorption and VCD spectra. VCD and absorption spectra of Aβ(25–35) peptide in methanol at different time intervals are presented in Fig. 5. The spectra show that the amide I VCD bands have (− + −)-type sign pattern with bands at 1616, 1628, and 1666 cm−1. Similar VCD sign pattern was obtained for a β-sheet forming homooligopeptide, Boc-(L-Val)7-OMe, in both solution and film states, by Narayanan et al. (1986). From the inspection of spectra at different time intervals (Fig. 5, curves a to i), the VCD intensities of Aβ peptide at 1628 and 1616 cm−1 are seen to increase with time, but the VCD intensity of the weak band at 1666 cm−1 did not change significantly. The VCD intensities seen in the 1675–1700 cm−1 region are too weak to draw any definitive conclusions. In the absorption spectrum, the intensity of 1675 cm−1 band is seen to remain constant and that of 1627 cm−1 band is seen to increase with time for up to 9 h, with the intensity ratio I1675/I1627 being around 1:3. However, for reasons that are not clear, the last two absorption spectra, taken at 18 and 47.5 h, show an overall baseline shift and increased intensity at 1675 cm−1. One possible explanation for this could be scattering resulting from the aggregate formation at these later times. The corresponding time-dependent ECD (Fig. 4 B) shows β-sheet spectra, characterized by the presence of a negative band at 220 nm with crossover point at 211 nm. There is a small time-dependent change in the intensity of the CD band at 220 nm and also in the crossover point. During the incubation period, the series of ECD spectra (Fig. 4 B, curves a to i) at different time intervals are very similar to the spectrum at 0 h, but the crossover points indicate a small red shift in the wavelength. This indicates a distinct structural change as suggested by previous research groups (Maeda, 1987; Maeda and Ooi, 1981; Saito et al., 1982). A similar type of red shift in the crossover point was previously observed for islet amyloid polypeptide in aqueous buffer solution (Kayed et al., 1999).
FIGURE 5.
VCD (left panel) and absorption (right panel) spectra of Aβ(25–35) peptide in methanol solution (10 mg/mL, path length 50 μm) at different time intervals (h). (a) 0, (b) 1, (c) 2, (d) 4, (e) 6.5, (f) 7.5, (g) 9, (h) 18, and (i) 47.5.
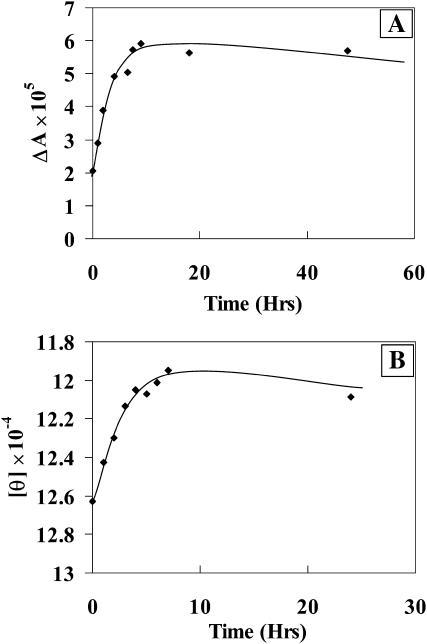
Variation of VCD intensity (at 1628 cm−1) with time (Fig. 6 A) for Aβ(25–35) peptide in methanol shows that the slope of intensity versus time curve changes at ∼7 h. This may suggest that a saturation of β-structure formation occurs at ∼7 h. The change in ECD intensity (molar ellipticity) at 216 nm (Fig. 6 B) with time also shows that the slope changes at ∼7 h, which is in good agreement with that concluded from the VCD results (Fig. 6 A). However, the spectral changes with time were more clearly observed with VCD (amide I region) than with ECD. This observation suggests that VCD is a comparatively more sensitive method in the determination of kinetics of Aβ(25–35) peptide aggregation.
FIGURE 6.
Time-dependent changes in spectral intensities in methanol. (A) Variation of VCD intensity at 1628 cm−1. (B) Variation of ECD intensity at 216 nm.
Conformation of Aβ(25–35) peptide film
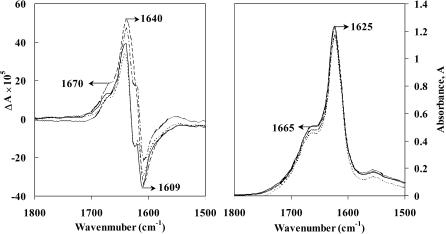
The conformation of Aβ(25–35) peptide film was also analyzed using vibrational absorption and VCD. Films were tested for satisfactory VCD characteristics by comparison of the film VCD obtained with the sample rotated at different angles (90°, 180°, and 270°) around the light beam axis. The corresponding VCD and absorption spectra are depicted in Fig. 7, where the VCD sign patterns can be seen to be orientation-independent. The spectra show a negative band at 1609 cm−1, a positive band at 1640 cm−1, and a weak positive shoulder at 1670 cm−1. Compared to the VCD spectrum in methanol-d solution (Fig. 1, left panel) the positive VCD band for the film is blue-shifted. The weak positive shoulder at 1670 cm−1 seen in the film VCD spectrum is also blue-shifted and is opposite in sign to that seen in solution at 1656 cm−1 (Fig. 1, left panel). Nevertheless, the corresponding IR absorption spectrum of film (Fig. 7) shows a weak band at 1665 cm−1 and an intense band at 1625 cm−1, with an intensity ratio of 1:2.5, which may be assigned to a mixture of β-sheet and β-turn structures. This observation is consistent with that in a previous study (Bond et al., 2003), where solubilized peptide after subsequent drying was determined from x-ray diffraction pattern to have β-sheet structure. Bond et al. (2003) have also indicated that the hydrophobic Aβ(31–35) residue (Ile-Ile-Gly-Leu-Met) is involved in a turn conformation.
FIGURE 7.
VCD (left panel) and absorption (right panel) spectra of Aβ(25–35) peptide film. The film was formed from methanol-d stock solution (10 mg/mL) by evaporation at room temperature. Curve: normal (solid line), 90° rotation (dashed line), 180° rotation (dotted line), and 270° rotation (dash-dot-dash line).
CONCLUSIONS
This study addresses the question of the structure of Aβ(25–35) peptide at higher concentration in membraneous (methanol), aggregated (acidic solution), and nonaggregated (DMSO) conditions using VCD, IR absorption, and ECD spectroscopy. Based on these spectroscopic results, the Aβ(25–35) peptide was found to adopt predominantly β-sheet structure in methanol solution, in the gel (formed from methanol or acidic acetate buffer), and in the film prepared from methanol solution by evaporation. Time-dependent measurements in methanol solution, monitoring the aggregation process, indicate that the saturation of β-sheet formation occurs at ∼7 h. Based on the current and previous studies on Aβ(25–35) peptide, it can be suggested that the five residues, from Ile (31) to Met (35), at the C-terminal end form a β-turn conformation and that the remaining residues, 25–30, participate in interpeptide β-sheet formation. However, solvent mediated β-turn appears to dominate in DMSO-d6 solution. This work also demonstrates that VCD is a measurable and useful property for structural elucidation of amyloid-forming peptides in different conditions (solution, gel, and dry thin film). A combination of VCD with IR and ECD methods is seen to help in analyzing the structure of Aβ(25–35) peptide, more than if only one of these methods is used. We hope to undertake future studies in the conformational analysis of other amyloid peptides including prion, polyglutamine, and islet amyloid polypeptides under different environments.
Acknowledgments
We thank Drs. Rina Dukor of BioTools and X. Cao of Syracuse University for assistance in setting up the external bench in the ChiralIr instrument.
This material is based upon work supported by the National Science Foundation under grant 0092922.
References
- Amodeo, P., A. Motta, D. Picone, G. Saviano, T. Tancredi, and P. A. Termussi. 1991. Viscosity as a conformational sieve—NOE of linear peptides in cryoprotective mixtures. J. Mag. Res. 95:201–207. [Google Scholar]
- Baumruk, V., and T. A. Keiderling. 1993. Vibrational circular dichroism of proteins in H2O solution. J. Am. Chem. Soc. 115:6939–6942. [Google Scholar]
- Behl, C. 1997. Amyloid β-protein toxicity and oxidative stress in Alzheimer's disease. Cell Tissue Res. 290:471–480. [DOI] [PubMed] [Google Scholar]
- Bond, J. P., S. P. Deverin, H. Inouye, O. M. A. El-Agnaf, M. M. Teeter, and D. A. Kirschner. 2003. Assemblies of Alzheimer's peptide Aβ25–35 and Aβ31–35: reverse-turn conformation and side-chain interactions revealed by X-ray diffraction. J. Struct. Biol. 141:156–170. [DOI] [PubMed] [Google Scholar]
- Borics, A., R. F. Murphy, and S. Lovas. 2003. Fourier transform vibrational circular dichroism as a decisive tool for conformational studies of peptides containing tyrosyl residues. Biopolymers. 72:21–24. [DOI] [PubMed] [Google Scholar]
- Burdick, D., B. Soreghan, M. Kwon, J. Kosmoski, M. Knauer, A. Henschen, J. Yates, C. Cotman, and C. Glabe. 1992. Assembly and aggregation properties of synthetic Alzheimer's A4/β amyloid peptide analogs. J. Biol. Chem. 267:546–554. [PubMed] [Google Scholar]
- Bychkova, V. E., A. E. Dujsekina, A. I. Klenin, E. I. Tiktopulo, V. N. Uversky, and O. B. Ptitsyn. 1996. Molten globule-like state of cytochrome C under conditions simulating those near the membrane surface. Biochemistry. 35:6058–6063. [DOI] [PubMed] [Google Scholar]
- Chan, W. C., and P. D. White. 2000. Fmoc Solid Phase Peptide Synthesis. Oxford University Press, Oxford, UK.
- Cooper, E. A., and K. Knutson. 1995. Fourier transform infrared spectroscopy investigations of protein structure. Pharm. Biotechnol. 7:101–143. [DOI] [PubMed] [Google Scholar]
- Eker, F., X. Cao, L. A. Nafie, and R. J. Schweitzer-Stenner. 2002. Tripeptides adopt stable structures in water. a combined polarized visible Raman, FTIR, and VCD spectroscopy study. J. Am. Chem. Soc. 124:14330–14341. [DOI] [PubMed] [Google Scholar]
- El-Agnaf, O. M. A., G. B. Irvine, G. Fitzpatrick, W. K. Glass, and D. J. S. Guthrie. 1998. Comparative studies on peptides representing the so called tachykinin-like region of Alzheimer Aβ peptide [Aβ(25–35)]. Biochem. J. 336:419–427. [DOI] [PMC free article] [PubMed] [Google Scholar]
- Garzon-Rodriguez, W., M. Sepulveda-Becerra, S. Milton, and C. G. Glabe. 1997. Soluble amyloid Aβ(1–40) exists as a stable dimer at low concentrations. J. Biol. Chem. 272:21037–21044. [DOI] [PubMed] [Google Scholar]
- Halverson, K., P. E. Fraser, D. A. Kirschner, and P. T. Lansbury Jr. 1990. Molecular determinants of amyloid deposition in Alzheimer's disease: conformational studies of synthetic β-protein fragments. Biochemistry. 29:2639–2644. [DOI] [PubMed] [Google Scholar]
- Haris, P. I., and D. Chapman. 1995. The conformational analysis of peptides using Fourier transform IR spectroscopy. Biopolymers. 37:251–263. [DOI] [PubMed] [Google Scholar]
- Hertel, C., E. Terzi, N. Hauser, R. Jakob-Rotne, J. Seelig, and J. A. Kemp. 1997. Inhibition of the electrostatic interaction between β-amyloid peptide and membranes prevents β-amyloid-induced toxicity. Proc. Natl. Acad. Sci. USA. 94:9412–9416. [DOI] [PMC free article] [PubMed] [Google Scholar]
- Hilario, J., J. Kubelka, and T. A. Keiderling. 2003. Optical spectroscopic investigation of model β-sheet hairpins in aqueous solution. J. Am. Chem. Soc. 125:7562–7574. [DOI] [PubMed] [Google Scholar]
- Hirakura, Y., Y. Satoh, N. Hirashima, T. Suzuki, B. L. Kagan, and Y. Kirino. 1998. Membrane perturbation by the neurotoxicity Alzheimer amyloid fragment β 25–35 requires aggregation and β-sheet formation. Biochem. Mol. Biol. Int. 46:787–794. [DOI] [PubMed] [Google Scholar]
- Johnson, W. C., Jr. 1985. Circular dichroism and its empirical application to biopolymers. Meth. Biochem. Anal. 31:61–163. [DOI] [PubMed] [Google Scholar]
- Kayed, R., J. Bernhagen, N. Greenfield, K. Sweimeh, H. Brunner, W. Voelter, and A. Kapurniotu. 1999. Conformational transitions of islet amyloid polypeptide (IAPP) in amyloid formation in vitro. J. Mol. Biol. 287:781–796. [DOI] [PubMed] [Google Scholar]
- Keiderling, T. A. 1986. Vibrational CD of biopolymers. Nature. 6082:851–852. [Google Scholar]
- Keiderling, T. A. 2002. Protein and peptide secondary structure and conformational determination with vibrational circular dichroism. Curr. Opin. Chem. Biol. 6:682–688. [DOI] [PubMed] [Google Scholar]
- Keiderling, T. A., R. A. Silva, G. Yoder, and R. K. Dukor. 1999. Vibrational circular dichroism spectroscopy of selected oligopeptide conformations. Bioorg. Med. Chem. 7:133–141. [DOI] [PubMed] [Google Scholar]
- Keiderling, T. A., and Q. Xu. 2002. Unfolded peptides and proteins studied with infrared absorption and vibrational circular dichroism spectra. Adv. Prot. Chem. 62:111–161. [DOI] [PubMed] [Google Scholar]
- Kohno, T., K. Kobayashi, T. Maeda, K. Sato, and A. Takashima. 1996. Three-dimensional structures of the amyloid β peptide (25–35) in membrane-mimicking environment. Biochemistry. 35:16094–16104. [DOI] [PubMed] [Google Scholar]
- Krimm, S., and J. Bandekar. 1986. Vibrational spectroscopy and conformation of peptides, polypeptides and proteins. Adv. Protein Chem. 38:181–364. [DOI] [PubMed] [Google Scholar]
- Laczko, I., S. Holly, Z. Konya, K. Soos, J. L. Varga, M. Hollosi, and B. Penke. 1994. Conformational mapping of amyloid peptides from the putative neurotoxic 25–35 region. Biochem. Biophys. Res. Commun. 205:120–126. [DOI] [PubMed] [Google Scholar]
- Lin, H., R. Bhatia, and R. Lal. 2001. Amyloid β protein forms ion channels: implication for Alzheimer's disease pathophysiology. FASEB. 15:2433–2444. [DOI] [PubMed] [Google Scholar]
- Lin, S. Y., H. L. Chu, and Y. S. Wei. 2003. Secondary conformations and temperature effect on structural transformation of amyloid β (1–28), (1–40) and (1–42) peptides. J. Biomol. Struct. Dyn. 20:595–601. [DOI] [PubMed] [Google Scholar]
- Lomakin, A., D. B. Teplow, D. A. Kirschner, and G. B. Benedek. 1997. Kinetic theory of fibrillogenesis of amyloid β-protein. Proc. Natl. Acad. Sci. USA. 94:7942–7947. [DOI] [PMC free article] [PubMed] [Google Scholar]
- Maeda, H. 1987. Irreversible nature of the stacked β-pleated sheets of a model polypeptides. Bull. Chem. Soc. Jpn. 60:3438–3440. [Google Scholar]
- Maeda, H., and K. Ooi. 1981. Isodichroic point and the xβ-random coil transition of poly(S- carboxymethyl-L-cystein) and poly(S-carboxyethyl-L-cystein) in the absence of added salt. Biopolymers. 20:1549–1563. [Google Scholar]
- Mager, P. P. 1998. Molecular simulation of the primary and secondary structures of the Aβ (1–42)-peptide of Alzheimer's disease. Med. Res. Rev. 18:403–430. [DOI] [PubMed] [Google Scholar]
- Manning, M. C. 1989. Conformation of the α-form of human calcitonin gene-related peptide (CGRP) in aqueous solution as determined by circular dichroism spectroscopy. Biochem. Biophys. Res. Commun. 160:388–392. [DOI] [PubMed] [Google Scholar]
- May, P. C., B. D. Gitter, D. C. Waters, L. K. Simmons, G. W. Becker, and J. S. Small. 1992. β-Amyloid peptide in vitro toxicity: lot-to-lot variability. Neurobiol. Aging. 13:605–607. [DOI] [PubMed] [Google Scholar]
- Nafie, L. A. 2000. Dual polarization modulation: a real-time, spectral-multiplex separation of circular dichroism from linear birefringence spectral intensities. Appl. Spectrosc. 54:1634–1645. [Google Scholar]
- Narayanan, U., T. A. Keiderling, G. M. Bonora, and C. Toniolo. 1986. Vibrational circular dichroism of polypeptides. VII. Film and solution studies of β-sheet-forming homo-oligopeptides. J. Am. Chem. Soc. 108:2431–2437. [DOI] [PubMed] [Google Scholar]
- Narayanan, U., T. A. Keiderling, G. M. Bonora, and C. Toniolo. 1985. Vibrational circular dichroism of polypeptides. IV. Film studies of L-alanine homo-oligopeptides. Biopolymers. 24:1257–1263. [DOI] [PubMed] [Google Scholar]
- Pancoska, P., S. C. Yasui, and T. A. Keiderling. 1989. Enhanced sensitivity to conformation in various proteins. Vibrational circular dichroism results. Biochemistry. 28:5917–5923. [DOI] [PubMed] [Google Scholar]
- Pelton, J. T., and L. R. McLean. 2000. Spectroscopic methods for analysis of protein secondary structure. Anal. Biochem. 277:167–176. [DOI] [PubMed] [Google Scholar]
- Pike, C. J., A. J. Walencewicz-Wasserman, J. Kosmoski, D. H. Cribbs, C. G. Glabe, and C. W. Cotman. 1995. Structure-activity analyses of β-amyloid peptides: contributions of the β 25–35 region to aggregation and neurotoxicity. J. Neurochem. 64:253–265. [DOI] [PubMed] [Google Scholar]
- Polavarapu, P. L., and C. Zhao. 2000. Vibrational circular dichroism: a new spectroscopic tool for biomolecular structural determination. Fresenius J. Anal. Chem. 366:727–734. [DOI] [PubMed] [Google Scholar]
- Saito, K., H. Maeda, and S. Ikeda. 1982. Reversible and irreversible conversion between the intermolecular β-structure and the disordered state of poly(S-carboxymethyl-L-cysteine) in aqueous media. Biophys. Chem. 16:67–77. [DOI] [PubMed] [Google Scholar]
- Sambamurthi, K., N. H. Greig, and D. K. Lahiri. 2002. Advances in the cellular and molecular biology of the β-amyloid protein in Alzheimer's disease. Neuromol. Med. 1:1–31. [DOI] [PubMed] [Google Scholar]
- Serpell, L. C. 2000. Alzheimer's amyloid fibrils: structure and assembly. Biochim. Biophys. Acta. 1502:16–30. [DOI] [PubMed] [Google Scholar]
- Shen, C. L., and R. M. Murphy. 1995. Solvent effects on self-assembly of β-amyloid peptide. Biophys. J. 69:640–651. [DOI] [PMC free article] [PubMed] [Google Scholar]
- Simmons, L. K., P. C. May, K. J. Tomaselli, R. E. Reydel, K. S. Fuson, E. F. Brigham, S. Wright, I. Liberburg, G. W. Becker, D. N. Brems, and W. Y. Li. 1994. Secondary structure of amyloid β peptide correlates with neurotoxic activity in vitro. Mol. Pharmacol. 45:373–379. [PubMed] [Google Scholar]
- Sorimachi, K., and D. J. Craik. 1994. Structure determination of extracellular fragments of amyloid proteins involved in Alzheimer's disease and Dutch-type hereditary cerebral haemorrhage with amyloidosis. Eur. J. Biochem. 219:237–251. [DOI] [PubMed] [Google Scholar]
- Su, Y., and P.-T. Chang. 2001. Acidic pH promotes the formation of toxic fibrils from β-amyloid peptide. Brain Res. 893:287–291. [DOI] [PubMed] [Google Scholar]
- Tauro, S., E. Coutinho, and S. Srivastava. 2002. A rare occurrence of a β-turn in an amyloid βA4 peptide. Magn. Res. Chem. 40:211–218. [Google Scholar]
- Terzi, E., G. Holzemann, and J. Seelig. 1994a. Reversible random coil-β-sheet transition of the Alzheimer β-amyloid fragment (25–35). Biochemistry. 33:1345–1350. [DOI] [PubMed] [Google Scholar]
- Terzi, E., G. Holzemann, and J. Seelig. 1994b. Alzheimer β-amyloid peptide 25–35: electrostatic interaction with phospholipid membranes. Biochemistry. 33:7434–7441. [DOI] [PubMed] [Google Scholar]
- Urbanova, M., V. Setnicka, V. Kral, and K. Volka. 2001. Noncovalent interactions of peptides with porphyrins in aqueous solution: conformational study using vibrational CD spectroscopy. Biopolymers. 60:307–316. [DOI] [PubMed] [Google Scholar]
- Vass, E., M. Hollosi, F. Besson, and R. Buchet. 2003. Vibrational spectroscopic detection of beta- and gamma-turns in synthetic and natural peptides and proteins. Chem. Rev. 103:1917–1954. [DOI] [PubMed] [Google Scholar]
- Wang, F., and P. L. Polavarapu. 2003. Conformational analysis of melittin in solution phase: vibrational circular dichroism study. Biopolymers. 70:614–619. [DOI] [PubMed] [Google Scholar]
- Yang, J. T., C. S. C. Wu, and H. M. Martinez. 1986. Calculation of protein conformation from circular dichroism. Meth. Enzymol. 130:208–269. [DOI] [PubMed] [Google Scholar]
- Yasui, S. C., and T. A. Keiderling. 1986. Vibrational circular dichroism of polypeptides. VIII. Poly(lysine) conformations as a function of pH in aqueous solution. J. Am. Chem. Soc. 108:5576–5581. [DOI] [PubMed] [Google Scholar]
- Yoder, G., T. A. Keiderling, F. Formaggio, M. Crisma, and C. Toniolo. 1995. Characterization of β-bend ribbon spiral forming peptides using electronic and vibrational CD. Biopolymers. 35:103–111. [DOI] [PubMed] [Google Scholar]
- Zhao, C., and P. L. Polavarapu. 2001. Vibrational circular dichroism of gramicidin D in vesicles and micelles. Biopolymers. 62:336–340. [DOI] [PubMed] [Google Scholar]
- Zhao, C., P. L. Polavarapu, C. Das, and P. Balaram. 2000. Vibrational circular dichroism of β- hairpin peptides. J. Am. Chem. Soc. 122:8228–8231. [Google Scholar]


