Abstract
Development of collagen fibril alignment in contracting fibroblast-populated and externally tensioned acellular collagen gels was studied using elastic scattering spectroscopy. Spectra of the backscattered light (320–860 nm) were acquired with a 2.75-mm source-detector separation probe placed perpendicular to the gel surface and rotated to achieve different angles to the collagen fibril alignment. Backscatter was isotropic for noncontracted/unloaded gels (disorganized matrix). As gels were contracted/externally loaded (collagen alignment developed), anisotropy of backscatter increased: more backscatter was detected perpendicular than parallel to the direction of the fibril alignment. An “anisotropy factor” (AF) was calculated to characterize this effect as the ratio of backscatter intensities at orthogonal positions. Before contraction (or zero strain) the AF was close to unity at all wavelengths. In contrast, at 72 h, backscatter anisotropy varied from AF400nm = 2.14 ± 0.29 to AF700nm = 3.04 ± 0.48. It also increased over threefold up to a strain of 20%. The AF strongly correlated with the contraction time/strain. Different directions of the backscatter were detected in gel zones with known differences in the matrix alignment. Thus, backscatter anisotropy allows in situ nondestructive determination of collagen fibril alignment and quantitative monitoring of its development.
INTRODUCTION
Nondestructive monitoring of the formation and structural organization of tissue-engineered constructs is a major requirement both for tissue bioreactor technology and in vivo assessment of implanted constructs. Indeed, real-time structural monitoring could advance our understanding of normal physiology. Fibroblasts are cells responsible for connective tissue maintenance, turnover, and repair. They respond to tissue injury by depositing and contracting together a new collagen-rich matrix. Contraction of fibroblast populated collagen lattices (FPCL) is widely used as an experimental model for wound contraction and connective tissue biomechanics (Elsdale and Bard, 1972; Guidry and Grinnell, 1985; Tomasek et al., 1992; Brown et al., 1998). FPCLs are formed by suspending the cells in reconstituted type I collagen gel. Attachment of cells to surrounding collagen fibrils and their traction causes compaction of the entangled fiber network and exudation of the interstitial culture medium (Bell et al., 1979; Barocas et al., 1995; Tower et al., 2002). Alignment of cells and collagen fibers is a result of the forces generated by this cell-mediated gel contraction. Uniaxial alignment is produced, when the gel is restrained in a defined way, for example by tethering the opposing ends of a rectangular gel (Eastwood et al., 1996). Different approaches are used to measure the force produced by fibroblasts while the gel is contracted, for example, silicone film wrinkling (Stopak and Harris, 1982) and culture force monitor (Eastwood et al., 1994; Sethi et al., 2002). In this latter system developed in this laboratory, a highly sensitive force transducer is attached to the FPCL. As the gel contracts, displacement as small as 10−6 m could be detected, which is then converted into a force reading. Morphological studies of the fibroblasts cultured in collagen lattices showed that over time cells change in shape, extend processes out into the gel, and develop attachments, generating force as a result of traction of the collagen matrix (Eastwood et al., 1996, 1998). FPCL-based tissue-engineered constructs have been studied using, for example, time-lapse video monitoring (Harris et al., 1985), in vivo confocal microscopy (Knight et al., 2002), or stereo optical and electron microscopy of fixed specimens (Eastwood et al, 1996, 1998). Such conventional assessment relies on observation, which is qualitative, subjective, and in the latter case, destructive and retrospective with small sampling volumes. Optical monitoring techniques based on spectroscopy are attractive as they are nondestructive, could use miniature fiber optic probes, obtain real-time quantitative output, and are relatively low cost.
Elastic Scattering Spectroscopy (ESS) is a novel cost-effective technique with a growing number of applications in medical diagnostic (Bigio and Mourant, 1997; Haringsma, 2002) and tissue engineering (Marenzana et al., 2002). White light is delivered to the surface of the tissue-engineered construct by an optical fiber, where it can be reflected, refracted, scattered, and/or absorbed. Backscattered light is collected by a detecting optical fiber and analyzed by a spectrometer. Spectra of the backscattered light contain quantitative information about structure and composition of the studied material. The amount of backscattered light for any given wavelength (λ) changes if the size of scattering particles or their relative refractive index changes. Light scattering is considered to be sensitive to structures smaller than those commonly observed by standard pathology methods (Mourant et al., 2002).
It has previously been shown that there is a significant anisotropy of backscattered light from tissues with some structural alignment, for instance collagen fibers in human skin (Nickell et al., 2000), horse tendons (Kostyuk et al., 2004), and muscle fibers in chicken breast tissue (Marquez et al., 1998). This anisotropy arises from the fact that different amounts of light reach the detecting fiber if light travels along rather than across the structural components (fibers) of the tissue. Moreover, Monte Carlo simulations of partly oriented scattering cylinders predicted the observed anisotropy (Nickell et al., 2000) and were used to calculate the proportion of aligned fibers on a background of randomly oriented fibers. In this study we have tested the hypothesis that structural alignment of cell/collagen matrix, which develops during fibroblast-populated gel contraction or tensile loading of acellular collagen gels, generates a corresponding anisotropy of the backscattered light.
METHODS
Fibroblast populated collagen lattices
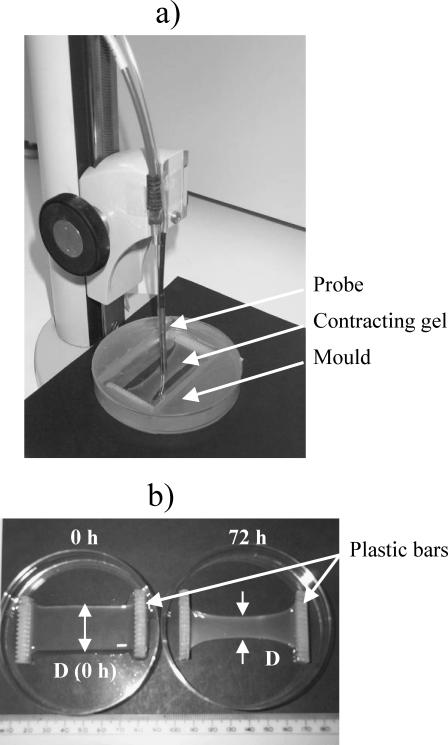
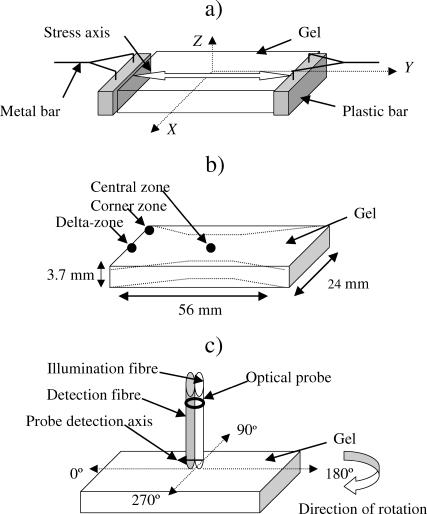
Human dermal fibroblasts were obtained from explants (Burt and McGrouther, 1992) grown from forearm skin taken directly from the operating theater from human subjects undergoing surgical intervention for reasons independent of this study (with full patient consents and approval of the relevant ethical committee). Cells were cultured in Dulbecco's modified Eagle's medium (DMEM) supplemented with 10% (v/v) fetal calf serum (FCS; First Link, West Midlands, UK), glutamine (2 ml; GIBCO Life Technologies, Paisley, UK) and penicillin-streptomycin (1000 units/ml–100 μg/ml; GIBCO Life Technologies). Cells of the eighth passages of culture were used. Collagen gels were prepared from the native acid-soluble type I rat tail collagen (2.03 mg/ml; First Link, West Midlands, UK) supplemented with 10 × DMEM, added at a proportion of 12.5% of the collagen solution, and neutralized with 5M NaOH (Bell et al., 1979, Eastwood et al., 1996). For preparation of a FPCL 1 × 10⁶ cells per ml was suspended in the collagen solution. Five ml of the cell/collagen solution was poured into a rectangular shaped mould (56 mm × 24 mm × 3.7 mm), with a porous plastic bar at each end as the attachment points (Figs. 1 and 2). Then moulds with cell/collagen solutions were placed into a sterile incubator, at 37°C and 5% CO2 for 15 min, allowing for the phase transition of the collagen solution into a collagen gel. After this setting time, the gels were covered with phenol red-free complete DMEM and released from the mould, with the position of the gel ends fixed by the attachment to the restrained plastic bars. Contraction of cells generated tension in the long axis of the gel (along the y axis, Fig. 2 a), which determined the principal strain of contraction (as confirmed by finite element analysis of the force distribution (Eastwood et al., 1998)). Gel contraction was monitored over 72 h. Gel appearances before (0 h) and after the contraction (72 h) is shown in the Fig. 1 b.
FIGURE 1.
(a) Spectra acquisition setup with the optical probe applied to monitor the development of alignment in the central zone of a contracting collagen gel. Probe vertical position was adjusted using a manual rack pinion microscope stage. (b) Noncontracted (0 h) and contracted (72 h) FPCLs. A geometric parameter, Dc, was calculated as a ratio of the gel's width in the central zone during contraction, D, to that of the uncontracted gel, D (0 h): Dc = D/D (0 h).
FIGURE 2.
Scheme of the gel and probe application. (a) Position of a gel in the rectangular coordinate system. Direction of stress (either developed during FPCL contraction or externally applied to acellular gels) corresponded to the longitudinal axis of the gel, along the y axis. (b) Positions of the zones of interest: central zone, δ-zone and corner zone, used in monitoring. Dotted profile shows gel waisting over the contraction period. (c) Angular positions of the gel relative to the optical probe used to obtain spatially resolved spectral measurements.
Registration of the contraction force developed by human dermal fibroblasts
Culture force monitor was used to register contraction force developed over 92 h by HDF from two fibroblast populated collagen lattices prepared as described previously (Eastwood et al., 1994; Sethi et al., 2002).
Tensile loading of collagen gels
Seven acellular gels were prepared as described above, but allowed to set for 30 min (to achieve stronger attachment to the plastic bars necessary for mechanical testing). After a gel was set in a mould it was carefully transferred to a plastic petri dish with PBS buffer for the uniaxial tensile loading. Some initial gel stretching was unavoidable as the gel was lifted manually via the plastic bars, so the weight of the gel was unsupported during the transfer process. The petri dish with the floating gel was then placed on a gel tensioning stage, where the gel was connected via the plastic bars to the rigid metal bars (Fig. 2 a), one of which was fixed and the other was attached to the moving stage. Tension was applied parallel to the longitudinal axis of the gels by stretching the gel along the y axis (Fig. 2 a) manually, by moving the micrometer-precise positioning stage. The change in the gel length was registered as the gel was stretched.
Scanning electron microscopy
The central zone of the fibroblast-populated collagen gels (Fig. 2 b) was studied by scanning electron microscopy (SEM) after 0, 17, and 72 h of contraction, to assess cell and collagen fibril alignment. In addition, acellular collagen gels were studied in unloaded and loaded (10% strain) states. Gel samples were fixed overnight in 2% glutaraldehyde (25% EM grade, Agar Scientific, Stanstead, UK) in 0.1 M sodium cacodylate buffer, freeze-dried, coated with gold palladium (Au/Pd Target, Emitech, Ashford, UK) for 2 min and observed under a scanning electron microscope (Jeol JSM 5500 LV).
Elastic scattering spectroscopy
The optical setup as described previously by Marenzana et al. (2002) consisted of a fiber-optical probe connected to a xenon light source and a spectrometer (Ocean Optics, Dunedin, FL), controlled by a notebook PC. A probe with 2.75-mm source-detector separation was assembled using the 400-μm diameter illumination fiber of a custom-made probe, and a 200-μm diameter detection fiber from a seven-fiber reflection probe (Knight Optical Technologies, Leatherhead, UK). The axis between the illuminating and detecting fibers is termed here as the detection axis of the probe (Fig. 2 c).
Gels were illuminated with short pulses (∼35 ms) of white light (320–860 nm) and the spectra of backscattered light were collected. A spectrum of the diffuse reflectance standard (Ocean Optics), recorded before each measurement session, was used as a reference to take into account spectral characteristics and overall intensity of the lamp. Measurements were made in the central zone of the contracting gels (Fig. 2 b) at 0, 17, 24, 41, 47, 65, and 72 h of contraction. The optical probe was positioned perpendicular to the gel surface, and the vertical position of the probe was ascertained using a manual rack pinion microscope stage (Fig. 1 a). Spectra were acquired with the probe touching the surface of the gel for different angular positions between the detection axis of the probe and the direction of the principal strain of the gel, at 45° intervals (Fig. 2 c). For this the mould with the gel was rotated in the plane perpendicular to the optical probe. At the 0° and 180° positions, light that scattered parallel with the principal strain was detected, and in the 90° and 270° positions backscattered light in perpendicular direction was detected. Three spectra were collected from the same area of the gel for each angular position of the probe. Three separate time course experiments with triplicate gels were performed. In addition, spectra from the δ-zone and the corner zone (Fig. 2 b) of a gel contracted over 72 h were collected for a comparison.
During gel tensile loading, spectra for the orthogonal angles, 0° and 90°, were collected for each consecutive strain value and immediately after the gels were relaxed. In this case, the probe was rotated to achieve different angular positions. Again, three spectra were collected from the same area of the gel for each angular position of the probe.
Data analysis
To characterize the degree of the gel contraction over time, we monitored the width of the gels in the central zone as they contracted and calculated a simple geometric parameter, Dc, as a ratio of the gel width in the central zone at any time point to that at 0 h (Fig. 1 b):
 |
Unprocessed optical spectra were transferred to the PC and analyzed in Excel (Microsoft, Redmond, WA). Spectra were normalized to the source light intensity by dividing by the number of incoming pulses of light. Normalized spectra were then transformed by dividing by the reference spectrum to account for a wavelength-dependent intensity of the light source. Spectra (n = 3) were averaged for each probe position. To characterize the observed changes in backscatter spatial anisotropy (see Results), an “anisotropy factor” (AF) was calculated as the ratio of backscatter intensities for angular positions with maximum, at 90° position, and minimum, at 0° position, values for a particular wavelength, λ:
 |
AF400 and AF700 were calculated for the experiments with the contracting FPCLs. In case of acellular gels only AF400 was used, since the intensity of backscatter was relatively low at longer wavelengths resulting in highly noisy spectra and very variable values of AF700.
Common statistical analysis (mean, standard error, t-test, correlation analysis) was employed to analyze the data using Excel.
RESULTS
Development of the alignment during contraction of fibroblast-populated collagen gels
During analysis of cell-collagen reorganization three well-defined zones of the gel (Eastwood et al., 1998; Mudera et al., 2000) were compared: the central zone, the δ-zone and the corner zone (Fig. 2 b). There was gradual development of aligned matrix in the central zone of gels seen by scanning electron microscopy (Fig. 3). At 0 h cells were round in shape (Fig. 3 a), but as contraction progressed, fibroblasts started to elongate (Fig. 3, b and c) taking on a distinct direction of alignment in the direction, which corresponded to the principal strain in the central zone of the gel, i.e., parallel to the long axis of the gel (previously reported using FEA by Eastwood et al., 1998). As gels contracted they changed their appearance from semitransparent to almost completely opaque (Fig. 1 b), with uniaxially structured matrix in the central zones of the gels (Figs. 1 b and 3 c).
FIGURE 3.
SEM images obtained from the central zones of the gels after 0 h (a), 17 h (b), and 72 h (c) of contraction. Bars correspond to 100 μm. Cells are round before contraction (a), then start to elongate parallel with the direction of stress (arrow, b) and eventually produce an aligned matrix (c).
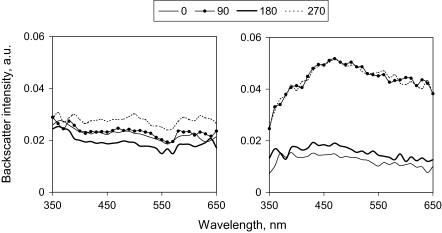
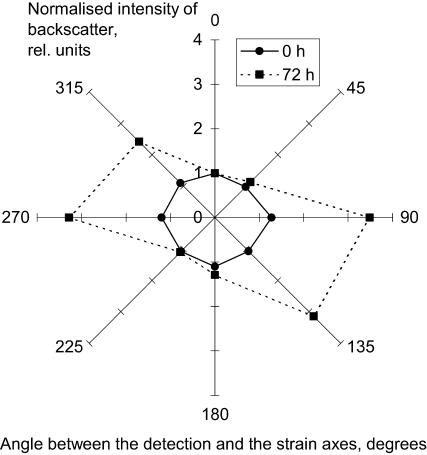
To test the idea that this structural reorganization of the fibroblast-populated collagen gels might be reflected in the spectra of backscattered light, ESS spectra were collected from the central zones at different time points. To obtain spatially resolved spectra of backscattered light the detection axis of the optical probe was aligned at different angles (including parallel) to the principal strain axis in the central part of the gel (Fig. 2 c), where 0° and 180° positions corresponded to the “parallel to the principal strain” and the 90° and 270° to the “perpendicular” positions. Spectra obtained from noncontracted gels with these probe positions were quite uniform in overall intensity (Fig. 4 a). In contrast, the intensity of backscattered light in contracted gels detected perpendicularly to the direction of the principal strain was much higher than that measured in the parallel direction (Fig. 4 b). This backscatter anisotropy observed at 72 h of gel contraction is best visualized in the form of a radial diagram of the intensity of backscattered light (normalized to that at 0° for a direct comparison between different time points). This clearly shows the contrast between the isotropic radial diagram of backscatter at 0 h and the manifesting anisotropy at 72 h (Fig. 5). There was more than threefold increase in the backscatter intensity perpendicular to the principal strain (at 90° and 270° positions) compared with parallel to it (at 0° and 180° positions) at 700 nm, with no significant difference between the orthogonal positions at 0 h.
FIGURE 4.
Spectra of backscattered light, acquired from the central zone of a noncontracted (a) and 72 h contracted (b) fibroblast populated collagen gel. Probe was placed perpendicular to the gel surface and the gel was rotated through all angles between the gel longitudinal and the probe detection axes. At 0° and 180° positions the detection axis of the probe was parallel to the direction of stress, and at 90° and 270° positions it was perpendicular. Each line represents a mean (n = 3) of spectra acquired at the same position of the probe.
FIGURE 5.
Radial diagrams of the intensity of backscattered light at 700 nm from the noncontracted (—•—) and 72 h contracted (- -▪- -) fibroblast populated collagen gels (n = 3).
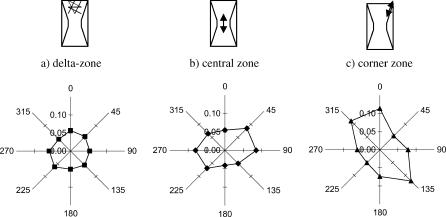
We then tested how well this phenomenon corresponded to the cell/fibril orientation in different zones of contracted gels (Fig. 2 b). It was established that the central, δ- and corner zones of these high aspect ratio gels produce different directions of cell alignment (Eastwood et al., 1998; Mudera et al., 2000). This was parallel with the principal strain in the central zone, almost absent in the δ-zone and ∼45° shifted relative to the axis of gel tethering in the corner zone. Indeed, we found that in a 72 h contracted gel backscatter was isotropic in the δ-zone corresponding to random organization of the matrix, but it was strongly anisotropic in the central and the corner zones indicating matrix alignment (Fig. 6). The direction of the maximal backscatter was perpendicular to the direction of the principal strain in the central zone but it was shifted by ∼45° in the corner zone. These zoned orientations reflect the differences in collagen fibril alignment previously found to develop in such gels (Eastwood et al., 1998).
FIGURE 6.
Radial diagrams of the intensity of backscattered light at 700 nm from different zones of a fibroblast populated collagen gel contracted for 72 h: (a) δ-zone, (b) central zone, and (c) corner zone. Each data point represents mean (n = 3) from spectra acquired at the same position of the probe within the same zone of the gel. Schemes next to each diagram illustrate the zones, from which spectra were taken, indicating actual alignment (if any).
To quantitatively characterize the observed anisotropy of the backscattered light in the contracted gels we calculated AF, anisotropy factor, as a ratio of backscatter intensities detected at orthogonal angles (0° and 90° as indicated in Fig. 2 c) for different wavelengths. When backscatter is isotropic in the studied plane, the ratio of intensities of backscatter at any pair of angular positions of the detection axis of the probe will be unity. This, indeed, was observed for the noncontracted gels, at 0 h, when average AFs were 1.03 ± 0.05 at 400 nm and 0.97 ± 0.09 at 700 nm (mean ± SE, n = 10). In contrast, where the gel produces backscatter anisotropy, the AF will be greater than unity. This was found to be true for the central zone of the gels contracted for 72 h: AF parameter gradually increased with the wavelength from 2.14 ± 0.29 for 400 nm to 3.04 ± 0.48 for 700 nm (n = 3). The difference in the AF values between these wavelengths over the time of contraction was statistically significant (paired t-test, α = 0.01, n = 46). The AF at 400 nm had lower value, but also a relatively lower variability (judged by the standard error), thus being a more reliable parameter, whereas at 700 nm the AF had the highest absolute value and so was a more sensitive indicator of anisotropy. Therefore, for further analysis of the development of backscatter anisotropy we calculated the AFs at 400 nm and 700 nm, termed AF400 and AF700 respectively.
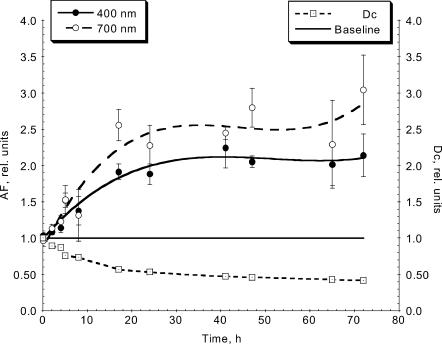
Development of the alignment in the gels during the gel contraction was paralleled by the increased anisotropy of backscattered light detected in the central zones of the gels and shown by both AF400 and AF700 (Fig. 7). The gradual structural changes occurring in the gels with contraction resulted in progressive changes in the anisotropy of backscatter, with over twofold (at 400 nm) and threefold (at 700 nm) more backscattered light detected perpendicular rather than parallel to the direction of the principal strain and the alignment in the central zones of the gels at the end of the gel contraction experiment (72 h). A force profile produced by human dermal fibroblasts in replicate collagen gels over time course in the culture force monitor comprised a rapid increase in force generation over the first period of contraction (up to 40 h), followed by the further increase at reduced rate and eventual force stabilization (observed up to 92 h) and was comparable to that reported previously (Eastwood et al., 1994). We also monitored the width of the gels in the central zone as they contracted and ratioed it to the starting width, thus a simple geometric parameter Dc was calculated to characterize the rate of gel contraction. As backscatter anisotropy increased over 72 h of contraction, Dc more than halved (Fig. 7). There also was a strong positive correlation between the backscatter anisotropy and time of contraction (with correlation coefficients of 0.838 or AF400 and 0.844 for AF700, respectively).
FIGURE 7.
Time course of gel contraction, shown by Dc, width of the gel in the central zone at time points relative to that at 0 h (- -□- -), and the corresponding backscatter anisotropy registered in the same zone of the gel: AF400 (—•—) and AF700 (- -○- -). As gel contracted, Dc decreased mirroring the increase in backscatter anisotropy.
Monitoring of acellular gels under the external tensile loading
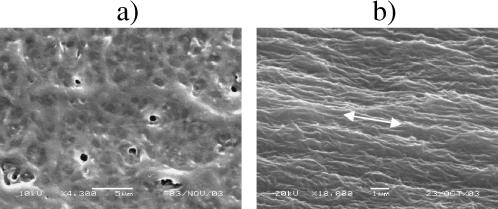
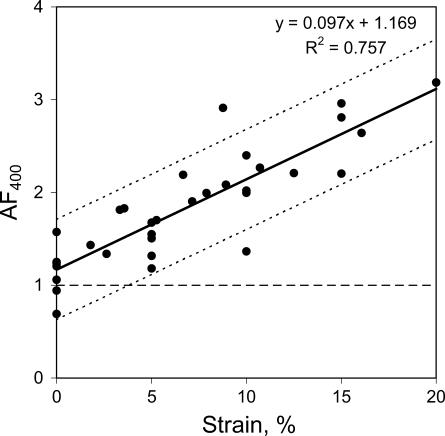
In an additional series of experiments the effects of external uniaxial tensile loading of acellular gels on collagen fibril alignment and backscatter anisotropy was tested. Replicate acellular gels (n = 7) were loaded parallel to their long axis (along the y axis, Fig. 2 a) over a range of measured strain values (0–20%). Backscatter spectra were also collected from the gel central zone with repeat collection immediately after tension was released and the gel had relaxed. Scanning electron microscopy confirmed that the gels had a randomly organized collagen lattice before the loading (Fig. 8 a), and developed a high degree of collagen fibril alignment in the direction of the applied load during the mechanical loading (Fig. 8 b). Backscatter anisotropy, AF400, increased linearly with the strain achieved in the gels (Fig. 9), from 1.22 ± 0.07 (n = 7) at 0% strain to ∼3.11 at 20% strain. The latter value was obtained using the equation of linear regression from the best fit of the data (R2 = 0.757):
 |
There was a strong positive correlation between the optical (AF400) and mechanical (strain) parameters with a correlation coefficient of 0.906.
FIGURE 8.
SEM images obtained from the central zones of acellular gels without (at 0% strain) (a) or with external loading (10% strain). (b) Bars correspond to 5 μm in a and 1 μm in b. The unloaded collagen gel was more hydrated and disorganized in a, whereas after loading the gel was clearly fibrous and aligned in the direction of the applied load indicated by an arrow in b. Small round features in the unstrained gel in a were drying artifacts.
FIGURE 9.
Anisotropy of backscattered light as a function of strain, produced by external tensile loading of acellular gels (n = 7). Dotted lines show 95% confidence intervals.
We also analyzed the values of AF400 at the end of the experiment after removal of tension from the gels, to check for residual alignment. The mean AF400 from such relaxed gels was 1.37 ± 0.10 (n = 7). Though this was slightly greater than that before the tensioning of the same gels, 1.22 ± 0.07 (n = 7), the difference was not statistically significant (α = 0.05, paired t-test). Some initial stretching of the acellular gels occurred during transfer before tensioning (see Methods), resulting in AF400 values slightly higher (1.22 ± 0.07) than the expected unity. In contrast, FPCLs, which were not transferred, had the AF400 of 1.03 ± 0.5 (n = 10).
DISCUSSION
Further progress of tissue engineering, especially translation of the small-scale laboratory research into the industrial production will inevitably depend on the development of reproducible, automated manufacturing processes. This in turn will be conditional on our ability to monitor the progression of the constructs both during in vitro development and after in vivo implantation. Thus it is imperative to identify cost-effective, nondestructive, real-time analytical techniques for the monitoring of tissue-like constructs. Clearly, such techniques must provide information about a range of parameters; perhaps, the most important and least developed is that of tissue structure. The results of this study suggest that ESS fits the requirements well and has a high potential for use in automated bioreactors, for diagnostics (Kostyuk et al., 2004) and monitoring in vivo (postimplantation) or during tissue repair.
Spectra obtained in this study chiefly represented light backscattered from the gels. However there was also some contribution from light reflected from the underlying plastic petri dish. It is known that short-wave visible light penetrates typical biotissues up to 2.5 mm, with long wavelength (NIR) reaching 10 mm deep (Tuchin, 1997). Since the FPCL was not more than 3.7-mm thick and at all stages was far less dense than native biotissue, it is probable that all illuminating wavelengths (320–860 nm) fully penetrated the gel (supported by the visual observation). Clearly then, some light would be reflected from the gel-media-plastic interface below, and so contribute to the collected spectra. However, gel-independent backscatter would be the same for all positions of the probe relative to the gel. Therefore, development of optical (backscatter) anisotropy could only be attributed to structural changes in the gels (caused by contraction or external tensioning).
It is important to understand what structural elements in the gels are responsible for the observed backscatter anisotropy. In our experimental model there are two possible structural contributors: aligned collagen fibrils and aligned fibroblasts in the case of the contracted FPCLs. When collagen gel is set, its matrix comprises a randomly oriented mesh of collagen fibrils. This disorganized network is rearranged both during cell-mediated contraction and the external tensile loading of gels, with the net result of aligned matrix with collagen fibrils having preferential orientation in the direction of the principal strain. When cells are present in the gel (as in FPCLs), they attach to the matrix, start to contract and elongate in the direction of the principal strain. This strain arises from cell movement/contraction, which results in collagen fibril alignment. In this study we established rather similar levels of backscatter anisotropy both in gels contracted by fibroblasts and externally tensioned acellular gels. The latter points out that it is the alignment of collagen fibrils in the gels that was responsible for backscatter anisotropy, since there was no possible cell contribution in case of externally loaded acellular gels.
Backscatter anisotropy increased with duration of contraction or strain. It is also important to note that the plane of backscatter anisotropy was perpendicular to that of the principal mechanical strain and of the collagen fibril alignment. From a theoretical standpoint, the interaction of light with collagen fibrils can be modeled (assuming collagen fibrils to be as infinite cylinders) based on standard electromagnetic theory (Bohren and Huffman, 1983). This predicts that the scattering cross section (which characterizes the amount of scatter) is maximal when light falls perpendicularly to the cylinder axis and zero for light, which travels parallel to this axis. Monte Carlo simulations of partially oriented cylinders (approximating collagen fibers in skin) predicted the backscatter anisotropy (Nickell et al., 2000). It is interesting to note that in that study the direction of the maximal backscatter changed from perpendicular to parallel as the source detector separation increased from 0.3 to 10 mm. Apparently, backscatter anisotropy reflects the structural anisotropy of the matrix, but the exact mode of this relation depends on the degree of the alignment (i.e., proportion of the aligned fibrils), density and size of scatterers relative to wavelength, relative refractive index, and the source-detector separation. As these parameters vary for different systems and experimental setups, the exact relation between the optical (backscatter anisotropy) and structural (direction of alignment) would be expected to be different. Indeed, in the horse tendon, a highly anisotropic tissue, we previously observed maximum backscatter parallel to the longitudinal axis of the tendon (so parallel to collagen fibril alignment) with the same source detector separation (Kostyuk et al., 2004). Different directions of the backscatter anisotropy observed in these two examples of contrasting complexities (simple collagen gel and complex tendon) probably result from the interplay of all parameters, which determine the light interaction with the substrate. For example, a possible mechanism of “light-guiding” by tissue fibers suggested for muscle (Marquez et al., 1998) could play a role in tendons.
Correspondence between the direction of the backscatter anisotropy and the alignment of the matrix once established for the studied system can then be exploited to determine the direction of the alignment/principal strain in tissue-engineered constructs with more complicated geometry. Clearly, it will be possible to use optical anisotropy of ESS where empirical relationships can be identified but preferably these should match the theoretical understanding of the relation between the structures and backscatter. This level of understanding is more likely to come initially from studies on ultra simple “model” tissues such as the 3-D collagen gel system. Anisotropy factor derived in this study is a quantitative parameter, which apparently represents the degree of fibril alignment. It was used to monitor changes at different time points during tissue construct development and in the externally loaded acellular gels. Similar comparisons could be possible between constructs with different cell types, or produced under different combinations of experimental conditions.
There was almost 50% increase in the degree of the backscatter anisotropy as the light wavelength increased, from 400 to 700 nm. This could be explained by relatively higher isotropic contribution from smaller scatterers at shorter wavelength, since there is some proportion of round-shaped scatters present in the gels (noncylindrical collagen and cellular organelles in FPCLs), which then would increase isotropic background scattering partially masking anisotropic scattering caused by the aligned collagen fibrils.
Observed optical anisotropy showed a close correlation with the mechanical parameter, strain, as well as the time of contraction (which in turn was related to the contraction force produced by fibroblasts). A high level of reproducibility between specimens was observed, supporting the idea that ESS is a good candidate technique for use in monitoring strain and structural changes in the tissue-engineered constructs. This is particularly relevant to the provision of cells within the developing connective tissue-engineered constructs with appropriate mechanical cues to guide new tissue formation. Other techniques such as quantitative polarized light microscopy (Tower and Tranquillo, 2001; Thomopoulos et al., 2003) were used to obtain collagen fibrils alignment maps within soft tissues and tissue-like constructs and during mechanical testing of soft tissues (Tower et al., 2002). However the samples had to be positioned onto the microscope stage and studied in the transmitted light. A major advantage of the ESS-based approach is the possibility to assemble an automated computer-controlled monitoring system, with the optical fibers positioned inside the bioreactor, which will rely on the backscattered light. Hence the tissue constructs are spared from any potentially damaging manipulations or infection (i.e., during removal of constructs from the growing chamber for the structural investigation). Even so, we believe that the correlation of ESS with other structural analytical techniques (such as polarized light and transmission electron microscopies, x-ray diffraction) would help to improve the understanding and accuracy of interpretation of spectral signatures.
This is a first report to our knowledge on the quantitative monitoring of the development of the directional organization of cell/collagen architecture in native collagen gels using a nondestructive real-time fiber-optic technique based on elastic scattering spectroscopy. We have identified the interrelation between fibril orientation in the collagen gels and direction of the backscatter anisotropy, which could be used to obtain a “map” of changing fibril alignment in the different zones of a tissue-engineered construct during its development/tensile loading. The high correlation between the degree of alignment of collagen fibrils and backscatter anisotropy provides a sound basis for quantitative monitoring of tissue structural changes.
Acknowledgments
The authors are grateful to Mike Kayser for the technical assistance with scanning electron microscopy; Max Marenzana and David Pickard for assistance with ESS; and Carmelina Ruggiero and Sandy MacRobert for helpful discussions.
Research was supported by the Engineering and Physical Sciences Research Council, UK (GR/R4 3594/01) and European Union “BITES” (Biomechanical Interactions in Tissue Engineering and Surgical Repair) program (QLK3-CT-1999-00559).
References
- Barocas V. H., A. G. Moon, and R. T. Tranquillo. 1995. The fibroblast-populated collagen microsphere assay of cell traction force. Part 2. Measurement of the cell traction parameter. J Biomech. Engr. 117: 161–170. [DOI] [PubMed] [Google Scholar]
- Bell, E., B. Ivarsson, and C. Merrill. 1979. Production of a tissue-like structure by contraction of collagen lattices by human fibroblasts of different proliferation potential in vitro. Proc. Natl. Acad. Sci. USA. 76:1274–1278. [DOI] [PMC free article] [PubMed] [Google Scholar]
- Bigio, I. J., and J. R. Mourant. 1997. Ultraviolet and visible spectroscopies for tissue diagnostics: fluorescence spectroscopy and elastic-scattering spectroscopy. Phys. Med. Biol. 42:803–814. [DOI] [PubMed] [Google Scholar]
- Bohren, C. F., and D. R. Huffman. 1983. Absorption and scattering of light by small particles. Wiley, New York.
- Brown, R. A., R. Prajapati, D. A. McGrouther, I. V. Yannas, and M. Eastwood. 1998. Tensional homeostasis in dermal fibroblasts: mechanical responses to mechanical loading in three-dimensional substrates. J. Cell. Physiol. 175:323–332. [DOI] [PubMed] [Google Scholar]
- Burt, A. M., and D. A. McGrouther. 1992. Production and use of skin cell cultures in therapeutic situations. In Animal Cell Biotechnology, Vol. 5. R. E. Spier, and J. B. Griffiths, editors. Academic Press, New York. 151–68.
- Eastwood, M., D. A. McGrouther, and R. A. Brown. 1994. A culture force monitor for measurement of contraction forces generated in human dermal fibroblast cultures: evidence for cell-matrix mechanical signalling. Biochim. Biophys. Acta. 1201:186–192. [DOI] [PubMed] [Google Scholar]
- Eastwood, M., V. C. Mudera, D. A. McGrouther, and R. A. Brown. 1998. Effect of precise mechanical loading on fibroblast populated collagen lattices: morphological changes. Cell Motil. Cytoskeleton. 40:13–21. [DOI] [PubMed] [Google Scholar]
- Eastwood, M., R. Porter, U. Khan, G. McGrouther, and R. Brown. 1996. Quantitative analysis of collagen gel contractile forces generated by dermal fibroblasts and the relationship to cell morphology. J. Cell. Physiol. 166:33–42. [DOI] [PubMed] [Google Scholar]
- Elsdale, T., and J. Bard. 1972. Collagen substrata for studies on cell behavior. J. Cell Biol. 54:626–637. [DOI] [PMC free article] [PubMed] [Google Scholar]
- Guidry, C., and F. Grinnell. 1985. Studies on the mechanism of hydrated collagen gel reorganization by human skin fibroblasts. J. Cell Sci. 79:67–81. [DOI] [PubMed] [Google Scholar]
- Haringsma, J. 2002. Barrett's oesophagus: new diagnostic and therapeutic techniques. Scand. J. Gastroenterol. Suppl. 236:9–14. [DOI] [PubMed] [Google Scholar]
- Harris, W. A., C. E. Holt, T. A. Smith, and N. Gallenson. 1985. Growth cones of developing retinal cells in vivo, on culture surfaces, and in collagen matrices. J. Neurosci. Res. 13:101–122. [DOI] [PubMed] [Google Scholar]
- Knight, M. M., J. van de Breevaart Bravenboer, D. A. Lee, G. J. V. M. van Osch, H. Weinans, and D. L. Bader. 2002. Cell and nucleus deformation in compressed chondrocyte-alginate constructs: temporal changes and calculation of cell modulus. Biochim. Biophys. Acta. 1570:1–8. [DOI] [PubMed] [Google Scholar]
- Kostyuk, O., H. L. Birch, V. Mudera, and R. A. Brown. 2004. Structural changes in loaded tendons can be monitored by a novel spectroscopic technique. J. Physiol. 554:791–801. [DOI] [PMC free article] [PubMed] [Google Scholar]
- Marenzana, M., D. Pickard, A. J. MacRobert, and R. A. Brown. 2002. Optical measurement of three-dimensional collagen gel constructs by elastic scattering spectroscopy. Tissue Eng. 8:409–418. [DOI] [PubMed] [Google Scholar]
- Marquez, G., L. V. Wang, S. P. Lin, J. A. Schwartz, and S. L. Thomsen. 1998. Anisotropy in the absorption and scattering spectra of chicken breast tissue. Appl. Opt. 37:798–804. [DOI] [PubMed] [Google Scholar]
- Mourant, J. R., T. M. Johnson, S. Carpenter, A. Guerra, T. Aida, and J. P. Freyer. 2002. Polarized angular dependent spectroscopy of epithelial cells and epithelial cell nuclei to determine the size scale of scattering structures. J. Biomed. Opt. 7:378–387. [DOI] [PubMed] [Google Scholar]
- Mudera, V. C., R. Pleass, M. Eastwood, R. Tarnuzzer, G. Schultz, P. Khaw, D. A. McGrouther, and R. A. Brown. 2000. Molecular responses of human dermal fibroblasts to dual cues: contact guidance and mechanical load. Cell Motil. Cytoskeleton. 45:1–9. [DOI] [PubMed] [Google Scholar]
- Nickell, S., M. Hermann, M. Essenpreis, T. J. Farrell, U. Krämer, and M. S. Patterson. 2000. Anisotropy of light propagation in human skin. Phys. Med. Biol. 45:2873–2886. [DOI] [PubMed] [Google Scholar]
- Sethi, K. K., V. Mudera, R. Sutterlin, W. Baschong, and R. A. Brown. 2002. Contraction-mediated pinocytosis of RGD-peptide by dermal fibroblasts: Inhibition of matrix attachment blocks contraction and disrupts microfilament organization. Cell Motil. Cytoskeleton. 52:231–241. [DOI] [PubMed] [Google Scholar]
- Stopak, D., and A. K. Harris. 1982. Connective tissue morphogenesis by fibroblast traction. I. Tissue Culture Observations. Dev. Biol. 90:383–398. [DOI] [PubMed] [Google Scholar]
- Tomasek, J. J., C. J. Haaksma, R. J. Eddy, and M. B. Vaughan. 1992. Fibroblast contraction occurs on release of tension in attached collagen lattices: dependency on an organized actin cytoskeleton and serum. Anat. Rec. 232:359–368. [DOI] [PubMed] [Google Scholar]
- Thomopoulos, S., G. R. Williams, J. A. Gimbel, M. Favata, and L. J. Soslowsky. 2003. Variation of biomechanical, structural, and compositional properties along the tendon to bone insertion site. J. Orthop. Res. 21:413–419. [DOI] [PubMed] [Google Scholar]
- Tower, T. T., M. R. Neidert, and R. T. Tranquillo. 2002. Fiber alignment imaging during mechanical testing of soft tissues. Ann. Biomed. Eng. 30:1221–1233. [DOI] [PubMed] [Google Scholar]
- Tower, T. T., and R. T. Tranquillo. 2001. Alignment maps of tissues: I. Microscopic elliptical polarimetry. Biophys. J. 81:2954–2963. [DOI] [PMC free article] [PubMed] [Google Scholar]
- Tuchin, V. V. 1997. Light scattering study of tissues. Physics—Uspekhi Fizicheskih Nauk. (Russian Academy of Sciences). 40:495–515. [Google Scholar]


