Abstract
The T4 lysozyme enzymatic hydrolyzation reaction of bacterial cell walls is an important biological process, and single-molecule enzymatic reaction dynamics have been studied under physiological condition using purified Escherichia coli cell walls as substrates. Here, we report progress toward characterizing the T4 lysozyme enzymatic reaction on a living bacterial cell wall using a combined single-molecule placement and spectroscopy. Placing a dye-labeled single T4 lysozyme molecule on a targeted bacterial cell wall by using a hydrodynamic microinjection approach, we monitored single-molecule rotational motions during binding, attachment to, and dissociation from the cell wall by tracing single-molecule fluorescence intensity time trajectories and polarization. The single-molecule attachment duration of the T4 lysozyme to the cell wall during enzymatic reactions was typically shorter than the photobleaching time under physiological conditions. Applying single-molecule fluorescence polarization measurements to characterize the binding and motions of the T4 lysozyme molecules, we observed that the motions of wild-type and mutant T4 lysozyme proteins are essentially the same whether under an enzymatic reaction or not. The changing of the fluorescence polarization suggests that the motions of the T4 lysozyme are associated with orientational rotations. This observation also suggests that the T4 lysozyme binding-unbinding motions on cell walls involve a complex mechanism beyond a single-step first-order rate process.
INTRODUCTION
Proteins in living cells play important roles in biological functions and often involve complex dynamics. The complexity comes from both spatial and temporal inhomogeneities that are extremely difficult to characterize in conventional ensemble-averaged experiments. Many protein processes, such as enzymatic reactions, are nonsynchronizable in an ensemble-averaged experiment. However, methods that allow studying one molecule at a time and probing the single-molecule time trajectories prove to be powerful in dissecting complex protein dynamics. In this article, we characterize an unperturbed single T4 lysozyme for an extended period of time, i.e., under physiological conditions, on a cell wall during an enzymatic reaction.
The major challenge in conducting studies of single-molecule dynamics of complex enzymatic reactions in living cells is the autofluorescence background generated by the cells under laser excitation. Although the use of red fluorescence dye and red excitation suppresses autofluorescence, this approach sometimes involves such unfavorable experimental difficulties as fast photobleaching and low quantum yield. Nevertheless, single-molecule spectroscopy is useful and promising for uncovering enzymatic reactions on the cell walls or membranes where the density of the fluorescent proteins is low.
There have been a considerable number of single-molecule spectroscopic studies of proteins and DNA under physiological conditions, and the techniques used typically have trade off between the control of molecules and the duration of detection (Edman et al., 1999; Lu et al., 1998, 2001; Yasuda et al., 2001; Zhuang et al., 2000). One strategy has been to immobilize a protein or DNA by covalent tethering to a solid surface or by spatially confining within a gel to limit translational diffusion (Chen et al., 2003; Dickson et al., 1996; Edman et al., 1999; Hu and Lu, 2003; Lu et al., 1998, 2001; Yasuda et al., 2001; Zhuang et al., 2000). Another strategy has been to allow the free diffusion of the biomolecules in solution and to monitor fluorescence bursts at the excitation focal point (Bjorling et al., 1998; Enderlein et al., 1997; Fries et al., 1998; Yeung and Xu, 1997). These approaches have both advantages and disadvantages. Immobilizing molecules allows fluorescence intensity trajectory recording for longer periods but introduces artificial restrictions on the molecules, which may perturb protein activities. On the other hand, fluorescence burst analysis enables studies on single molecules under physiological conditions but gives only scrambled fluorescence photons from each molecule that are detected in a transient period. Typically, no time trajectories can be directly recorded in such analysis. This article demonstrates, to our knowledge, a novel method to study single enzyme molecules on a cell wall by placing single molecules one at a time, while still obtaining longer recording times of single-molecule fluorescence trajectories. Although similar attempts at single-molecule placings and printings have been previously reported (Renault et al., 2003; Ying et al., 2002), this article presents a different technical approach to nanoliter hydrodynamic injection. Nevertheless, our focus is on the application of our combined single-molecule placing and spectroscopy approaches to study single-molecule enzyme motions and enzymatic interactions.
T4 lysozyme is one of the lysozyme family enzymes produced by bacteriophage T4 (Matthews et al., 1981). It can attach and bind to cell walls and kill a cell by catalyzing the hydrolysis of cell wall peptidoglycan. The complex mechanism and inhomogeneous dynamics of enzyme-cell wall binding interactions, association and dissociation, and enzyme diffusion motions in the enzymatic reaction process are still largely unknown. For example, the knowledge is still insufficient about how the T4 lysozyme efficiently hydrolyzes a cell wall, which is a covalently bonded polymer network with a heterogeneous structure and inhomogeneous electrostatic distribution.
MATERIALS AND METHODS
The wild-type T4 lysozyme and its mutant E11A were kindly provided by Prof. Brian Matthews from the University of Oregon. T4 lysozyme proteins have two Cys groups that are available in dye conjugation through thiolations. We labeled the wild-type and mutant T4 lysozyme proteins with Alexa Fluor 488 C5 maleimide (Molecular Probes, Eugene, OR) by using the standard protocol from Molecular Probes. The reaction yield was controlled as a low yield so that the double labeling was insignificant. The dye Alexa 488 was covalently linked either to Cys-54 or Cys-97. The dye-labeled T4 lysozyme remains active. A solution of 10−7 M dye-labeled T4 lysozyme can digest the cell wall solution (A400 = 0.4) within 1 min.
The enzyme substrate was prepared from lyophilized Escherichia coli cell strain B (Sigma, St. Louis, MO). The cell walls were treated with sodium dodecylsulfate solution according to published procedures (Becktel and Baase, 1985). The treated solution contained a particle suspension of peptidoglycan, which is the major component of the E. coli B cell wall, ready for enzymatic hydrolysis reactions. The cell wall substrates formed particles (less than 1-μm diameter) in solution. A clean glass coverslip first was incubated with 0.01% poly-L-lysine solution for 5 min and then incubated with E. coli B suspension solution for 5 min. The E. coli B cell wall was immobilized on a glass surface under water by electrostatic interactions between the cell walls and poly-L-lysine. We observed under optical microscope that the E. coli B cell wall on a glass surface can be completely digested under a wild-type T4 lysozyme solution, which indicated that the T4 lysozyme remains active on immobilized cell walls.
Glass pipettes were made from borosilicate glass tubing (World Precision Instruments, Sarasota, FL), pulled by a puller (Sutter Instrument, model P-2000, Novato, CA). The tip diameter was ∼0.3 μm, measured by scanning electron microscopy. The pipettes were filled with T4 lysozyme solution. A picoliter injector (Harvard/Medical Systems PLI-100, Holliston, MA) was used to inject a controlled volume of solution to a cell wall substrate on a glass surface. The pipette was mounted on a micromanipulator (Burleigh PCS5000, Victor, NY). The cell walls and pipette tip were submerged in phosphate-buffered saline buffer solution. A single-molecule fluorescence confocal microscope was used to study the fluorescence from single T4 lysozyme molecules. The optical setup of the microscope is described in detail elsewhere (Chen et al., 2003; Hu and Lu, 2003). The fluorescence intensity recording was synchronized with the picoliter injector using a homemade electronic device.
RESULTS AND DISCUSSION
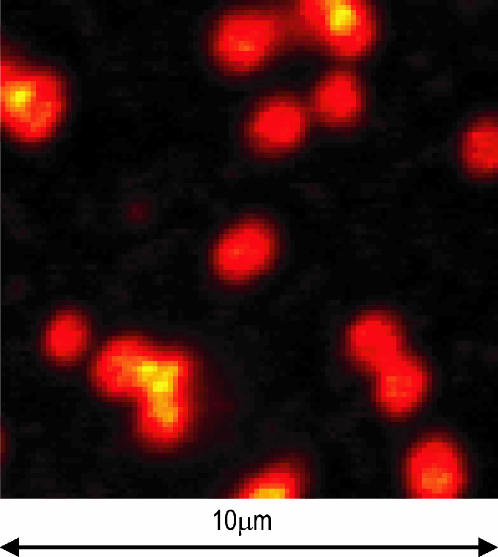
Fig. 1 shows a fluorescence image of E. coli cell walls on a glass surface under a 3- × 10−9-M solution of the Alexa 488 labeled T4 lysozyme mutant E11A. Mutant E11A binds to cell walls but does not catalyze the hydrolysis reaction (Shoichet et al., 1995), which allowed recording of fluorescence images for a period of a few minutes on a nondegrading cell wall. The cell walls were essentially free of autofluorescence and further treated by prephotobleaching before the control imaging experiments. The fluorescence intensity from Alexa 488 was much stronger than the residue fluorescence background from the cell walls. The image (Fig. 1) shows that the cell walls gave significantly higher fluorescence intensity than either from solution or a glass surface. Excess Alexa 488 labeled E11A proteins attached to the cell walls by interaction affinity, so that the concentration of the enzyme on the cell walls is much higher than the concentration in solution and on the glass surface. The high affinity of the T4 lysozyme enzyme for the cell wall (Tsugita et al., 1968) is understandable in that the T4 lysozyme catalyzes the hydrolysis of cell walls. Our imaging experiments also showed that the Alexa 488 labeled wild-type T4 lysozyme showed similar binding behavior on cell walls. Indeed, cell wall size is typically observed to decrease over the time under assay conditions because a hydrolysis reaction is catalyzed by the wild-type T4 lysozyme.
FIGURE 1.
A far-field fluorescence image of the cell wall immobilized on a glass surface in 3 × 10⁻⁹ M E11A-Alexa 488 solution. The fluorescence intensity on the cell walls is significantly higher than that in the solution and glass surface background, which reflects higher density of the dye-labeled T4 lysozymes on the cell walls.
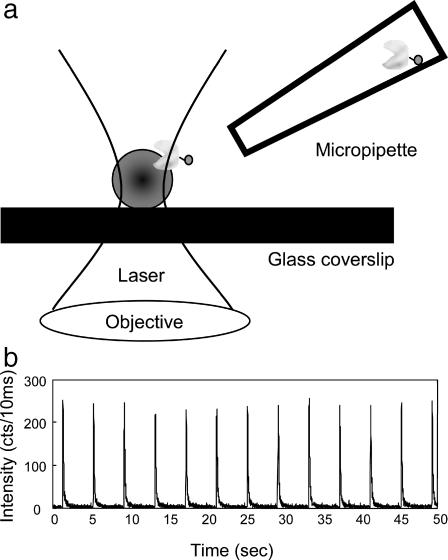
We used a hydrodynamic nanoliter liquid injection technique using a micropipette. The tip was placed 2∼3 μm from the laser focal point (Fig. 2 A) where a cell wall piece was imaged. The tip was translated by a micromanipulator with high precision. Both the tip and the cell wall can be observed from the microscope. A small volume of Alexa 488 solution (10−5 M) at a few nanoliters was injected and delivered to the laser focal point every 4 s. A typical fluorescence intensity time trajectory is shown in Fig. 2 B. There was an ∼40-ms delay between the electronic signal to trigger the injection and the time that the injected nanoliter-volume pulse of Alexa 488 solution reached the focal point of the laser excitation. The time delay was due both to the time required for the injected-solution hydrodynamic float and the mechanical response of the injector.
FIGURE 2.
(A) Experiment setup. The E. coli cell walls were immobilized on a clean coverslip. The excitation laser was focused on the cell wall. A glass micropipette filled with enzyme solution was placed near the cell on the focal point by a micromanipulator. The solution in the micropipette was injected by a picoliter injector. (B) The fluorescence time trajectory of injecting 10−5 M Alexa 488 into the laser focal point for a duration of 20 ms. The counting dwell time of the trajectory was 10 ms.
The stable and repeatable fluorescence peak intensity of the injections (Fig. 2 B) indicates that this was an effective method to deliver molecules to a specific cell wall at the laser excitation focal point. The fluorescence intensity trajectory presents the time-dependent probability of the solute molecules in the pipette reaching the focal point of the laser excitation. This is an important measurable parameter to distinguish between the molecules coming from the injection pipette and the existing molecules in solution. The duration of the fluorescence peaks is below 100 ms, which is due to the duration of the pressure pulse from the injector (20 ms) and the dissipation rate of the solute molecules in solution. In a single-molecule placing experiment, we applied the same injection and placing technique, and the experimental conditions remain the same except using a 10−8-M concentration of the solution.
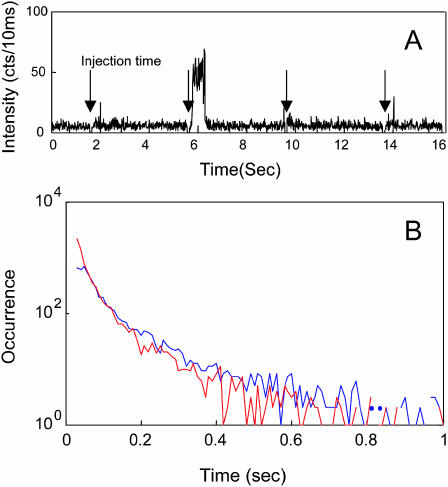
T4 lysozyme delivery and binding to cell walls were observed by fluorescence trajectories. By controlling the injection volume and concentration of the solution, less than one molecule attaches to the cell wall resulting from each injection pulse. With the laser focused on a portion of the cell wall, the fluorescence from the focal point is detected by avalanche photodiodes (APD) that are gated off immediately before the injection, giving a tag of the injection time. Fig. 3 A shows that the fluorescence intensity jumped to a higher level once a T4 lysozyme was delivered and bound to the cell wall after the injection pulse, and that the intensity dropped back to the background level after the molecule was photobleached or detached from the cell wall. This discrete, digitized intensity peak is due to the single event of a T4 lysozyme molecule binding to the cell wall. In our single-molecule imaging experiments, autofluorescence from the cell wall was minimal because, before the injection sequence began, the cell wall was prephotobleached by a laser with 100× stronger power over a period of minutes. Two control experiments confirmed that the fluorescence peaks in the trajectories were due to the T4 lysozyme molecule placing from the injections: 1), injecting T4 lysozyme to the glass surface without an E. coli cell wall and 2), monitoring the fluorescence intensity from the cell walls without placing T4 lysozyme. Neither of the measurements showed fluorescence intensity peaks.
FIGURE 3.
(A) A segment of a typical fluorescence time trajectory of the injecting of 10−8 M wild-type-Alexa 488 to a cell wall. Injection occurred every 4 s. (B) The histogram of the fluorescence peak duration of the trajectories. The blue is mutant E11A, and the red is wild type.
We attribute the fluorescence intensity peaks to single molecules because they are quantized and drop to the background level in one step (Fig. 3 A) and because their intensity levels are similar to the intensity of immobilized single T4 lysozymes on a glass surface (Hu and Lu, 2003). Furthermore, the peaks are more likely to be observed immediately after injection as opposed to a random time after injection. The probability profile, which is similar to that in Fig. 2 B, suggests that the fluorescent molecules are from the injection pulse and not from existing molecules on the cell wall or surrounding solution. The intensity peaks start from an abrupt jump of the intensity level to high and end with an abrupt jump to the low level within one trajectory bin time (10 ms). The process of coming and leaving of the single molecules, which would give a gradual increase and decrease of the fluorescence intensity, is not observed because the diffusion time of a free molecule in solution in a cross section of the laser focal point is typically below 1 ms (Bjorling et al., 1998; Fries et al., 1998), whereas the fluorescence time trajectories were recorded using a 10-ms bin time. Free diffusing molecules give minimal fluorescence signal barely above the background for each injection event. The fluorescence can be only observed after averaging many injection events. Both with and without cell wall, this fluorescence signal can be observed and its trajectory is similar to Fig. 2 B. The reason that the free diffusing molecules give a very low intensity in the single-molecule placing experiments is that the concentration of the solution is much lower than that in Fig. 2 B. In the single-molecule placing experiments, not every injection pulse gives a fluorescence intensity peak because the concentration of the injection solution is kept low to make sure no more than one molecule binds to the cell wall for an individual injection pulse. Based on the injection pressure and pulse duration, tip diameter, and solution concentration, we estimate ∼4200 molecules were injected in each pulse. However, most molecules in the injection pulse flow away so that they would not be able to bind to or even collide with the cell wall. Typically, the ratio of the single-molecule placing is 1 out of 3∼10 injection pulses. The distance between the pipette tip and the cell wall affects the percentage of molecules binding to the cell wall. A closer distance should give more efficient binding. However, a closer distance between the cell wall and the tip gives higher fluorescence background in the single-molecule detection because the tip is filled with a solution of Alexa 488 labeled T4 lysozyme. We choose the distance of 2∼3 μm based on the compromise of the binding efficiency and fluorescence background.
The fluorescence peak duration is related to the photobleaching and detachment rates of T4 lysozyme molecules. Since the fluorescence peak intensity of the T4 lysozyme immobilized on a glass surface shows a longer duration of several seconds (Hu and Lu, 2003), the shorter peak durations of the single T4 lysozyme molecule fluorescence peaks on a cell wall are most likely not limited by photobleaching. Therefore, fluorescence intensity peak durations of the time of T4 lysozyme attached to the cell wall are mainly limited by the disassociation rate of the T4 lysozyme from the cell wall substrates. The histogram of peak duration is shown in Fig. 3 B. For wild-type T4 lyoszyme, the peak duration curve is fitted to a biexponential decay time of 27 ± 5 ms (99%) and 250 ± 50 ms (1%). Although the slow component is only 1% of the amplitude, it cannot be ignored because the long peaks reflect long durations of the T4 lysozyme single molecules binding to cell walls. Therefore, they are biologically significant and contribute to the enzymatic reaction activity. Some of the short-duration peaks might be due to the single-molecule fluorescence blinking that makes one single-molecule binding duration peak separated to many segments. At this stage, we cannot definitively distinguish single-molecule fluorescence blinking from fluorescence changes due to short-lived single-molecule binding to cell walls. The possibility of two or more molecules forming one peak trajectory is very low. As discussed above, the ratio of placing a single molecule to the injection pulse is kept low to reduce the event of placing two molecules at one injection pulse. Furthermore, the possibility of binding of free diffusing T4 lysozyme in solution environment is low because the concentration of free T4 lysozyme from previous injection pulses is extremely low. We observed that there are basically no intensity peaks after injection sequence stopped. For mutant E11A, the peak duration curve is fitted to biexponentially at 28 ± 5 ms (95%) and 140 ± 30 ms (5%). The biexponential time constants suggest that the interactions between the cell wall and the placed T4 lysozyme single molecules are inhomogeneous. This is expected because the polymer network structure of a cell wall is intrinsically inhomogeneous, especially when the cell wall is under a hydrolysis reaction.
Two types of T4 lysozyme bindings to cell walls are possible: 1), nonspecific attachment and 2), chemical binding associated with the hydrolysis reaction. Events indicated by the fluorescence intensity dropping to background level are associated with T4 lysozyme diffusing away from the cell wall. When the T4 lysozyme attached to the cell wall, many enzymatic reaction turnovers likely occurred; in experiments, we have observed that the cell wall typically shrinks and eventually disappears from the imaging field of view (Chen et al., 2003).
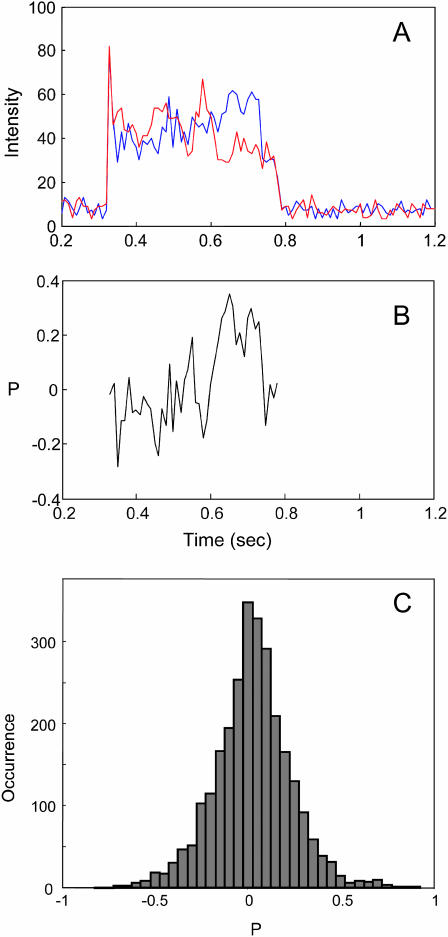
To characterize the binding and the motions of the placed single T4 lysozyme molecules on cell walls, we used single-molecule fluorescence polarization measurements. Single-molecule fluorescence anisotropy has a wide range of applications in probing rotational dynamics (Ha et al., 1999; Harms et al., 1999; Schütz et al., 1997). The orientation of the single-molecule transition dipole can be probed by either linear polarized excitation or linear polarized emission. In this work, the excitation light polarization was scrambled by optics so that all polarization orientations have the same intensity. The emission was split into orthogonal (I1 and I2) polarizations and detected by two APDs (Hu and Lu, 2003). The intensity trajectories probed at the two orthogonal polarizations are shown in Fig. 4 A. The polarization P is defined as
 |
FIGURE 4.
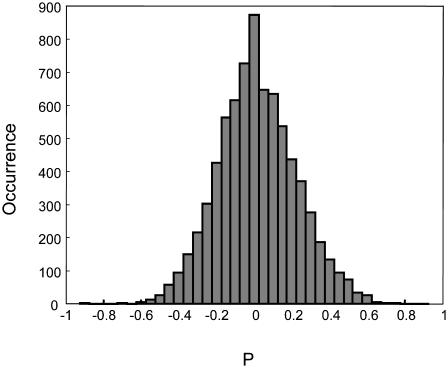
(A) The fluorescence intensity trajectory of the two polarization components, (B) the polarization trajectory, and (C) the histogram of polarization. The data are from one E. coli cell wall and many single-molecule trajectories, including the trajectory shown in B and other trajectories not shown.
If the rotation time is much longer than the fluorescence intensity averaging time, P can be used to determine the orientation of the transition dipole within an accessible space. Possible P values are from −1 to 1 (Harms et al., 1999; Schmidt et al., 1996). The time trajectory of P corresponds to the orientation motion of the single molecule. On the other hand, if the rotation time is much shorter than the fluorescence intensity averaging time, P = 0 and the distribution of P is a spike at 0. Due to shot noise, the spike is broadened to a peak centered at 0 (Boukobza et al., 2001). The width of the distribution depends on the average counts of I1 and I2. We estimated that for an averaged 50 counts on each APD detector, the shot noise gives the standard deviation of ∼0.1 in P, corresponding to the distribution peak width ∼0.2 at half-maximum, which is narrower than the peak shown in Fig. 4 C. Therefore, the possibility of the T4 lysozyme orientation rotation being faster than 5 ms bin time in the fluorescence intensity collection was ruled out, suggesting that T4 lysozyme did not freely rotate on the cell wall. Furthermore, the trajectory of P in Fig. 4 B showed a slow change with time, which corresponds to a slow rotation of the single-molecule orientation. The Alexa 488 dye labeled on the T4 lysozyme had a wobbling motion in a ∼10-ns timescale. This wobbling motion reduced P toward 0 (Hu and Lu, 2003), and, therefore, the P distribution was narrower than that for fixed molecules of from −1 to 1. On the other hand, the wobbling also made it difficult to calculate the accessible orientation-angle space of the T4 lysozyme (Ha et al., 1998).
Mutant E11A showed a similar P distribution (Fig. 5), which strongly suggests that the motion of wild-type and mutant T4 lysozyme proteins are essentially the same whether or not there is an enzymatic reaction. It is most likely that the electrostatic interactions and the binding-unbinding motions determined the motions of the enzymes on a cell wall surface. This is consistent with our previous findings that the binding-unbinding motions of the enzyme dominate the interaction time of the proteins and the cell walls (Chen et al., 2003).
FIGURE 5.
The histogram of polarization of T4 lysozyme mutant E11A on a cell wall. The data are from one E. coli cell and many single-molecule trajectories.
The changing of P during high levels of fluorescence intensity suggests that the motions of the T4 lysozyme are associated with orientational rotations (Fig. 4, A and B). Although the T4 lysozyme molecule was attached to the cell wall for more than 0.4 s, it has rotational freedom within this time period. It is likely that within one apparent binding event, the enzyme has done multiple reactions in multiple sites on the cell wall. This observation is consistent with our previous findings that the dynamics of enzyme-substrate interactions that form complexes with polysaccharides in cell walls involves both the attachment of the T4 lysozyme and the binding for an enzymatic reaction (Chen et al., 2003).
We have demonstrated a new approach to probing an enzyme-substrate interaction on cell walls at a single-molecule level and a significant step toward eventually studying single-molecule enzymatic reactions in living cells. We were able to inject, deliver, and place single enzyme molecules onto the cell walls and probe their attachment, detachment, and rotational motions under biologically unperturbed conditions. The rate-determining conformational motions are the binding-unbinding motions of the enzyme proteins; the dynamics of the motions are complex and inhomogeneous.
The primary advantage of this approach is that it uses an immobilized single-molecule enzyme under laser confocal excitation without any biologically nonnative artificial tethering or immobilization. Although lyophilized cell walls were used in our experiments, the technical approaches developed in this work can be potentially applied to study single-molecule dynamics in living cells. We are currently probing single-molecule fluorescence resonance energy transfer to characterize the conformational motions of donor-acceptor labeled T4 lysozyme proteins on cell walls under enzymatic hydrolysis reactions.
Acknowledgments
We thank Brian Matthews for providing us with T4 lysozyme proteins and Miodrag Micic for scanning electron microscopy measurement of pipette tip aperture size.
This work was supported by the Laboratory-Directed Research and Development Program of Pacific Northwest National Laboratory, operated for the U.S. Department of Energy by Battelle Memorial Institute, and by the Chemical Sciences Division of the Office of Basic Energy Sciences within the Office of Energy Research of the U.S. Department of Energy.
References
- Becktel, W. J., and W. A. Baase. 1985. A lysoplate assay for Escherichia coli cell wall active enzymes. Anal. Biochem. 150:258–263. [DOI] [PubMed] [Google Scholar]
- Bjorling, S., M. Kinjo, Z. Foldespapp, E. Hagman, P. Thyberg, and R. Rigler. 1998. Fluorescence correlation spectroscopy of enzymatic DNA polymerization. Biochemistry. 37:12971–12978. [DOI] [PubMed] [Google Scholar]
- Boukobza, E., A. Sonnenfeld, and G. Haran. 2001. Immobilization in surface-tethered lipid vesicles as a new tool for single biomolecule spectroscopy. J. Phys. Chem. B. 105:12165–12170. [Google Scholar]
- Chen, Y., D. Hu, E. R. Vorpagel, and H. P. Lu. 2003. Probing single-molecule T4 lysozyme conformational dynamics by intramolecular fluorescence energy transfer. J. Phys. Chem. B. 107:7947–7956. [Google Scholar]
- Dickson, R. M., D. J. Norris, Y. L. Tzeng, and W. E. Moerner. 1996. Three-dimensional imaging of single molecules solvated in pores of poly(acrylamide) gels. Science. 274:966–969. [DOI] [PubMed] [Google Scholar]
- Edman, L., Z. Foldes-Papp, S. Wennmalm, and R. Rigler. 1999. The fluctuating enzyme: a single molecule approach. Chem. Phys. 247:11–22. [Google Scholar]
- Enderlein, J., D. L. Robbins, W. P. Ambrose, P. M. Goodwin, and R. A. Keller. 1997. Statistics of single-molecule detection. J. Phys. Chem. B. 101:3626–3632. [Google Scholar]
- Fries, J. R., L. Brand, C. Eggeling, M. Kollner, and C. A. M. Seidel. 1998. Quantitative identification of different single molecules by selective time-resolved confocal fluorescence spectroscopy. J. Phys. Chem. A. 102:6601–6613. [Google Scholar]
- Ha, T., J. Glass, T. Enderle, D. S. Chemla, and S. Weiss. 1998. Hindered rotational diffusion and rotational jumps of single molecules. Phys. Rev. Lett. 80:2093–2096. [Google Scholar]
- Ha, T., T. A. Laurence, D. S. Chemla, and S. Weiss. 1999. Polarization spectroscopy of single fluorescent molecules. J. Phys. Chem. B. 103:6839–6850. [Google Scholar]
- Harms, G. S., M. Sonnleitner, G. J. Schütz, H. J. Gruber, and T. Schmidt. 1999. Single-molecule anisotropy imaging. Biophys. J. 77:2864–2870. [DOI] [PMC free article] [PubMed] [Google Scholar]
- Hu, D., and H. P. Lu. 2003. Single-molecule nanosecond anisotropy dynamics of tethered protein motions. J. Phys. Chem. B. 107:618–626. [Google Scholar]
- Lu, H. P., L. M. Iakoucheva, and E. J. Ackerman. 2001. Single-molecule conformational dynamics of fluctuating noncovalent DNA-protein interactions in DNA damage recognition. J. Am. Chem. Soc. 123:9184–9185. [DOI] [PubMed] [Google Scholar]
- Lu, H. P., L. Y. Xun, and X. S. Xie. 1998. Single-molecule enzymatic dynamics. Science. 282:1877–1882. [DOI] [PubMed] [Google Scholar]
- Matthews, B. W., S. J. Remington, M. G. Grutter, and W. F. Anderson. 1981. Relation between hen egg white lysozyme and bacteriophage T4 lysozyme: evolutionary implications. J. Mol. Biol. 147:545–558. [DOI] [PubMed] [Google Scholar]
- Renault, J. P., A. Bernard, A. Bietsch, B. Michel, H. R. Bosshard, E. Delamarche, M. Kreiter, B. Hecht, and U. P. Wild. 2003. Fabricating arrays of single protein molecules on glass using microcontact printing. J. Phys. Chem. B. 107:703–711. [Google Scholar]
- Schmidt, T., G. J. Schütz, H. J. Gruber, and H. Schindler. 1996. Local stoichiometries determined by counting individual molecules. Anal. Chem. 68:4397–4401. [Google Scholar]
- Schütz, G. J., H. Schindler, and T. Schmidt. 1997. Imaging single-molecule dichroism. Opt. Lett. 22:651–653. [DOI] [PubMed] [Google Scholar]
- Shoichet, B. K., W. A. Baase, R. Kuroki, and B. W. Matthews. 1995. A relationship between protein stability and protein function. Proc. Natl. Acad. Sci. USA. 92:452–456. [DOI] [PMC free article] [PubMed] [Google Scholar]
- Tsugita, A., M. Inouye, E. Terzaghi, and G. Streisinger. 1968. Purification of bacteriophage T4 lysozyme. J. Biol. Chem. 243:391–397. [PubMed] [Google Scholar]
- Yasuda, R., H. Noji, M. Yoshida, K. Kinosita, Jr., and H. Itoh. 2001. Resolution of distinct rotational substeps by submillisecond kinetic analysis of F1-ATPase. Nature. 410:898–904. [DOI] [PubMed] [Google Scholar]
- Yeung, E. S., and X.-H. Xu. 1997. Direct measurement of single-molecule diffusion and photodecomposition in free solution. Science. 275:1106–1109. [DOI] [PubMed] [Google Scholar]
- Ying, L. M., A. Bruckbauer, A. M. Rothery, Y. E. Korchev, and D. Klenerman. 2002. Programmable delivery of DNA through a nanopipet. Anal. Chem. 74:1380–1385. [DOI] [PubMed] [Google Scholar]
- Zhuang, X. W., L. E. Bartley, H. P. Babcock, R. Russell, T. J. Ha, D. Herschlag, and S. Chu. 2000. A single-molecule study of RNA catalysis and folding. Science. 288:2048–2051. [DOI] [PubMed] [Google Scholar]


