Abstract
An experimental verification of an optical microscope technique to create spatial map images of dynamically scattered light fluctuation decay rates is presented. The dynamic light scattering microscopy technique is demonstrated on polystyrene beads and living macrophage cells. With a slow progressive scan charge-coupled device camera employed in a streak-like mode, rapid intensity fluctuations with timescales the order of milliseconds can be recorded from these samples. From such streak images, the autocorrelation function of these fluctuations can be computed at each location in the sample. The characteristic decay times of the autocorrelation functions report the rates of motion of scattering centers. These rates show reasonable agreement to theoretically expected values for known samples with good signal/noise ratio. The rates can be used to construct an image-like spatial map of the rapidity of submicroscopic motions of scattering centers.
INTRODUCTION
In the accompanying article (Dzakpasu and Axelrod, 2004, abbreviated “TH” for Theory), we present the theoretical background for dynamic light scattering microscopy (DLSM) to create spatial maps of the rates of motion of scattering centers. Here we present an experimental verification of the DLSM technique, including descriptions of a detection system that uses a slow scan (a few Hz exposure rate) charge-coupled device (CCD) to record the rapid (kHz range) fluctuations of DLS, and tests on both a model system (small polystyrene beads in suspension) and a living cell system (macrophages). The goal of the tests on macrophages is not to answer any particular biological question at this point, but rather to verify the applicability of DLSM to cell biological systems.
DLSM in its present form is chemically nonspecific, as are dark field, phase contrast, and differential interference contrast. Unlike those techniques that detect spatial but temporally static variations in local refractive index, DLSM detects temporally dynamic variations in a spatially resolved format. We discuss possible extensions of the technique that might increase its chemical specificity while preserving its ability to detect rapid motions in submicroscopic regions.
EXPERIMENTAL DESIGN
Optical setup
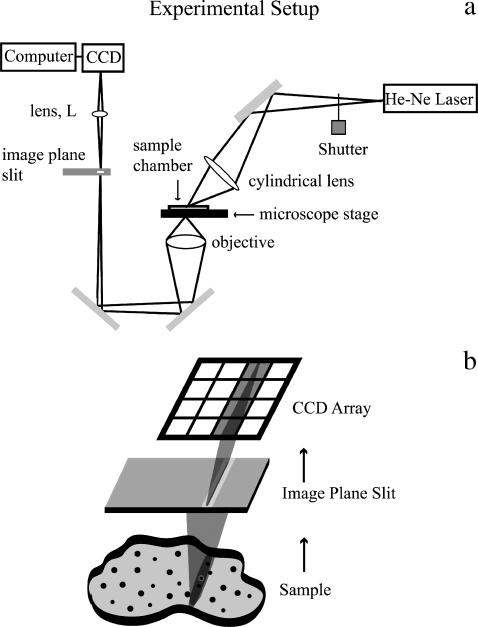
Light from a CW helium neon laser (15 mW, 632.8 nm) was focused through an 8-mm focal length cylindrical lens and propagated down toward the sample (at ∼60° from the vertical) such that the direct incident light missed the objective (Fig. 1 a). The resulting illumination region was a thin-line, 2-μm full-width at half-maximum, and oriented so that the stripe was in the plane of incidence.
FIGURE 1.
Schematic drawing of experimental setup. (a) A cylindrical lens focuses the beam from a He-Ne laser to create a thin stripe of illumination (oriented in the page plane here) on the sample. A motorized stage controls the motion of the sample and the sample is moved in the x direction only (normal to the page plane). A 32×, 0.4 NA objective gathers the scattered light from the sample and focuses it onto a 5-μm-wide slit placed in the image plane and oriented in the direction of the illumination stripe. A lens (L) reimages the slit onto the face of a CCD camera without additional magnification. The resolution limit of the slit image cast upon the CCD camera was calculated to be on the order of one-quarter of the width of a column of pixels. Therefore, the image of the slit is reasonably sharp. (b) Detail of the imaging on the CCD array, with lenses omitted from the drawing. The slit excludes out-of-focus light and creates a well-defined focused line of scattered illumination that gets mapped onto a single column of the CCD camera array. The other columns of the CCD camera array are not illuminated.
A Leitz Diavert inverted microscope with a 0.4 NA, 32×, long working distance objective (Leitz, Jena, Germany) collected the scattered light from the sample. The objective focused the scattered light at an image plane above the microscope at which a 5-μm-wide slit was located. Lens L in the path between the image plane and the face of the CCD camera refocused the scattered light and image plane slit onto the CCD array of a digital camera with no additional magnification. The image plane slit served to select a clean-edged line of scattered light that illuminated only a single column of pixels in the CCD camera (Fig. 1 b). The image plane slit also created a confocal-like effect, reducing the out-of-focus light at the camera.
The sample chamber containing either cells or beads (see below) was placed on a motorized stage (Maerzhaeuser, Wetzlar, Germany) that could be translated stepwise in the direction transverse to the illumination stripe.
Emission path filters (Chroma Technology, Brattleboro, VT) were chosen depending upon whether light scattering (for DLSM experiments) or fluorescence (for number fluctuation experiments) was performed. For DLSM, a 632 ± 10 nm narrow bandwidth filter was used. For the number fluctuation experiments, a longpass 650-nm filter was used to block scattered excitation light and transmit fluorescence from dye-labeled beads.
Data acquisition
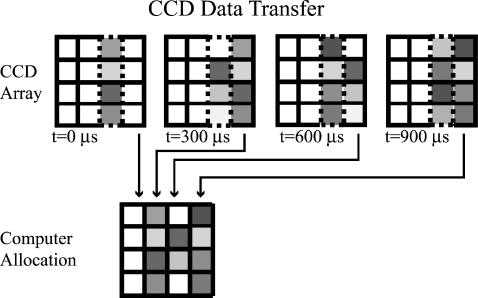
During an image acquisition period, the camera shutter remained open. The progressive scan cooled CCD camera (Pentamax KAF-1400, Roper Scientific, Trenton, NJ, pixel size 6.8 × 6.8 μm) reads out data column-by-column such that the intensities recorded in each pixel column shifts one column (Fig. 2) every 300 μs. The shifting continues until the full frame of the CCD array is read. Therefore, each pixel along the column of illumination formed by the image plane slit in our optical setup gave rise to a temporal streak of intensity fluctuations with a “bin time” of 300 μs.
FIGURE 2.
Schematic of CCD readout mechanism. The dashed outline rectangle represents the column of the CCD array that is constantly exposed to the scattered light. The CCD array readout shift register is represented by the column of pixels at the extreme right. (Between the illuminated columns and the shift register, there may be intermediate columns but these are not shown.) The (progressive scan) camera is operated in its normal readout mode, except with the camera shutter always open. At the end of every 300-μs interval, accumulated intensity data in the illuminated column of pixels is advanced rightward column-by-column toward the shift register. At the same time, blank counts from the pixel columns to the left are shifted into the illuminated column, effectively clearing it, and data in the shift register is read into an array in the computer memory. This process continues until the shift register has read every column of the CCD array, thereby completing image acquisition for a single stage position of the sample. The final “image” as recorded in the computer consists of a time sequence (Δt = 300 μs) of 800 intensity readings at each pixel along the illuminated pixel column. The next streak-like image is acquired after the motorized microscope stage has advanced to the next position on the sample. The whole image acquisition process is complete when the stage has stepped through the entire sample.
Custom PC software written in LabView (National Instruments, Austin, TX) and interfaced to a data acquisition board (National Instruments) coordinated the image acquisition with the microscope stage controller (Lang MCL-2, Huttenberg, Germany). Images were taken every 500 ms, followed by the advancement of the microscope stage to a new position on the sample. The sequence was repeated until the entire sample had been stepped through, resulting in a stack of images containing the intensity fluctuations from every point in the sample. Images were stored using a Windows 98, 600-MHz Intel P-III computer running WinView (Roper Scientific, Trenton, NJ).
Sample preparation: polystyrene beads
For dynamic light scattering experiments, 200-nm- and 500-nm-diameter polystyrene nanospheres (Duke Scientific, Palo Alto, CA) were tip-sonicated (to break up large clusters) and loaded at their undiluted aqueous suspension concentrations of 2.1 × 10¹² particles/ml (200 nm) and 1.4 × 10¹¹ particles/ml (500 nm) into separate rectangular cross-section glass microcapillary tubes (inner thickness 0.05 mm × 0.5 mm width, Wilmad Specialty Glass, Buena, NJ) by capillary action (Fig. 5 a). The two microcapillary tubes containing the two bead sizes were placed side-by-side on a plastic holder and oriented at a diagonal across the microscope field of view so that the laser-light line illuminated both microcapillary tubes simultaneously. Vacuum grease was used to seal the ends of the microcapillary tubes and to adhere them to the holder. For number fluctuations measurements, 200-nm carboxylate-modified fluorescent dark red FluoSpheres were obtained from Molecular Probes (Eugene, OR). FluoSpheres were drawn into microcapillary tubes at their undiluted concentration of 5.3 × 10¹² particles/ml and mounted similarly.
FIGURE 5.
Experimental spatial maps for the polystyrene beads. (a) Two different sizes of polystyrene beads were used in a single experiment: 200 nm and 500 nm. The beads were in separate microcapillary tubes oriented at an angle with respect to the optical axis and mounted on a homemade microscope sample chamber. Yellow box represents field of view of microscope. (b) Spatial map of the decay rates in the field of view. Note the faster diffusion of the 200-nm beads, as expected. (c) Spatial map of the mobile fractions, obtained using TH Eq. 56, in the same field of view. A zero on the scale implies that most of the scattering centers are immobile whereas unity implies all of the scattering centers are mobile. Both sizes of the beads show a large mobile fraction: for the 200-nm beads, βavg = 0.63 and for the 500-nm beads, βavg = 0.42. The 200-nm beads show a smaller spread of the degree of mobility than the 500-nm beads.
The CCD camera acquired 40 images of the polystyrene beads assembly, each of which represented a line position 10 μm apart on the sample.
Sample preparation: living macrophages
Coverslips (25-mm diameter, No. 2 thickness, and 32.5-mm diameter, No. 1.5 thickness) were treated for several hours in concentrated H2SO4 in a porcelain holder and then rinsed for 2 h in distilled water and oven-dried overnight at 130°F. This treatment greatly reduced the light scattering from the coverslips.
Two aqueous buffers, Ringer (RB: 155 mM NaCl, 5 mM KCl, 2 mM CaCl2, 1 mM MgCl2, 2 mM NaH2PO4, 10 mM HEPES, pH 7.2, 10 mM glucose) and Ringers with acetate (ARB: 80 mM NaCl, 70 mM sodium acetate, 5 mM KCl, 2 mM CaCl2, 1 mM MgCl2, 2 mM NaH2PO4, 10 mM HEPES pH 6.8, 10 mM glucose) were prepared for use during the experiment.
Monoclonal mouse macrophage cultures (RAW 264.7, American Type Tissue Culture, Manassas, VA) were obtained from the laboratory of Dr. Joel Swanson (Department of Immunology, University of Michigan Medical School). The cultures were maintained in 60-mm-diameter polystyrene tissue culture dishes in 10 ml of a 0.2-μm filtered (Millipore, Bedford, MA) solution of Dulbecco's modified Eagle's medium containing 10% heat-inactivated fetal bovine serum, high glucose, L-glutamate, and sodium pyruvate (DMEM, Grand Island Biological Company, Grand Island, NY) and penicillin-streptomycin. For replating onto the glass coverslips, cells were dislodged by vigorous trituration. A 1:30 dilution of the resulting suspension in DMEM was prepared, plated onto 32.5-mm coverslips (precleaned as described above) in polystyrene dishes, and incubated for two days at 37°C. Macrophage cells on a glass coverslip can spread to ∼80-μm-diameter circular shapes, with thicknesses of a couple of microns at the periphery and ∼5 μm in the center.
The cell sample chamber consisted of a 25-mm-diameter, 50-μm-thick Teflon spacer ring, cut into two slightly separated halves to provide a channel for easy fluid exchange by capillary action. These spacers were placed on top of the 32.5-mm coverslip with adherent cells. A 25-mm-diameter coverslip was then placed over the spacers to create a cell sandwich chamber, which was clamped with plastic clips over a drilled hole in a plastic plate. The cells in the chamber were gently rinsed with 1 ml of RB.
Buffer changes during data acquisition
The CCD camera first took 120 successive streak images of the cell in RB with a 5-μm step-stage motion between each image. Subsequently, 1 ml of ARB was exchanged into the cell coverslip sandwich and incubated for 20 min before a second similar round of streak image recording was initiated over the same cell area. A final 1 ml of RB buffer was exchanged into the sample chamber, another 20 min of incubation time elapsed, and the camera acquired a final similar sequence of 120 streak images over the same area.
DATA ANALYSIS
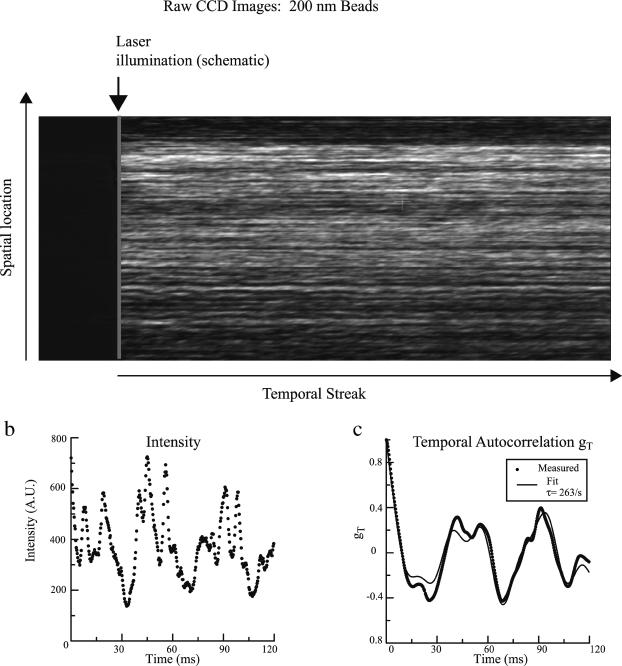
The two types of intensity autocorrelation functions—temporal and spatial—for each pixel along an illuminated line can be calculated from the width and height, respectively, of the same streak image, as shown in Fig. 3 a.
FIGURE 3.
(a) Example of an image recorded from the CCD camera from a 200-nm polystyrene bead suspension. The image is recorded from a single stage position on the sample. The vertical column corresponds to spatial positions on the sample illuminated by the thin line. Each horizontal row is the temporal streak recorded during the readout process of the CCD camera at this location. (b) An example of a recorded intensity fluctuation along one of the rows. (c) The autocorrelation function of the intensity time course shown in b, based directly on the experimental intensities (dotted line) and then subsequently fit with the form of TH Eq. 43 (solid line).
Temporal intensity autocorrelation function and diffusion coefficients
The normalized temporal autocorrelation functions gT(τ) of the experimental intensity fluctuations was calculated along each of the rows for each point on the column-oriented line of illumination according to TH Eq. 42. The theoretically expected temporal autocorrelation function (TH Eq. 40) can be integrated numerically as displayed in TH Fig. 2 a. There is a close agreement between the numerical integration and a fit to a single exponential (TH Fig. 2 b), which justifies approximating the experimental data with a single exponential. Actual experimental autocorrelation functions computed along each row of pixels are quite noisy. In part, this is because the number of correlation times in one row is generally <100 (see Discussion). Also, DLSM is very sensitive to extraneous sources of noise, such as table and acoustic vibrations and laser source fluctuations. To remove these transient and occasionally periodic noise effects, the obtained temporal autocorrelation functions were fit to a sum of a single exponential, three cosine waves, and a constant,
 |
(1) |
where A0…8 are the fitting parameters. Cosine waves were chosen solely to stabilize and expedite the fitting procedure because their zero slope at τ = 0 will not obscure the nonzero slope of the interesting exponentially decaying (A1) term and also they can follow the slow noise undulations that sometimes appear in the experimental g(τ) over longer τ times. The A1 decay rate parameter was assigned a pseudocolor for each pixel to create a spatial map of the fluctuation decay rates. The mean value of the decay rates for each bead size was used to calculate the apparent diffusion coefficients using  where τc = 1/A1 and k0 = 2π/λ where λ = 632 nm here.
Spatial intensity autocorrelation function
The normalized spatial autocorrelation function gS(Δr″) of the experimental intensity fluctuations was calculated along each column (not row) according to TH Eq. 48. To obtain a single spatial autocorrelation function for comparison with theory, all of the gS(Δr″) were averaged over all of the columns.
Mobile fraction
Mobile fraction β was calculated for each pixel in the illuminated column according to TH Eq. 56, and the calculated values were assigned different pseudocolors for display. The theory leading up to TH Eq. 56 assumes that phase fluctuations are the only contributors to the temporal autocorrelation function. However, in an actual experiment, gT(τ) also can be affected by other factors as follows:
Photon shot noise contributes to the amplitude of gT(τ), but only at τ = 0 since the photon arrival times are uncorrelated. Thus, to obtain an accurate estimate of gT(0) apart from shot noise, a linear extrapolation was performed from the values of gT(1) and gT(2).
Number fluctuations were recorded on a sample that produces no coherent phase fluctuations: fluorescent beads. In this case, the variance (due to number fluctuations) was very small, and gT(0) was estimated as gT(1).
Overly large sized pixels can decrease the recorded variance; pixels should be smaller than the spatial correlation distance, as indeed occurs here (see Experimental Results below).
EXPERIMENTAL RESULTS
Polystyrene beads were used to quantitatively test the DLSM technique and compare the experimental values of the mean decay rates and mobile fractions with values predicted from theory. DLSM was then applied to macrophage cells as a test on a living biological system. Macrophages are very motile and their motility can be altered pharmacologically.
Polystyrene beads: temporal phase autocorrelation
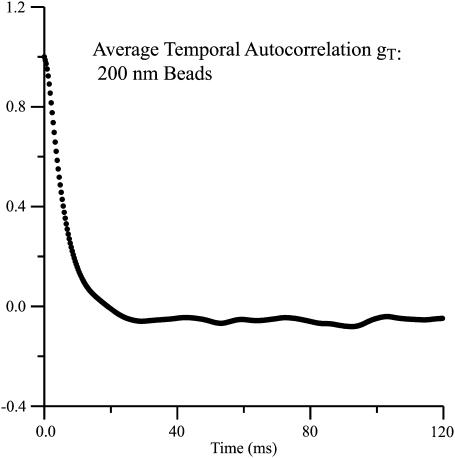
An example of scattered light intensity fluctuations along with the corresponding autocorrelation function is displayed in Fig. 3, b and c. The temporal autocorrelation functions were fit to a linear combination of a single exponential and three cosine waves (Eq. 1). An average of the (∼1000) temporal autocorrelation functions obtained from the rows of a single streaked image of 200-nm polystyrene beads is displayed in Fig. 4. This average exhibits only an exponential decay, indicating the largely random nature of the amplitude and period of the pseudo-oscillations seen in some individual rows.
FIGURE 4.
Temporal autocorrelation function of 200-nm polystyrene beads, averaged over all the rows of the streaked image shown in Fig. 3 a.
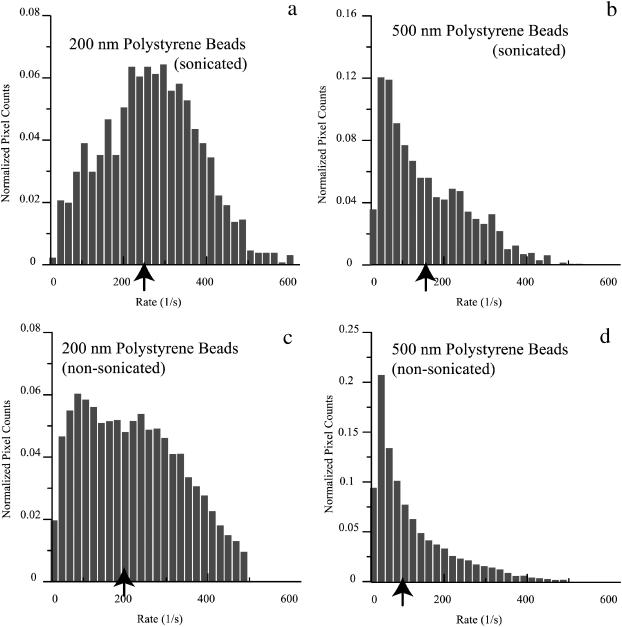
Fig. 5 b shows a DLSM decay rate pseudocolor spatial map of a section of two adjacent microcapillary tubes containing 200-nm and 500-nm diameter beads, respectively. Although the range of colors suggests a wide distribution of decay rates in each tube, there are more pixels with shorter decay rates for the system of 200-nm beads than for 500-nm beads as can be seen in normalized histograms of the decay rates for both sonicated and nonsonicated beads of both sizes (Fig. 6). Fluctuation decay rates are generally much faster for the 200-nm beads. In addition, sonication resulted in an increase of the average decay rates toward the theoretical values. Average values of decay rates measured with our technique were 209 s−1 and 256 s−1 (nonsonicated and sonicated, respectively) for the 200-nm beads and 107 s−1 and 144 s−1 (nonsonicated and sonicated, respectively) for the 500-nm beads. These decay rates correspond to diffusion coefficients of 1.35 × 10⁻⁸ cm2/s and 8.75 × 10⁻⁹ cm2/s for the sonicated 200-nm and 500-nm beads, respectively. Table 1 compares the experimentally obtained results with the hydrodynamic theory predicted values. The experimental results are in good agreement with the hydrodynamic theory values for the 500-nm sonicated beads and ∼40% lower than the theoretical expectation for the 200-nm sonicated beads. There is no obvious correlation between variations in the local decay rates and the local mean scattered light intensity (data not shown).
FIGURE 6.
Histograms of the decay rates for the polystyrene beads. (a, c) 200-nm beads (sonicated and nonsonicated). (b, d) 500-nm beads (sonicated and nonsonicated). The arrows indicate the mean values.
TABLE 1.
Mean diffusion coefficients of polystyrene beads
| Diffusion coefficient (10−8 cm2/s) ± SE | 200-nm sonicated beads (2.1 × 10¹² particles/ml) | 500-nm sonicated beads (1.4 × 10¹¹ particles/ml) |
|---|---|---|
| Experimental | 1.35 ± 0.03 | 0.875 ± 0.03 |
| Theoretical | 2.23 | 8.76 |
The average experimentally measured diffusion coefficients for the 200-nm and 500-nm beads along with the expected values from hydrodynamic theory.
Polystyrene beads: phase fluctuation variance
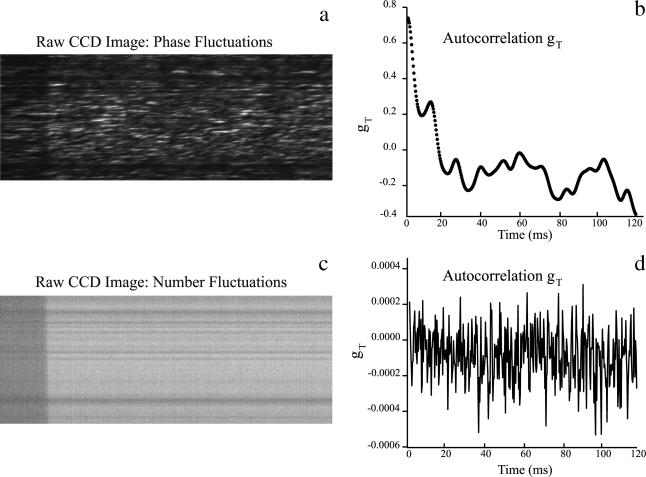
A qualitative representation for the size of the intensity fluctuations can be obtained by visual inspection of an image from the CCD camera. Fig. 7 a shows a raw streaked image recorded by the CCD camera for scattered light (DLSM fluctuations recorded from 200-nm carboxylate-modified dark red FluoSpheres). Fig. 7 b shows the normalized temporal autocorrelation function, gT(τ), for a typical row in the DLSM streaked image depicted in Fig. 7 a.
FIGURE 7.
CCD camera images and their corresponding autocorrelation functions of intensity fluctuations from 200-nm carboxylate-modified dark red FluoSpheres. (a) Raw streak image from dynamic light scattering measurement. (b) Normalized temporal autocorrelation function for a, calculated using TH Eq. 43. The large variations in intensity across the raw image imply a large amplitude in the temporal autocorrelation function. (c) Image from the number fluctuation experiment is taken from the same sample as in a but with a longpass 650-nm filter placed in the emission path. The image is very smooth, indicating small intensity variations. (d) Normalized temporal autocorrelation function for c. The function has a very small amplitude, implying that the contribution from particle number variations to the DLSM intensity fluctuations seen in a and b is very small.
In principle, the amplitude of the normalized autocorrelation function for an entirely mobile DLSM sample should be unity. But as can be seen from Fig. 7 b, the experimental value is ∼0.6. This decreased amplitude is likely due to a fixed scattering background and a consequent “mobile fraction” that is less than unity.
Polystyrene beads: number fluctuations
Number fluctuations without contamination by phase interference effects could be autocorrelated from streaked images of the fluorescence from labeled polystyrene beads. Fig. 7 c shows a raw streaked image recorded by the CCD camera for fluorescence from 200-nm carboxylate-modified dark red FluoSpheres, the same sample used to produce the DLSM image of Fig. 7 a. Fig. 7 d shows a corresponding normalized temporal autocorrelation function for the number fluctuation experiment of Fig. 7 c. The average value of the normalized variance for all of the temporal autocorrelation functions from number fluctuations was only 10−3, much smaller than the relative variance of DLSM phase fluctuations. Thus, we conclude that the fluctuations observed at 632 nm were due almost exclusively to dynamic light scattering phase fluctuations rather than number fluctuations of particles diffusing in and out of the volume observed by a pixel. The intensity fluctuations resulting from the fluorescence emission were so small that decay rates could not be reliably extracted from the temporal autocorrelations.
Polystyrene beads: spatial autocorrelation
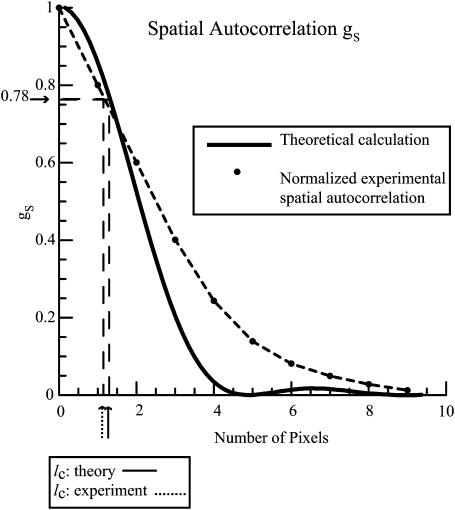
The spatial autocorrelation function obtained for the 200-nm sonicated polystyrene beads along with the theoretically predicted Airy disk (TH Eq. 48) is shown in Fig. 8. The amplitude at which the characteristic distance is defined (μ = 1) from which the spatial correlation distance lc can be derived (TH Eq. 50) is indicated. The value of the spatial correlation distance obtained from the theoretical curve is ∼lc = 1.27 pixels which corresponds to 8 μm, whereas the value of the spatial correlation distance calculated from the experimentally obtained spatial autocorrelation function is equal to lc = 1.1 pixels which corresponds to 6.93 μm. Thus, the experimentally obtained value of the spatial correlation distance agrees well with the theoretically derived one. In addition, since the size of the CCD camera pixel is 6.3 μm, each pixel will observe intensity fluctuations from approximately one spatial correlation area. The experimental curve in Fig. 8 has a significantly longer “tail” at larger distances than the theoretical curve. This probably arises from the static inhomogeneities in the coherent intensity along the illumination line that appear as rows of varying mean intensity in the raw image of Fig. 7 a.
FIGURE 8.
Normalized spatial autocorrelation function for the 200-nm polystyrene beads. The experimentally obtained spatial autocorrelation function is depicted by black dots connected by dashed lines. The theoretical spatial autocorrelation function (based on TH Eq. 48) is depicted by the solid line. The characteristic decay distance of the spatial autocorrelation function (where μ = 1) is marked for both the experimentally and theoretically obtained curves.
Polystyrene beads: mobile fractions
Mobile fractions were calculated using TH Eq. 56. Fig. 5 c shows the spatial map of the mobile fractions obtained from the dynamic light scattering intensity fluctuation measurements for the 200-nm and 500-nm beads. The 200-nm beads show a higher overall relative mobility than the 500-nm beads. This can be due to the fact that the concentration of the 200-nm beads is an order-of-magnitude larger than the concentration of the 500-nm beads, which caused the mean light scattering intensity to be larger from the smaller beads. Thus, scattering from the smaller beads constituted a larger fraction of the total scattering in the experimental system, which includes background scattering from the microcapillary tubes and optics. Finally, the spread in mobile fraction within each sample is likely due to the fact that the background is different at each point in the sample. This static background variability is obvious by visual inspection through the microscope, and in the row-to-row variation of mean intensities seen in the raw image of Fig. 7 a.
Living macrophage cells: temporal autocorrelation
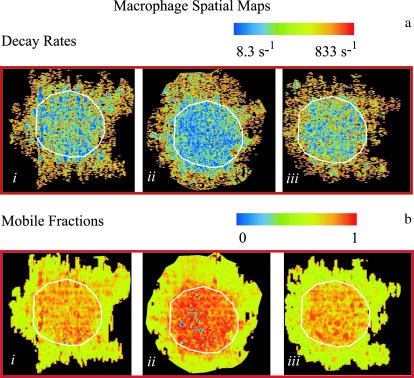
DLSM experiments were performed on a total of 21 macrophage cells as follows: 1), 10 min after the cell was removed from the incubator and washed with Ringers buffer; 2), 20 min after the acetate-containing Ringers buffer was introduced; and 3), 20 min after Ringers buffer with acetate was replaced with plain Ringers buffer to remove the acetate. The microscope (and the illumination stripe) was focused on the edge of the cell, in the x,y plane to obtain the sharpest image, but scattered light from the entire local depth of the cell contributes to the recorded intensity. The cells spread out around their periphery on the coverslip so that the plane of focus is the plane closest to the substrate. In this case, the nucleus takes up ∼30% of the area of the inner region of the cells. Fig. 9 a shows pseudocolor spatial maps of the fluctuation decay rates created for the three conditions for a typical cell.
FIGURE 9.
Experimental spatial maps of a macrophage cell. For both a and b, each map depicts one of the three treatments on the cell: (i) The cell was flushed with 1 ml of Ringer's buffer (RB). (ii) The cell was flushed with 1 ml of an acetate-containing RB (ARB) and incubated for 20 min. (iii) The ARB was washed out with RB and the cell was incubated for 20 min. (a) Spatial map of the temporal autocorrelation intensity fluctuation decay rates. There is a noticeable decrease in the motility of the acetate-treated cell. Washing out the acetate reverses this attenuated motility restoring the cell to its initial state. Black pixels occur where the scattering intensity was too low to obtain useful data. (b) Spatial map of the mobile fractions β of macrophages. The mobile fraction data is plotted on a logarithmic scale. Most of the motion occurs in the central interior portion of the cells.
A white overlay line divides the cell image into outer and inner regions. In all three maps, the outer region of the cell shows faster motility than the inner region. Additionally, the center of the cell shows a noticeable decrease in the macrophage motility when acetate is added. The original motility seems to be restored when acetate is washed out. The black areas within the periphery of the cell region represent the locations at which the decay rates could not be reliably calculated because the scattered intensity was too low.
Living macrophage cells: mobile fraction
Fig. 9 b shows the spatial maps of the mobile fractions on a log scale for the three treatments described above. Overall, the mobile fraction is quite low, especially in the outer region where the mean scattering intensity from the cell is a smaller fraction of the background scattering.
DISCUSSION
We have experimentally verified the utility of the microscope dynamic light scattering imaging technique. These relative motions, visualized as intensity fluctuations, are detected in both nonbiological and biological systems using a slow scan CCD camera. Fluctuations as fast as 250 s−1 were measured and relative motions between scattering centers on the order of a fraction of a wavelength were spatially mapped.
Polystyrene beads
The experimental diffusion coefficients were relatively correct for the ratio of 200-nm versus 500-nm polystyrene beads with the values for the 200-nm beads slower than expected. However, both were somewhat lower than theoretically predicted from hydrodynamics. This discrepancy can be explained by the fact that aggregates were most likely present in both samples, forming particles with larger effective sizes and therefore lowering their diffusion rate. Sonication of the bead suspensions increased the diffusion rates toward the theoretical value, as described.
Because of the high concentration of beads in these samples, we would expect that number fluctuations should be small, as was experimentally confirmed. Also, because the relevant characteristic volume for number fluctuations (i.e., the effective the volume observed by a pixel) is typically larger than the characteristic volume leading to phase fluctuations, number fluctuations are likely to be slower than phase fluctuations, as was also experimentally confirmed. Number fluctuations do not contribute much to the DLSM streaked images observed here.
The spread in diffusion rates is in part due to the noisiness of the temporal autocorrelation function. This effect arises from the fact that the temporal autocorrelation function is computed over a relatively small number of correlation times. The correlation time of the intensity fluctuations for the 200-nm polystyrene beads (τc) was ∼3 ms and the intensity fluctuations were collected over a 240-ms period (T, the time duration of a streak in the CCD record). The signal/noise in the autocorrelation function is thereby expected to be (T/τc)1/2 ≈ 9.
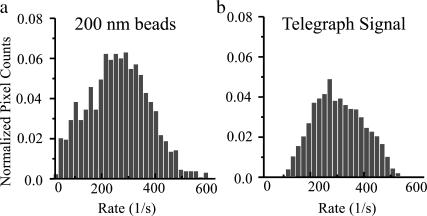
For a more precise approach to estimating the spread of autocorrelation decay rates arising solely from a finite experimental time T, we calculated the temporal autocorrelation functions from an ensemble of numerically generated “telegraph” signals, over the same number of correlation times as in the experiment. A telegraph signal has transitions between +1 and −1 at completely uncorrelated times (but at a certain average rate) and has a simple exponentially decaying autocorrelation function (Davenport and Root, 1958). Fig. 10 a shows the experimentally obtained distribution of decay rates for 200-nm polystyrene beads. Fig. 10 b is the distribution of decay rates from the autocorrelation function of the telegraph signal. The mean decay rate of the telegraph signal was scaled to match that of the experimental data. Comparison of the two confirms that much of the spread of experimental characteristic rates on the beads is due to an insufficient number of correlation times in T. However, the width of the distribution of the decay rates for the beads is still somewhat wider than that for the noise signal and it is skewed toward the slower decay rates. This indicates that the width of the distribution for the beads is due in part to spatial heterogeneity of different sized aggregates in the 240-ms timescale of the experiments.
FIGURE 10.
Comparison of the distribution of the decay rates for the 200-nm polystyrene beads and for a numerically generated telegraph signal with the same average rate and number of coherence times for calculation. (a) Normalized intensity fluctuation decay rates for 200-nm polystyrene beads. (b) Normalized intensity fluctuation decay rates for the telegraph signal. The finite number of coherence times results in a spread in the intensity fluctuation decay rates for the experimental data as well as the numerically generated noise signal.
The theoretical calculation indicates that the amplitude of the normalized temporal autocorrelation function should be unity. However the amplitude of the experimentally obtained autocorrelation function for polystyrene beads is significantly less. This amplitude reduction could arise for two reasons. First, there is a large background of immobile scattering emanating from the collection optics. This background does not contribute to the intensity fluctuation decay of the autocorrelation function, but does increase in the overall light intensity. Secondly, since the spatial correlation distance covered a region <2 pixels in size, not all the parts of a single pixel will see exactly the same intensity, thereby slightly decreasing the pixel-to-pixel variance of the recorded intensities. In principle, the angular spectrum of incident waves in a focused illumination beam (in contrast to the planarity assumed in the theory) could affect both temporal scale and amplitude of the fluctuations. But given the narrow angle of convergence used here, this effect is likely to be very small.
Macrophages
Macrophages are immune system cells well known for their high motility. They are found in all tissues and in the blood. They are scavenger cells, acting as the first line of defense in recognizing and killing foreign microorganisms through phagocytosis (Cannon and Swanson, 1992). During phagocytosis, the macrophage invaginates foreign material and breaks it down enzymatically.
Previous work on macrophages showed there are two distinct regions of the cell—a thin outer section and a thicker central section (Swanson et al., 1992). The DLSM spatial maps of the fluctuation decay rates of the imaged cells confirm this finding. Those maps indicate that the outer zone has faster fluctuations than the center of the cell. This result is particularly interesting because previous experiments from this lab, using polarized total internal reflection fluorescence microscopy (Sund et al., 1999), showed the plasma membrane in the outer zone to be rather flat and inert whereas the plasma membrane of the central zone appeared to be quite bumpy and dynamic. Evidently, other intracellular scattering centers in that outer zone are moving rapidly.
Treatment with acetate-containing buffer reduced the rate of motion of scattering centers in the interior zone (see Fig. 9). Previous studies show that exposure of the macrophage to acetate-containing Ringer's buffer acidifies the cell and causes the lysosomes concentrated in the center of the cell to migrate radially outward to the cell edge (Heuser, 1989). This causes certain regions within the cell to switch from high activity to quiescence.
The studies on macrophages here show that DLSM is feasible on living cells. It essentially provides contrast in unlabeled cells based on rapid rates of submicroscopic motion rather than static refractive index gradients. However, background scattering can be significant and can make some of the least-scattering regions of a cell unusable for DLSM.
Improvements for DLSM
Further improvements in DLSM should be aimed toward increasing its spatial and chemical specificity. Our current optical setup works in an epi-illumination mode. Since the depth of the focal region is ∼2 μm, the entire thickness of the cell is illuminated. Therefore, the scattered light intensity comes from multiple layers of scattering centers in the region of illumination. Consequently, specific identification of the organelle motions giving rise to intensity fluctuations is uncertain. To begin to understand the various physical processes contributing to the intracellular motion causing the phase fluctuations, the illuminated region should be better defined to a thin optical slice, such as obtainable with total internal reflection illumination (Axelrod, 2003). With total internal reflection illumination, the cell membrane and submembrane structure would be the major component in the region of illumination.
Another improvement to DLSM would be to increase its chemical specificity while maintaining the coherent scattering necessary for intensity phase fluctuations. One possibility is to combine DLSM with second harmonic generation imaging microscopy (Campagnola et al., 2001). Second harmonic generation is a second-order optical process such that the monochromatically scattered light is coherent but is double the frequency of the incident light. Second harmonic generation signals can only arise from scattering centers lacking a center of symmetry. Cell membranes and many highly ordered structural proteins intrinsically lack this symmetry center and can be imaged via second harmonic generation imaging microscopy. In addition, chemical dyes are available having the required second order optical nonlinearities. The dyes can be specifically bound to target organelles and have been used to increase the second harmonic generation resolution and contrast within the membrane of the cell (Campagnola et al., 2002).
Another technique that could be combined with DLSM is a modification of resonance light scattering microscopy (Yguerabide and Yguerabide, 1998a,b). Resonance light scattering microscopy in its current form produces highly monochromatic scattered light from gold particles in suspension illuminated by a xenon lamp, with the scattered color dependent upon the size of the particles. In an application to cell biology, these gold particles could be biochemically modified to specifically label organelles within a cell. The gold particles have a high light-scattering power and are unbleachable. Illumination with a wavelength-tunable laser tuned to the resonance of the gold particles would produce coherent scattered light emanating mainly from the gold particles. Phase intensity fluctuations would occur between neighboring gold particles; these fluctuations could then be autocorrelated to measure relative motions among specific constituents in the cell.
Acknowledgments
We thank Drs. Kenneth Christensen, Adam Hoppe, and Joel Swanson for macrophage cell culturing assistance.
Work was supported by National Institutes of Health 1R01 NS38129 (D.A.) and a National Science Foundation Graduate Student Fellowship (R.D.).
References
- Axelrod, D. 2003. Total internal reflection fluorescence microscopy in cell biology. Meth. Enzymol. 361:1–33. [DOI] [PubMed] [Google Scholar]
- Campagnola, P. J., H. A. Clark, W. A. Mohler, A. Lewis, and L. M. Loew. 2001. Second harmonic imaging microscopy of living cells. J. Biomed. Opt. 6:277–286. [DOI] [PubMed] [Google Scholar]
- Campagnola, P., A. Millard, M. Terasaki, P. Hoppe, C. Malone, and W. Mohler. 2002. Three-dimensional high-resolution second-harmonic generation imaging of endogenous structural proteins in biological tissues. Biophys. J. 82:493–508. [DOI] [PMC free article] [PubMed] [Google Scholar]
- Cannon, G. J., and J. A. Swanson. 1992. The macrophage capacity for phagocytosis. J. Cell Sci. 101:907–913. [DOI] [PubMed] [Google Scholar]
- Davenport, W., and W. Root. 1958. An Introduction to the Theory of Random Signals and Noise. McGraw Hill, New York.
- Dzakpasu, R., and D. Axelrod. 2004. Dynamic light scattering microscopy. A novel optical technique to image submicroscopic motions. I: Theory. Biophys. J. 87:1279–1287. [DOI] [PMC free article] [PubMed] [Google Scholar]
- Heuser, J. 1989. Changes in lysosome shape and distribution correlated with changes in cytoplasmic pH. J. Cell Biol. 108:855–864. [DOI] [PMC free article] [PubMed] [Google Scholar]
- Sund, S. E., J. A. Swanson, and D. Axelrod. 1999. Cell membrane orientation visualized by polarized total internal reflection fluorescence. Biophys. J. 77:2266–2283. [DOI] [PMC free article] [PubMed] [Google Scholar]
- Swanson, J. A., A. Locke, P. Ansel, and P. J. Hollenbeck. 1992. Radial movement of lysosomes along microtubules in permeabilized macrophages. J. Cell Sci. 103:201–209. [DOI] [PubMed] [Google Scholar]
- Yguerabide, J., and E. Yguerabide. 1998a. Light-scattering submicroscopic particles as highly fluorescent analogs and their use as tracer labels in clinical and biological applications. I. Theory. Anal. Biochem. 262:137–156. [DOI] [PubMed] [Google Scholar]
- Yguerabide, J., and E. Yguerabide. 1998b. Light-scattering submicroscopic particles as highly fluorescent analogs and their use as tracer labels in clinical and biological applications. II. Experimental characterization. Anal. Biochem. 262:157–176. [DOI] [PubMed] [Google Scholar]


