Abstract
Depolarizing voltage steps activate voltage-dependent K+ (Kv) channels by moving the voltage sensor, which triggers a coupling reaction leading to the opening of the pore. We constructed chimeric channels in which intracellular regions of slowly activating Kv2.1 channels were replaced by respective regions of rapidly activating Kv1.2 channels. Substitution of either the N-terminus, S4–S5 linker, or C-terminus generated chimeric Kv2.1/1.2 channels with a paradoxically slow and approximately exponential activation time course consisting of a fast and a slow component. Using combined chimeras, each of these Kv1.2 regions further slowed activation at the voltage of 0 mV, irrespective of the nature of the other two regions, whereas at the voltage of 40 mV both slowing and accelerating effects were observed. These results suggest voltage-dependent interactions of the three intracellular regions. This observation was quantified by double-mutant cycle analysis. It is concluded that interactions between N-terminus, S4–S5 linker, and/or C-terminus modulate the activation time course of Kv2.1 channels and that part of these interactions is voltage dependent.
INTRODUCTION
Voltage-gated K+ channels (Kv channels) are formed by tetramers of α-subunits (MacKinnon, 1991; Heginbotham and MacKinnon, 1992; Liman et al., 1992) and each subunit was proposed to contain six transmembrane helices (S1–S6; for review see Yellen, 2002). Segments S5–S6 contribute to the pore and the selectivity filter of the channel, whereas segments S1–S4 make up the voltage sensor. Tetramerization specificity of the subunits is mainly controlled by a highly conserved and subfamily-specific domain in the N-terminus close to the S1 segment (Li et al., 1992; Sheng et al., 1993). The activation of Kv channels is controlled by the membrane voltage, which imposes an electric field across the membrane controlling the position of gating charges in the voltage sensor. The S4 segment has been identified as a major element of the voltage sensor (Liman et al., 1991; Papazian et al., 1991; Logothetis et al., 1992; Perozo et al., 1994; Larsson et al., 1996; Yusaf et al., 1996; Starace et al., 1997; Cha and Bezanilla, 1997). The S2 and S3 segments also contribute to the voltage sensor (Papazian et al., 1995; Planells-Cases et al., 1995; Seoh et al., 1996; Tiwari-Woodruff et al., 1997; Cha and Bezanilla, 1997; Milligan and Wray, 2000). Recently, the first crystal structure of a voltage-gated K+ channel, the bacterial KvAP channel, has been reported (Jiang et al., 2003a) and the authors also suggest a contribution of these three segments to the voltage sensor (Jiang et al., 2003b).
The coupling reaction, which transmits movements of the voltage sensor to pore opening, is not well understood. Structure-function studies have implicated the S3–S4 linker (Mathur et al., 1997), the S4–S5 linker (McCormack et al., 1991; Shieh et al., 1997; Lu et al., 2002), and/or the inner part of the pore-lining S6 segment (del Camino and Yellen, 2001). Other experimental results show that also the intracellularly located termini modulate activation; mutations in the N-terminal tetramerization domain modulate both steady-state activation and activation kinetics in Kv1 channels (Minor et al., 2000; Cushman et al., 2000) and Kv2 channels (VanDongen et al., 1990; Chiara et al., 1999). VanDongen et al. (1990) also showed a modulatory effect of the C-terminus on Kv2.1 channels and, in a recent study, Ju and co-workers (2003) identified the residues 67 and 75 in the Kv2.1 N-terminus and a domain in the C-terminus (residues 741–853) to be involved in determining Kv2.1 activation kinetics. Moreover, Ju and co-workers (2003) presented evidence that the N-terminal Kv2.1 residues interact with the C-terminal domain.
We showed previously that Kv1.2 channels activate three times faster than Kv2.1 channels (Scholle et al., 2000). During these investigations we noticed a paradoxical slowing of activation when the S4–S5 linker in Kv2.1 channels was replaced by the one of Kv1.2. Apparently, the presence of the Kv1.2 S4–S5 linker in Kv2.1 channels slowed Kv2.1 channel activation even further. It may therefore be hypothesized that replacement of the Kv2.1 S4–S5 linker by the one of Kv1.2 disturbs a concerted interaction between the S4–S5 linker and other parts of the Kv2.1 channel, as, e.g., the N- or C-terminus.
To identify such interactions, we systematically replaced these three regions of Kv2.1 channels by respective regions of Kv1.2 channels and analyzed both steady-state activation and the activation time course. We present evidence that each of the Kv1.2 regions confers pronounced slowing of activation, that the slowing depends on voltage, and that the regions interact. The strength of these interactions is energetically characterized by means of double-mutant cycle analysis.
MATERIALS AND METHODS
In vitro mutagenesis
Chimeric cDNAs for Ch_N, Ch_L4/5, and Ch_C were obtained by overlap PCR (PCR; Ho et al., 1989). cDNAs were cloned into the pGEM-HE vector for RNA synthesis (Liman et al., 1992). Suitable restriction sites in the Kv2.1 sequence of Ch-N, Ch_L4/5, and Ch_C were used to obtain Ch_NL4/5 (Bsp 120I), Ch_NC (Bsp 120I), Ch_L4/5C (SapI), and Ch_NL4/5C (Bsp 120I).
Table 1 illustrates names and splice sites of all chimeras used. Based on the fact that only the N-terminus (N), S4–S5 linker (L4/5), and C-terminus (C) of Kv1.2 were transferred to Kv2.1, the names of the chimeras (Ch_) were specified by indicating the sequence of these transferred regions in the direction from the N-terminus to the C-terminus. For example, “Ch_NL4/5” means that the chimera contains the N-terminus and the S4–S5 linker from Kv1.2 (1.2) in a Kv2.1 (2.1) background.
TABLE 1.
Structure of the Kv2.1/Kv1.2 chimeras
| Chimera | Splice sites |
|---|---|
| Ch_N | 1.2 M1-I164/2.1 L191-I858 |
| Ch_L4/5 | 2.1 M1-Q318/1.2 I316-L331/2.1 I335-I858 |
| Ch_C | 2.1 M1-V413/1.2 S411-V499 |
| Ch_NL4/5 | 1.2 M1-I164/2.1 L191-Q318/1.2 I316-L331/2.1 I335-I858 |
| Ch_NC | 1.2 M1-I164/2.1 L191-V413/1.2 S411-V499 |
| Ch_L4/5C | 2.1 M1-Q318/1.2 I316-L331/2.1 I335-V413/1.2 S411-V499 |
| Ch_NL4/5C | 1.2 M1-I164/2.1 L191-Q318/1.2 I316-L331/2.1 I335-V413/1.2 S411-V499 |
The names of the chimeras (Ch_) were specified by the sequence of the transferred Kv1.2 regions (N, N-terminus; L4/5, S4–S5 linker; C, C-terminus). The splice sites are indicated by the respective segment (1.2 for Kv1.2; 2.1 for Kv2.1) as well as the one-letter code and the position of the first and last amino acid of this segment.
Expression in oocytes
Ovarian lobes from Xenopus laevis were resected under anesthesia (0.4% 3-aminobenzoic acid ethyl ester) and transferred to a Petri dish containing Ca2+-free Barth medium (84 mM NaCl, 1 mM KCl, 2.4 mM NaHCO3, 0.82 mM MgSO4, 7.5 mM Tris, pH = 7.4 with HCl). The oocytes were incubated in Ca2+-free Barth medium containing 1.2 mg/ml collagenase (type CLSII, Biochrom KG, Berlin, Germany) for 1–2 h. After washing repeatedly with Barth medium containing in addition 0.33 mM Ca(NO3)2, 0.41 mM CaCl2, 4 μg/ml cefuroxim, 50 units/ml penicillin, 50 μg/ml streptomycin, and 100 μg/ml neomycin, the oocytes were isolated and defolliculated mechanically. Within 6 h after isolation the oocytes were injected with ∼50 nl cRNA solution. The cRNA concentration was varied for control of the expression level. The oocytes were incubated at 18°C in Barth medium until experimental use within 3 days after injection.
Electrophysiology
Ionic currents were recorded with the two-microelectrode voltage clamp technique (OC725C amplifier, Warner Instrument, Hampden, CT) at room temperature. The microelectrodes were filled with 3 M KCl and had a resistance of 0.3–0.7 MΩ. The experiments were performed in modified Barth medium containing 5 mM KCl and 80 mM NaCl instead of 1 and 84 mM, respectively. The experiments were controlled with a personal computer and the ISO2 software (MFK, Niedernhausen, Germany). The holding potential was generally −80 mV. Ionic currents were measured with pulses between −20 and 60 mV spaced 10 mV. Because the activation kinetics among the chimeras differed by orders of magnitude, both pulse and interpulse duration were appropriately adapted to the activation time course with the criterion that the ionic currents were fully activated. Used pulse durations were 0.5, 1, 2, 5, 15, and 30 s and the corresponding interpulse times were 2, 2, 5, 10, 30, and 60 s. Small linear leakages were removed by subtracting scaled average traces to subthreshold potentials between −70 and −40 mV.
Steady-state activation was determined as described previously from the amplitude of instantaneous currents at 0 mV after depolarizing pulses to variable potentials between −40 and 60 mV (cf. Scholle et al., 2000). The relative amplitude of the tail current, Irel, was determined from the amplitude ratio of the instantaneous current at the actual potential with respect to the instantaneous current after maximal depolarization. This relationship was plotted as function of voltage and fitted by the Boltzmann function with power 1
 |
(1) |
yielding the midpoint voltage V1/2 of half-maximum activation and the equivalent gating charge z. R is the molar gas constant, T the absolute temperature in Kelvin (K), and F the Faraday constant.
Fitting and statistics
The data were fitted with various functions using the χ2-method of the Origin 6.1 software (OriginLab, Northampton, MA) or the routines implemented in the ISO2 software. Statistical data are presented as means ± SE and errors were calculated according to the error propagation law. Statistical significance was tested with the Student's t-test (P < 0.05).
RESULTS
Kv1.2 N-terminus, S4–S5 linker, and C-terminus slow the activation time course of Kv2.1
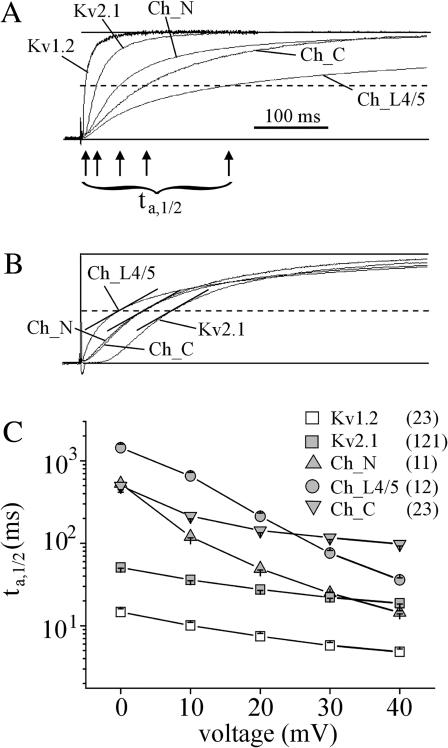
We first investigated effects of a replacement of Kv2.1 N-terminus, S4–S5 linker, or C-terminus by the ones of Kv1.2 on the activation rate of Kv2.1 channels (chimeras Ch_N, Ch_L4/5, Ch_C). None of the cytosolic Kv1.2 regions transferred the typical faster activation rate of Kv1.2 channels to Kv2.1 channels. Instead, the three chimeric channels exhibited a considerably slowed activation rate (Fig. 1 A). In contrast to the pronounced sigmoidal activation of wild-type channels, those of the chimeras were dominated by an approximately exponential time course. This is demonstrated in Fig. 1 B where the normalized activation time courses are compared by adjusting their timescales to make the rate of rise at the half-maximum current equal (c.f. Zagotta et al., 1994a). The predominant exponential activation in the chimeras suggests that the slowing was caused only in a concerted reaction after the independent gating of the subunits (c.f. Zagotta et al., 1994a).
FIGURE 1.
Activation rate of the ionic current in chimeric channels constructed by inserting either the N-terminus (Ch_N), the S4–S5 linker (Ch_L4/5), or the C-terminus (Ch_C) from Kv1.2 in Kv2.1 channels. (A) Representative current traces at +20 mV. The current amplitude was normalized with respect to that of the steady-state current, which is not reached by the chimeras in the time window shown. The arrows indicate the time intervals, ta,1/2, between clamp step and half-maximum current (dashed line). (B) Sigmoidicity for Kv2.1 channels and the three chimeras. The sigmoidicity can be defined as the amount of delay relative to the overall rate of activation. The normalized currents were adjusted in their timescales to make the rate of rise at the half-maximum current (dashed line) equal (short lines). (C) Plot of ta,1/2 as function of voltage. The slowing effects of the transferred intracellular regions showed different voltage dependencies. Here and in the other figures, the numbers of oocytes included are shown in parentheses to the right of the names and the error is indicated by SEM.
Plotting the time interval between the depolarizing clamp step and the half-maximum current, ta,1/2, as function of voltage (Fig. 1 C) yielded the following results: The Kv1.2 N-terminus slowed activation of Kv2.1 channels at 0 mV but not at 40 mV, the Kv1.2 C-terminus slowed activation at all voltages by a similar factor, and the Kv1.2 S4–S5 linker slowed activation at 0 mV more markedly than the Kv1.2 N- or C-terminus whereas at 40 mV the slowing effect was small.
Evaluation of the activation speed by ta,1/2, however, does not reflect all differences of the activation time courses between the chimeras. We therefore determined a mean activation time constant for the exponential activation time course after the relatively short initial delay: We first fitted the activation time course between the inflection point and the end of the depolarizing pulse with the sum of two exponential components according to
 |
(2) |
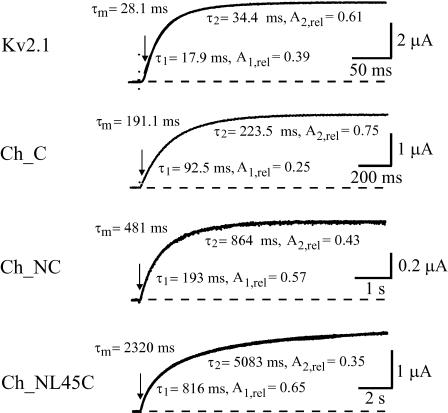
A1, A2, τ1, τ2 are the amplitude and the time constant of the fast and slow exponential, respectively. The relative weight of the fast exponential (A1,rel = A1/(A1 + A2)) ranged from 19 to 61% and the time constants for an individual current trace differed by less than factor 9. The mean activation time constant τm was then calculated as the weighted mean of τ1 and τ2. In contrast to ta,1/2, τm also adequately reflects slow exponential terms of small amplitude. The great benefit of a single parameter describing the activation speed is that it allows a direct evaluation of the degree of slowing conferred by the individual Kv1.2 segments.
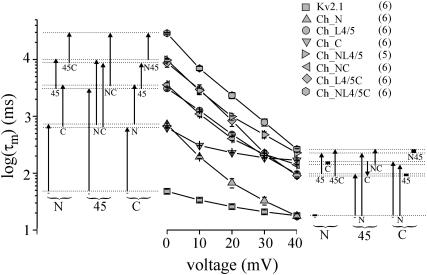
In the following analysis we also included double chimeras (Ch_NL4/5, Ch_L4/5C, Ch_NC; Table 1) and the triple chimera (Ch_NL4/5C; Table 1). The results showed that cumulative replacement of Kv2.1 regions by the ones of Kv1.2 further enhanced the slowing of current activation, as shown for three related chimeras in Fig. 2. To analyze the slowing effects of the Kv1.2 regions systematically, log(τm) was plotted as function of voltage (Fig. 3). To the right and left of the log(τm)-voltage relationship, the effects of the Kv1.2 N-terminus, S4–S5 linker, and/or C-terminus on log(τm) are schematically illustrated by arrows for each combination of the intracellular regions. At 0 mV, log(τm) increased in four steps with the number of intracellular Kv2.1 regions replaced by the ones of Kv1.2: < either terminus alone < both termini or the S4–S5 linker < S4–S5 linker plus one of the termini < S4–S5 linker plus both termini. Considering the effects of the intracellular Kv1.2 regions with each combination of the other intracellular regions, the results show that the effects are approximately additive (arrows). At 40 mV, we found a different situation; replacement of the N-terminus (Ch_N) had no effect on log(τm) whereas replacement of the C-terminus (Ch_C) exerted nearly the maximum slowing effect, developed by the chimeras Ch_C, Ch_NL4/5C, and Ch_NL4/5. Thus, the approximate additivity for log(τm) observed at 0 mV was not seen at 40 mV; the Kv1.2 N-terminus and C-terminus produced either an increase of log(τm) or no effect whereas the S4–S5 linker generated either an increase or, in one case, a decrease of log(τm). The results suggest that at 0 mV the effects of Kv1.2 intracellular regions on the activation time course are largely independent of the nature of the other two regions. In contrast, specific interactions between particular intracellular regions may exist at 40 mV.
FIGURE 2.
Exponential description of representative currents of Kv2.1 channels, the chimera with substituted Kv1.2 C terminus (Ch_C), with substituted Kv1.2 C-terminus and N-terminus (Ch_NC), and with substituted Kv1.2 C-terminus, S4–S5 linker, and N-terminus (Ch_NL4/5C). Representative currents were fitted between the time of the inflection point (arrows) and the end of the depolarizing pulse with two exponentials by Eq. 2. Indicated are the resulting fast and slow time constant, τ1 and τ2, and the relative weight of the exponential terms, A1,rel = A1/(A1 + A2) and A2,rel = A2/(A1 + A2), respectively. The fitted curves are superimposed to the currents. The mean time constant, τm, is the weighted mean of τ1 and τ2. Each additional intracellular Kv1.2 region further increased τm. Test pulse voltage 20 mV.
FIGURE 3.
Plot of the mean time constant of activation, τm, as function of voltage. The groups of four arrows to the left and right of the diagram specify the effects of either the N-terminus, the S4–S5 linker, or the C-terminus (indicated below the parentheses) on the time constants at 0 and 40 mV with each combination of the other two regions, respectively. Black rectangles instead of arrows indicate the absence of an effect. Below each arrow/rectangle, the individual reference for a specific effect is indicated. For example, “-”, “45”, or “45C” means that either Kv2.1 channels, chimera “Ch_C”, or chimera Ch_L4/5C were the reference.
Effects of the intracellular Kv1.2 regions on the rate constants of activation and deactivation of Kv2.1
The slow and exponential activation time course of the chimeras strongly suggests that only a concerted reaction after the independent gating of the subunits can be slowed. This can either be the reaction coupling the voltage-sensor movement to the pore opening or the pore opening itself. The following simple kinetic model was used to obtain a semiquantitative measure of the effects of the mutations (Li-Smerin et al., 2000; Yifrach and MacKinnon, 2002)
 |
Scheme 1 |
C and O are the closed and open state, k1 and k2 the respective forward and backward rate constants. From Scheme 1 it follows that τm equals the relaxation time constant, 1/(k1+ k2). We assumed that the mean time constant τm, calculated as weighted mean of the fast and the slow time constant τ1 and τ2, respectively, describes the activation time course as a first approximation.
The rate constants k1 and k2 at 0 and 40 mV were determined by
 |
(3a) |
 |
(3b) |
 |
(3c) |
 |
(3d) |
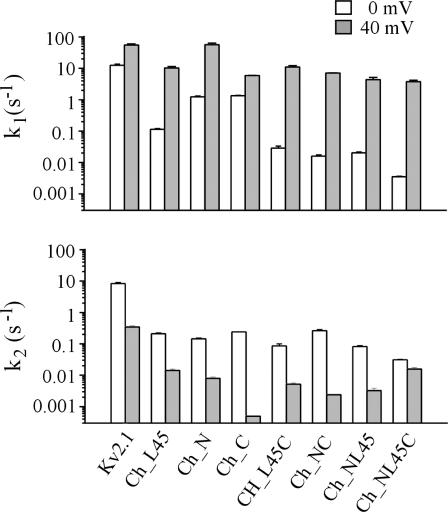
Po,0 and Po,40 are the open probabilities at 0 and 40 mV, respectively. As estimates for Po we used the Irel values at the respective voltage calculated with Eq. 1. It is evident that k2,0 for the activation of the chimeras is relatively invariant and smaller than for Kv2.1 channels (Fig. 4). Also k1,0 is smaller for the chimeras than for Kv2.1 channels. In contrast to k2,0, however, the decrease in k1,0 is markedly smaller for Ch_N and Ch_C than for the other chimeras. Only in Kv2.1 channels and in Ch_C depolarization to 40 mV generates larger deceleration in k2 than acceleration in k1 whereas in all other chimeras k1 is more accelerated than k2 is decelerated.
FIGURE 4.
Rate constants k1 and k2 for all chimeras at 0 and 40 mV according to Scheme 1.
Interaction energy of intracellular Kv1.2 regions associated with the activation kinetics
Interaction of substituted intracellular regions associated with activation-induced changes of the rate constants k1 and k2 was estimated by calculating free-energy differences. According to the absolute reaction rate theory of Eyring (Glasstone et al., 1941), a rate constant kx is related to the free-energy difference, ΔGkx, between a transition state and the ground state by
 |
(4) |
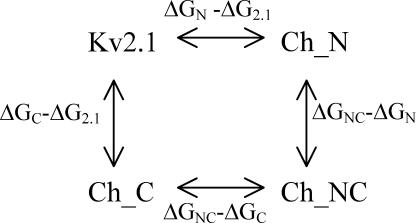
where k and h are the Boltzmann and the Planck constant, respectively. ΔGkx was calculated for both k1 and k2 at both 0 and 40 mV. Following the principles of thermodynamic double-mutant cycle analysis (for reviews see Wells, 1990; Mildvan et al., 1992; Horovitz, 1996), a double-mutant cycle consists of a wild-type protein, two single mutants, and the corresponding double mutant. In this study, a substituted intracellular Kv1.2 region is considered a “mutation” and interaction refers to the sum of interactions between the two regions. If the respective difference of the free energy between the double chimera with replaced regions A and B and the chimera with replaced region B (ΔGAB − ΔGB) differs from that between the chimera with replaced region A and the Kv2.1 channel (ΔGA − ΔG2.1), then the two regions A and B interact with the respective interaction energy ΔΔGInteraction = ΔGAB − ΔGB − (ΔGA − ΔG2.1). For example, the double-mutant cycle for Kv2.1, Ch_N, Ch_C, and Ch_NC is
Scheme 2.
and the interaction energy between the N- and C-terminus is ΔΔGInteraction = ΔGNC − ΔGC − (ΔGN − ΔG2.1) = ΔGNC − ΔGN − (ΔGC − ΔG2.1). It should be emphasized that ΔΔGInteraction is not the interaction energy between the N- and C-terminus per se, but only the change of interaction energy associated with activation. Because the above considerations hold for the mutant cycle consisting of the triple chimera, two double chimeras, and the single chimera whose substitution is also present in both double chimeras, our results also allow us to estimate the effect of the third region on the interaction energy of the other two regions. In the following, interaction between two intracellular regions will be termed “interaction” solely.
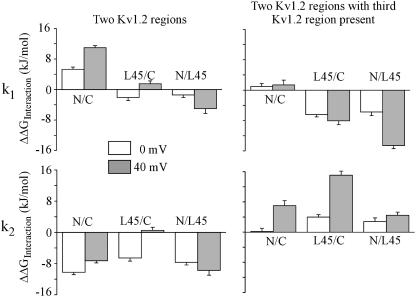
First the interaction energies for k1 are considered (Fig. 5 top). At 0 mV and with the Kv2.1 sequence in the third region, there is strong positive interaction energy only for the interaction of the N- and C-terminus. The interaction energy is enhanced at 40 mV. In the presence of the Kv1.2 S4–S5 linker this interaction is cancelled (top right; N/C). In the presence of the respective other Kv1.2 terminus, the S4–S5 linker produces negative interaction energy with either the N- or the C-terminus (top right; L45/C; N/L45). However, only the interaction with the N-terminus is noticeably voltage dependent.
FIGURE 5.
Interaction energy (ΔΔGinteraction) between mutated Kv1.2 regions in a Kv2.1 background for the change of the forward and backward rate constants of activation, k1 and k2, according to Scheme 1. The activation time course was quantified with a single time constant τm and the values for ΔΔGInteraction were calculated as described in the text. N/C, L45/C, and N/L45 indicate the interaction of N- with C-terminus, S4–S5 linker with C-terminus, and N-terminus with S4–S5 linker, respectively.
Consider now the interaction energies for k2 (Fig. 5 bottom). With the Kv2.1 sequence in the third region, the interaction energies are strongly negative at both 0 and 40 mV, except for the interaction of the S4–S5 linker and the C-terminus at 40 mV, which approximates zero. In the presence of the respective third Kv1.2 region, the interaction energy becomes mostly positive and depolarization further increases the interaction energies between both termini as well as between the C-terminus and the S4–S5 linker. In general, the interaction energies for two or three regions substituted, differ markedly less at 0 mV than at 40 mV. This result indicates that interactions between the intracellular regions are voltage dependent.
Influence of Kv1.2 N-terminus, S4–S5 linker, and C-terminus on Kv2.1 steady-state activation
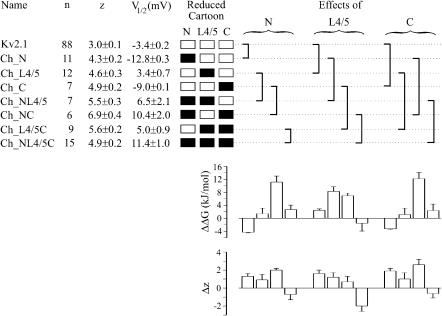
To test whether shifts of steady-state activation along the voltage axis are responsible for the dramatic slowing of activation, steady-state activation was measured and quantified by fitting a Boltzmann function with power 1, yielding the parameters V1/2 and z (see Materials and Methods). The V1/2 values of the two single chimeras, Ch_N and Ch_C, were by 9.4 and 5.5 mV, respectively, more negative whereas those of all other chimeras were by 6.8–14.8 mV more positive than for Kv2.1 channels. These shifts are much too small to explain the great slowing of activation described above. Interestingly, the equivalent gating charge z was smallest in Kv2.1 channels.
We also quantified the effects of the three regions on steady-state activation with each combination of the other two intracellular regions in terms of a difference of the free-energy difference, ΔΔG, calculated from the V1/2 values according to Li-Smerin et al. (2000)
 |
(5) |
V1/2,act, V1/2,ref, zact, and zref are the actual and reference values of V1/2 and z. Negative values of ΔΔG are caused by leftward shifts in steady-state activation and/or larger zact and indicate that the inserted Kv1.2 region has caused a relative stabilization of the open state over the closed state. The boxes in Fig. 6 illustrate the chimeras in the form of cartoons, specifying the origin of the N-terminus, the S4–S5 linker, and the C-terminus. The bar graphs below the brackets indicate the effects of the three regions on ΔΔG with each combination of the other two intracellular regions. In each group of four bars, the left-most bar indicates the effect with respect to the pure Kv2.1 background, the two bars in the middle indicate the effect with one Kv1.2 region already present, and the right-most bar indicates the effect with already two Kv1.2 regions present.
FIGURE 6.
Steady-state parameters of Kv2.1 channels and the seven single and combined chimeras containing intracellular Kv1.2 regions. The V1/2 and z values were determined with Eq. 1 (see Materials and Methods). The reduced cartoons indicate the origin of N-terminus, S4–S5 linker, and C-terminus by either open (Kv2.1) or solid (Kv1.2) boxes. The brackets to the right of the reduced cartoons indicate an effect of one of the intracellular Kv1.2 regions on steady-state properties of activation at a specific combination of the other intracellular regions. The effects on V1/2 are indicated as differences of the free-energy difference ΔΔG (Eq. 5) in the bar graph below the brackets. The effects on the equivalent gating charge z are shown as Δz in the lower bar graph. For further explanation see text.
The following results can be derived: The N- and the C-terminus generated a similar profile of ΔΔG values under all conditions (compare left with right group of bars): a negative value of ∼−4 kJ/mol with respect to the Kv2.1 background (left bar), a large positive value of ∼12 kJ/mol when the respective other Kv1.2 terminus was already present (third bar from the left), and only small values when either only the S4–S5 linker (second bar from the left) or the S4–S5 linker plus the other terminus (right bar) of Kv1.2 was/were already present. The S4–S5 linker produced large positive values of ∼8 kJ/mol when either only the N- or only the C-terminus of Kv1.2 was already present. However, the S4–S5 linker was ineffective when both termini were already present. Changes of the equivalent gating charge, Δz, inferred by the insertion of a Kv1.2 region into Kv2.1, were determined from the difference of the z values (bottom bar graph in Fig. 6). It is noticeable that the profiles of Δz for the N- and C-terminus were also similar to each other and dissimilar to that of the S4–S5 linker.
Interaction energy of intracellular Kv1.2 regions associated with steady-state activation
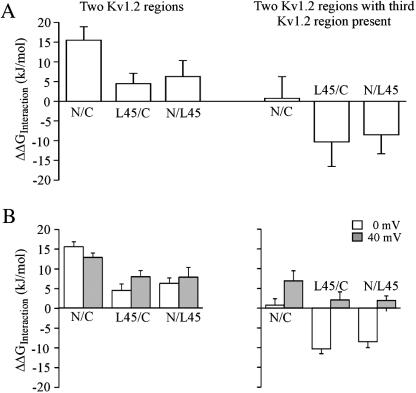
We first estimated interaction energies for pairs of intracellular regions at half-maximum steady-state activation. In analogy to the above analysis for the change of the rate constants upon activation, double-mutant cycle analysis was performed, now using the ΔΔG values obtained by Eq. 5 to calculate ΔΔGInteraction. The results for pairs of intracellular regions with the Kv2.1 sequence in the third region are shown in Fig. 7 A (left). All interaction energies are positive. The interaction between the N- and C-terminus is strong whereas that of the S4–S5 linker with the C- or N-terminus is weak. Fig. 7 A (right) shows that the interaction between the N- and C-terminus is lost in the presence of the Kv1.2 S4–S5 linker. Furthermore, in the presence of the respective other Kv1.2 terminus the interaction energy of the S4–S5 linker with either the N- or C-terminus becomes negative. The energy profiles associated with half-maximum steady-state activation resemble those calculated for k1 at 0 mV (Fig. 5).
FIGURE 7.
Interaction energy (ΔΔGInteraction) between the N-terminus, S4–S5 linker, and C-terminus associated with steady-state activation. ΔΔGInteraction was determined with the double-mutant cycle analysis. The abbreviations are explained in the legend to Fig. 5. (A) Interaction energy calculated for the voltages of half-maximum activation. ΔΔGInteraction was determined from energies obtained by Eq. 5 using the parameters in Fig. 6. (B) Interaction energy at 0 and 40 mV. ΔΔGInteraction was determined from energies calculated by Eq. 6. For further explanation see text.
We next considered the interaction energies for pairs of intracellular regions not at the same degree of steady-state activation but at equal voltage. According to Scheme 1, ΔG was calculated by
 |
(6) |
where L = k1/k2 = Po/(1 − Po) is the simplified equilibrium constant indicating the relative stability of the open channel. In analogy to the rate constants, we chose the voltages of 0 and 40 mV and computed L from Irel/(1 − Irel) by Eq. 1. As described above, ΔΔGInteraction was obtained by double-mutant cycle analysis (Fig. 7 B). At 0 mV the interaction energies are close to those calculated with the V1/2 values specific for each channel (Fig. 7 A). This result is not surprising because the V1/2 values are near 0 mV (Fig. 6). With the Kv2.1 sequence present in the third region, depolarization from 0 to 40 mV did not markedly change the interaction energies. In the presence of the respective other Kv1.2 terminus, however, the interaction of the S4–S5 linker with either the N- or C-terminus was markedly weaker at 40 mV than at 0 mV. This result further supports the notion that the S4–S5 linker interacts with either the N- or C-terminus in a voltage-dependent fashion and that this interaction depends on the nature of the other respective terminus.
DISCUSSION
The main results of this work are: 1), Replacement of either N-terminus, S4–S5 linker, or C-terminus in slowly activating Kv2.1 channels by respective regions of rapidly activating Kv1.2 channels unexpectedly slowed the exponential activation time course even further. 2), At the voltage of 0 mV, any further insertion of an intracellular Kv1.2 region produced further slowing of activation. In contrast, at the voltage of 40 mV the intracellular regions produced either slowing, no effect, or in one case acceleration of the activation time course, depending on the composition of the other intracellular regions. 3), Steady-state activation was shifted to more negative potentials by the chimeras with only the N- or C-terminus replaced whereas all other chimeras caused a shift to more positive potentials. 4), Interaction energies of the Kv1.2 N- and C-terminus were positive in the presence of the Kv2.1 S4–S5 linker. However, when the Kv1.2 S4–S5 linker was present, this interaction disappeared. The interaction of the S4–S5 linker with the N- and C-terminus was voltage dependent and depended on the nature of the other respective terminus. These results suggest that the N-terminus, the C-terminus, and the S4–S5 linker modulate activation of Kv2.1 channels and these regions interact in a voltage-dependent fashion.
The activation time course
The effects of N- and C-termini on the time course of Kv2.1 activation were voltage dependent. At 0 mV, replacement of either Kv2.1 terminus by the respective Kv1.2 terminus consistently slowed the Kv2.1 activation time course, irrespective whether the other two intracellular regions originated from Kv1.2 or Kv2.1 (Fig. 3). This suggests that the effects of the termini are independent of the origin of the other two regions. At 40 mV, however, replacement of the N-terminus did not slow Kv2.1 activation neither in the absence nor presence of the Kv1.2 C terminus (Fig. 3; Ch_N versus Kv2.1, Ch_NC versus Ch_C). On the other hand, replacement of the C-terminus exerted a strong slowing effect on Kv2.1 activation, in both the absence and presence of the Kv1.2 N-terminus (Ch_C versus Kv2.1, Ch_NC versus Ch_N). These results show that the voltage of 40 mV attenuates the slowing effect of the Kv1.2 N-terminus on Kv2.1 activation observed at 0 mV. The effects of the C-terminus, on the other hand, are preserved at 40 mV despite the fact that there is still considerable interaction between N- and C-termini (Fig. 5 left).
In the chimeras where the S4–S5 linker of Kv1.2 was present, insertion of the Kv1.2 N-terminus slowed activation at 40 mV (Fig. 5; Ch_NL4/5 versus Ch_L4/5, Ch_NL4/5C versus Ch_L4/5C) whereas insertion of the C-terminus had no slowing effect (Ch_L4/5C versus Ch_L4/5, Ch_NL4/5C versus Ch_NL4/5). This may indicate that at 40 mV the N-terminus needs the S4–S5 linker to exert a slowing effect whereas the C-terminus does not.
Energetics of activation
Previous energetic analyses of mutations on Shaker channels were conducted under the assumption of a simple two-state model (Li-Smerin et al., 2000; Yifrach and MacKinnon, 2002) although much more sophisticated kinetic models are well substantiated (e.g., Zagotta et al., 1994b; Schoppa and Sigworth, 1998). The reason for this gross simplification is that only then simple interpretations are possible. In this study on Kv2.1 channels, we followed this approach and fitted the steady-state activation versus voltage relationship by a two-state Boltzmann equation. It was therefore only consequential to assume also a single mean activation time constant, τm, although the activation time courses required biexponential functions for description. It has to be stated that all energetic estimations performed in this study, critically depend on these simplifying assumptions, in particular those obtained with the double-mutant cycle analysis.
The ΔΔG and Δz values calculated for steady-state activation were remarkably similar for both termini (Fig. 6); either Kv1.2 terminus produced negative ΔΔG values of ∼4 kJ/mol when inserted in Kv2.1 channels (Ch_N and Ch_C versus Kv2.1) and positive ΔΔG values of ∼12 kJ/mol when inserted in chimeras with the other Kv1.2 terminus present (Ch_NC versus Ch_C and Ch_N), resulting in a, respectively, large positive interaction energy ΔΔGInteraction for Kv1.2 N- and C-terminus (Fig. 7). This result suggests that the negative ΔΔG value of −6.23 kJ/mol, calculated for Kv1.2 channels with respect to Kv2.1 channels by using Eq. 5, does not simply result from the common presence of both termini, but that further channel regions are involved.
Considering the interaction energies of the Kv1.2 regions associated with the rate constants k1 and k2, it is evident that the values differ less from each other at 0 mV than at 40 mV (Fig. 5), indicative that the interaction between the three regions is similarly intensive at 0 mV and more specific at 40 mV. For k1, a great depolarization-induced shift to a more positive interaction energy was observed only for the interaction of the N- with the C-terminus when the S4–S5 linker was not substituted. For k2, a respective shift was observed for the interaction of the S4–S5 linker with the C-terminus, in either the absence or presence of the N-terminus, and of the N-terminus with the C-terminus when the S4–S5 linker was substituted. A pronounced shift to more negative interaction energies was observed in only one case for k1, for the interaction of the N-terminus with the S4–S5 linker when the C-terminus was also substituted. The other interactions were lesser voltage dependent.
Inspection of the profiles of interaction energies calculated for steady-state conditions (Fig. 7, A and B) and those obtained for the rate constants k1 and k2 (Fig. 5) showed that only those for steady-state activation at either V1/2 or 0 mV and that for k1 at 0 mV were similar. This result suggests that activation at 0 mV essentially involves changed intramolecular interactions associated with the forward reaction (k1 in Scheme 1) whereas at 40 mV also the backward reaction (k2) is involved.
Relations to previous work
VanDongen and co-workers (1990) were the first to suggest an interaction between N- and C-termini in Kv2.1 channels. They observed a slowed activation in N-terminally deleted Kv2.1 channels and reversal of this slowing effect when a sizable part of the C-terminus had been additionally deleted. By itself, however, the C-terminal deletion was without effect on Kv2.1 activation kinetics. An interaction between the Kv2.1 termini was also suggested by the result that phosphorylation of the Kv2.1 C-terminus by protein kinase A depends on the N-terminus (Wilson et al., 1994). More detailed insight into this interaction came from recent results by Ju and co-workers (2003) who observed effects on the activation time course by two residues in the N-terminal T1 domain (residues 67 and 75) and by up to 15 residues in a C-terminal activation (CTA) domain. The authors presented evidence that these effects are mediated by an interaction between the N-terminal residues and the CTA domain. They concluded that not only the T1 domain but also the CTA domain may contribute to the hanging gondola below the membrane. It was proposed that the T1 domain might affect activation by changing first the conformation of the CTA domain and thereby the one of the S6 segment, which lines the pore. The authors also concluded that the effective residues in the termini cannot interact with the S4 segment or its nearby intracellular loops. Our data, however, also suggest interactions between the S4–S5 linker and the termini.
Also in Kv1.1 channels an interaction between N- and C-termini has been hypothesized based on the observation that oxidizing conditions promote the formation of a disulfide bond between an N-terminal cysteine, close to the tetramerization T1 domain, and a C-terminal cystein, close to the S6 segment (Schulteis et al., 1996). The fact that interactions between N- and C-termini are not only present in the Kv2 subfamily but also in the Kv1 subfamily might indicate that they are generally important among Kv channels.
Another observation in our study was that the equivalent gating charge z of all chimeras exceeded that in Kv2.1 channels, irrespective of whether the V1/2 values were shifted to more positive or negative voltages (cf. Fig. 6). This result deviates from those observed for a multitude of pore mutations in Shaker channels where z decreased with less negative V1/2 (Yifrach and MacKinnon, 2002). A possible interpretation of this result is that the Kv1.2 regions indeed confer the property of a steeper steady-state activation to Kv2.1 channels whereas the kinetics of activation are hampered by additional interactions.
Perspectives
Although the slowing effects and interaction energies studied herein were systematic, our results do not unequivocally prove, that the respective cytosolic regions indeed contribute to the activation time course in wild-type Kv2.1 channels. It is conceivable that the Kv2.1 channel molecules have been optimized during evolution to such a high degree that all rate limitation of the activation process is caused by reactions in the core region. Nevertheless, the fact that manipulations on the intracellular channel regions can influence the activation kinetics, strongly suggests that these regions are targets for the control of the activation time course, e.g., via the cytoskeleton or by the binding of other cytosolic or peripheral membrane proteins.
Acknowledgments
We thank S. Bernhardt, A. Kolchmeier, K. Schoknecht, and B. Tietsch for excellent technical assistance.
This work was supported by the grant Be1250/4-3 of the Deutsche Forschungsgemeinschaft to K.B.
References
- Cha, A., and F. Bezanilla. 1997. Characterizing voltage-dependent conformational changes in the Shaker K+ channel with fluorescence. Neuron. 19:1127–1140. [DOI] [PubMed] [Google Scholar]
- Chiara, M. D., F. Monje, A. Castellano, and J. Lopez-Barneo. 1999. A small domain in the N terminus of the regulatory alpha-subunit Kv2.3 modulates Kv2.1 potassium channel gating. J. Neurosci. 19:6865–6873. [DOI] [PMC free article] [PubMed] [Google Scholar]
- Cushman, S. J., M. H. Nanao, A. W. Jahng, D. DeRubeis, S. Choe, and P. J. Pfaffinger. 2000. Voltage dependent activation of potassium channels is coupled to T1 domain structure. Nat. Struct. Biol. 7:403–407. [DOI] [PubMed] [Google Scholar]
- del Camino, D., and G. Yellen. 2001. Tight steric closure at the intracellular activation gate of a voltage-gated K+ channel. Neuron. 32:649–656. [DOI] [PubMed] [Google Scholar]
- Glasstone, S., K. J. Laidler, and H. Eyring. 1941. The Theory of Rate Processes. McGraw-Hill, New York.
- Heginbotham, L., and R. MacKinnon. 1992. The aromatic binding site for tetraethylammonium ion on potassium channels. Neuron. 8:483–491. [DOI] [PubMed] [Google Scholar]
- Ho, S. N., H. D. Hunt, R. M. Horton, J. K. Pullen, and L. R. Pease. 1989. Site-directed mutagenesis by overlap extension using the polymerase chain reaction. Gene. 77:51–59. [DOI] [PubMed] [Google Scholar]
- Horovitz, A. 1996. Double-mutant cycles: a powerful tool for analyzing protein structure and function. Fold. Des. 1:R121–R126. [DOI] [PubMed] [Google Scholar]
- Jiang, Y., A. Lee, J. Chen, V. Ruta, M. Cadene, B. T. Chait, and R. MacKinnon. 2003a. X-ray structure of a voltage-dependent K+ channel. Nature. 423:33–41. [DOI] [PubMed] [Google Scholar]
- Jiang, Y., V. Ruta, J. Chen, A. Lee, and R. MacKinnon. 2003b. The principle of gating charge movement in a voltage-dependent K+ channel. Nature. 423:42–48. [DOI] [PubMed] [Google Scholar]
- Ju, M., L. Stevens, E. Leadbitter, and D. Wray. 2003. The roles of N-and C-terminal determinants in the activation of the Kv2.1 potassium channel. J. Biol. Chem. 278:12769–12778. [DOI] [PubMed] [Google Scholar]
- Larsson, H. P., O. S. Baker, D. S. Dhillon, and E. Y. Isacoff. 1996. Transmembrane movement of the Shaker K+ channel S4. Neuron. 16:387–397. [DOI] [PubMed] [Google Scholar]
- Li, M., Y. N. Jan, and L. Y. Jan. 1992. Specification of subunit assembly of the hydrophilic amino-terminal domain of the Shaker potassium channel. Science. 257:1225–1230. [DOI] [PubMed] [Google Scholar]
- Liman, E. R., P. Hess, F. Weaver, and G. Koren. 1991. Voltage-sensing residues in the S4 region of a mammalian K+ channel. Nature. 353:752–756. [DOI] [PubMed] [Google Scholar]
- Liman, E. R., J. Tytgat, and P. Hess. 1992. Subunit stoichiometry of a mammalian K+ channel determined by construction of multimeric cDNAs. Neuron. 9:861–871. [DOI] [PubMed] [Google Scholar]
- Li-Smerin, Y., D. H. Hackos, and K. J. Swartz. 2000. A localized interaction surface for voltage-sensing domains on the pore domain of a K+ channel. Neuron. 25:411–423. [DOI] [PubMed] [Google Scholar]
- Logothetis, D. E., S. Movahedi, C. Satler, K. Lindpaintner, and B. Nadal-Ginard. 1992. Incremental reductions of positive charge within the S4 region of a voltage-gated K+ channel result in corresponding decreases in gating charge. Neuron. 8:531–540. [DOI] [PubMed] [Google Scholar]
- Lu, Z., A. M. Klem, and Y. Ramu. 2002. Coupling between voltage sensors and activation gate in voltage-gated K+ channels. J. Gen. Physiol. 120:663–676. [DOI] [PMC free article] [PubMed] [Google Scholar]
- MacKinnon, R. 1991. Determination of the subunit stoichiometry of a voltage-activated potassium channel. Nature. 350:232–235. [DOI] [PubMed] [Google Scholar]
- Mathur, R., J. Zheng, Y. Yan, and F. J. Sigworth. 1997. Role of the S3–S4 linker in Shaker potassium channel activation. J. Gen. Physiol. 109:191–199. [DOI] [PMC free article] [PubMed] [Google Scholar]
- McCormack, K., M. A. Tannouye, L. E. Iverson, J.-W. Lin, M. Ramaswami, T. McCormack, J. T. Campanelli, M. K. Mathew, and B. Rudy. 1991. A role for hydrophobic residues in the voltage-dependent gating of Shaker K+ channels. Proc. Natl. Acad. Sci. USA. 88:2931–2935. [DOI] [PMC free article] [PubMed] [Google Scholar]
- Mildvan, A. S., D. J. Weber, and A. Kuliopulos. 1992. Quantitative interpretations of double mutations of enzymes. Arch. Biochem. Biophys. 294:327–340. [DOI] [PubMed] [Google Scholar]
- Milligan, C. J., and D. Wray. 2000. Local movement in the S2 region of the voltage-gated potassium channel hKv2.1 studied using cysteine mutagenesis. Biophys. J. 78:1852–1861. [DOI] [PMC free article] [PubMed] [Google Scholar]
- Minor, D. L., Jr., Y.-F. Lin, B. C. Mobley, A. Avelar, Y. N. Jan, L. Y. Jan, and J. M. Berger. 2000. The polar T1 interface is linked to conformational changes that open the voltage-gated potassium channel. Cell. 102:657–670. [DOI] [PubMed] [Google Scholar]
- Papazian, D. M., L. C. Timpe, Y. N. Jan, and L. Y. Jan. 1991. Alteration of voltage-dependence of Shaker potassium channel by mutations in the S4 sequence. Nature. 349:305–310. [DOI] [PubMed] [Google Scholar]
- Papazian, D. M., X. M. Shao, S. A. Seoh, A. F. Mock, Y. Huang, and H. D. Wainstock. 1995. Electrostatic interactions of S4 voltage sensor in Shaker K+ channel. Neuron. 14:1293–1301. [DOI] [PubMed] [Google Scholar]
- Perozo, E., L. Santacruz Toloza, E. Stefani, F. Bezanilla, and D. M. Papazian. 1994. S4 mutations alter gating currents of Shaker K channels. Biophys. J. 66:345–354. [DOI] [PMC free article] [PubMed] [Google Scholar]
- Planells-Cases, R., A. V. Ferrer Montiel, C. D. Patten, and M. Montal. 1995. Mutation of conserved negatively charged residues in the S2 and S3 transmembrane segments of a mammalian K+ channel selectively modulates channel gating. Proc. Natl. Acad. Sci. USA. 92:9422–9426. [DOI] [PMC free article] [PubMed] [Google Scholar]
- Schoppa, N. E., and F. J. Sigworth. 1998. Activation of Shaker potassium channels. III. An activation gating model for wild-type and V2 mutant channels. J. Gen. Physiol. 111:313–342. [DOI] [PMC free article] [PubMed] [Google Scholar]
- Scholle, A., R. Koopmann, T. Leicher, J. Ludwig, O. Pongs, and K. Benndorf. 2000. Structural elements determining activation kinetics in Kv2.1. Receptors Channels. 7:65–75. [PubMed] [Google Scholar]
- Schulteis, C. T., N. Nagaya, and D. M. Papazian. 1996. Intersubunit interaction between amino- and carboxyl-terminal cysteine residues in tetrameric Shaker K+ channels. Biochemistry. 35:12133–12140. [DOI] [PubMed] [Google Scholar]
- Seoh, S. A., D. Sigg, D. M. Papazian, and F. Bezanilla. 1996. Voltage-sensing residues in the S2 and S4 segments of the Shaker K+ channel. Neuron. 16:1159–1167. [DOI] [PubMed] [Google Scholar]
- Sheng, M., Y. J. Liao, Y. N. Jan, and L. Y. Jan. 1993. Presynaptic A current based on heteromultimeric K+ channels detected in vivo. Nature. 365:72–75. [DOI] [PubMed] [Google Scholar]
- Shieh, C.-C., K. G. Klemig, and G. E. Kirsch. 1997. Role of transmembrane segment S5 on gating of voltage-dependent K+ channels. J. Gen. Physiol. 109:767–778. [DOI] [PMC free article] [PubMed] [Google Scholar]
- Starace, D. M., E. Stefani, and F. Bezanilla. 1997. Voltage-dependent proton transport by the voltage sensor of the Shaker K+ channel. Neuron. 19:1319–1327. [DOI] [PubMed] [Google Scholar]
- Tiwari-Woodruff, S. K., C. T. Schulteis, A. F. Mock, and D. M. Papazian. 1997. Electrostatic interactions between transmembrane segments mediate folding of Shaker K+ channel subunits. Biophys. J. 72:1489–1500. [DOI] [PMC free article] [PubMed] [Google Scholar]
- VanDongen, A. M., G. C. Frech, J. A. Drewe, R. H. Joho, and A. M. Brown. 1990. Alteration and restoration of K+ channel function by deletions at the N- and C-termini. Neuron. 5:433–443. [DOI] [PubMed] [Google Scholar]
- Wells, J. A. 1990. Additivity of mutational effects in proteins. Biochemistry. 29:8509–8517. [DOI] [PubMed] [Google Scholar]
- Wilson, G., C. A. O'Neill, A. Sivaprasadaro, J. B. C. Findlay, and D. Wray. 1994. Modulation by protein kinase A of a cloned rat brain potassium channel expressed in Xenopus oocytes. Pflugers Arch. 428:186–193. [DOI] [PubMed] [Google Scholar]
- Yellen, G. 2002. The voltage-gated potassium channels and their relatives. Nature. 419:35–42. [DOI] [PubMed] [Google Scholar]
- Yifrach, O., and R. MacKinnon. 2002. Energetics of pore opening in a voltage-gated K+ channel. Cell. 111:231–239. [DOI] [PubMed] [Google Scholar]
- Yusaf, S. P., D. Wray, and A. Sivaprasadarao. 1996. Measurement of the movement of the S4 segment during the activation of a voltage-gated potassium channel. Pflugers Arch. 433:91–97. [DOI] [PubMed] [Google Scholar]
- Zagotta, W. N., T. Hoshi, and R. W. Aldrich. 1994a. Shaker potassium channel gating. II: Transitions in the activation pathway. J. Gen. Physiol. 103:279–319. [DOI] [PMC free article] [PubMed] [Google Scholar]
- Zagotta, W. N., T. Hoshi, and R. W. Aldrich. 1994b. Shaker potassium channels gating. III: Evaluation of kinetic models for activation. J. Gen. Physiol. 103:321–362. [DOI] [PMC free article] [PubMed] [Google Scholar]


