Abstract
Optical tweezers are a powerful tool for the study of single biomolecules. Many applications require that a molecule be held under constant tension while its extension is measured. We present two schemes based on scanning-line optical tweezers to accomplish this, providing all-optical alternatives to force-clamp traps that rely on electronic feedback to maintain constant-force conditions for the molecule. In these schemes, a laser beam is rapidly scanned along a line in the focal plane of the microscope objective, effectively creating an extended one-dimensional optical potential over distances of up to 8 μm. A position-independent lateral force acting on a trapped particle is created by either modulating the laser beam intensity during the scan or by using an asymmetric beam profile in the back focal plane of the microscope objective. With these techniques, forces of up to 2.69 pN have been applied over distances of up to 3.4 μm with residual spring constants of <26.6 fN/μm. We used these techniques in conjunction with a fast position measurement scheme to study the relaxation of λ-DNA molecules against a constant external force with submillisecond time resolution. We compare the results to predictions from the wormlike chain model.
INTRODUCTION
Laser tweezers have become a popular and powerful tool to study a wide range of biomolecular systems. Their principal application is to probe the mechanics of molecular processes through the application of external forces. A large number of studies have focused on molecular motors because they couple mechanical and chemical principles of action. Typical examples of such molecular motors that have been studied with laser tweezers are kinesin and myosin, which are motor molecules that move along microtubules and actin filaments, respectively (Svoboda et al., 1993, Finer et al., 1994). Motors that move processively along a DNA molecule have also been prime objects for such studies; RNA polymerases, exonucleases, and the portal motor that packs the bacteriophage Φ29 capsid are good examples (Wang et al., 1998; Perkins et al., 2003; Smith et al., 2001).
In a typical single-molecule experiment the molecular motor or its substrate moves while the measurements of interest are performed. The motor or the substrate is attached to a microsphere, which in turn is held at a fixed location at the center of the laser focus of the optical trap. This kind of trap cannot accommodate much motion of the motor, as any displacement of the particle from the center of the trap leads to a rapid increase in the restoring force. The optical tweezers are effectively imposing constant-extension conditions upon molecules that are less stiff than the trap itself. Therefore, in early measurements with optical tweezers on molecular motors the microscope stage was manually moved whenever the force exceeded a certain threshold. This kept the particle in or near the center of the trap (Svoboda et al., 1993) and permitted tracking of the motion of the motor under an approximately constant load.
This manual tracking of the particle position was later automatized using analog or computer-controlled feedback circuits. The latest generation of these force-clamp systems has become quite complex and sophisticated. An instrument may feature computer-controlled laser beam positioning, a three-axis piezo-actuated microscope stage, and separate laser sources for trapping, particle position measurement, and fluorescence excitation (Lang et al., 2002). Despite the advances in design and implementation of these force-clamp schemes, they have drawbacks. The use of an active feedback system limits the response time of the system. The response time is determined by the combined compliance of the molecule-microsphere complex in the optical potential, and the speed of the electronic feedback circuit (Gittes and Schmidt, 1998). Although improvements in the electronic detection techniques can alleviate the latter, the former is a harder problem to overcome in these types of measurements. If the molecule under study abruptly changes in length, for instance, due to a rapid stepping motion of a molecular motor or the binding of a protein, the load on the molecule increases transiently until the feedback trap system responds. As a result, the molecule does not experience a constant force when the event of interest occurs, which can give rise to artifacts in the measurements.
To overcome these limitations we have developed an all-optical constant-force optical trapping scheme that applies a constant light-induced force on the trapped particle, irrespective of its position. It eliminates the need for any electronic feedback, and is thus not only easier to implement and use, but also avoids all artifacts inherently associated with active force clamps.
PRINCIPLES OF OPERATION
The basic principle behind our constant-force optical tweezing techniques is to use the one-dimensionally flat optical potential generated by scanning-line laser tweezers, and modify this potential either through an intensity modulation or through an additional scattering force such that a constant lateral force is exerted on a trapped particle, irrespective of its location in the optical potential.
Scanning-line laser tweezers differ from conventional single-beam optical tweezers in that the laser focus is rapidly scanned along a line in the focal plane of the microscope. If the scanning frequency exceeds the relaxation time of the trap, the trapped particle cannot follow the scan motion and effectively sees an optical potential that corresponds to the time average of the laser power distribution in the focal plane (Faucheux et al., 1995b). If the intensity of the scanned beam is constant, the particle is free to diffuse without external force along the scan line, but is trapped in a narrow optical potential in the other two dimensions. Such scanning-line optical tweezers that effectively impose zero-force conditions upon the system of interest have been used mostly for the study of weak interactions in complex fluids, where the intraparticle forces are much lower than the forces exerted by conventional static optical traps. Typical examples include measurements of entropic interactions in binary colloidal suspensions or between adsorbed polymer brushes (Crocker et al., 1998; Owen et al., 2001).
To make scanning-line optical tweezers suitable for studies of single biomolecules under constant tension, the one-dimensionally flat optical potential needs to be modified to provide that additional lateral force on the trapped particle. In this article, we demonstrate how two different methods of providing such a lateral force can be used to extend a λ-bacteriophage DNA molecule and hold it under constant tension while its extension is measured.
Amplitude-modulation mode
The first of these force-generating methods produces an optical potential in the form of a linear ramp instead of the flat trough through a synchronous amplitude modulation of the laser beam during the scan. Spatially and temporally modulated optical profiles that are generated by scanning-line optical tweezers have previously been used as a thermal ratchet to transport trapped particles along the scan line (Faucheux et al., 1995a). Such a thermal ratchet has the advantage that there is no fundamental limitation to the length of the scan line over which particles can be transported. Thermal ratchets, however, cannot work in situations where a significant external force opposes the motion of the particle. They are dynamic in nature and rely on a finite diffusion current against that external force.
Instead, we use only a single, static ramp potential to provide an optical potential gradient to exert a lateral force on the trapped particle. This technique has its limitations as the maximum attainable force is determined by the maximal laser intensity and the length of the scan line. We have obtained forces of up to 365 fN over a length of 3.8 μm using this technique.
Asymmetric beam mode
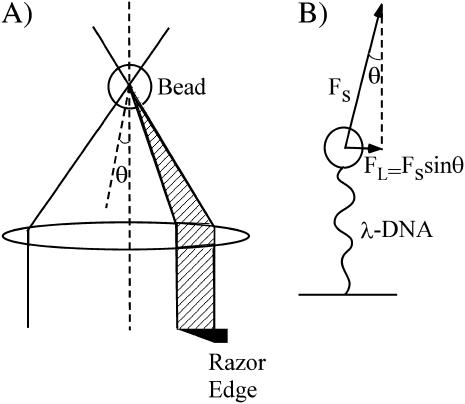
Higher forces can be generated with a different technique that utilizes a lateral component in the scattering force that arises when a laser beam with an asymmetric beam profile in the back focal plane of the microscope objective is used to generate the optical line potential. This technique exploits that a small fraction of the incident laser light is scattered back from the microsphere. This gives rise to a corresponding scattering force in the direction of the incident laser beam. When the incident laser beam is normal to the focal plane, the resultant scattering force is normal to the scan line where the optical potential is steep. Thus, the scattering force results only in a minute displacement of the microsphere out of the focal plane. If, on the other hand, part of the laser beam is blocked in the back focal plane of the microscope objective, as shown in Fig. 1, the scattering force acquires a lateral component and moves the microsphere laterally along the scan line (Liesfeld et al., 2003).
FIGURE 1.
(A) Ray optics model of the asymmetric beam scanning-line optical tweezers. The partial blockage of the beam in the back focal plane of the microscope objective results in a small angle Θ between the incident laser beam and normal incidence on the focal plane. The radiation pressure stemming from the back reflection from the microsphere acquires a lateral component Fs sin Θ. This force pushes the particle to the side where the beam is blocked. (B) A schematic depiction of the pull exerted by the scattering force onto a microsphere that is tethered to the microscope coverglass by a λ-DNA molecule.
MATERIALS AND METHODS
Scanning-line laser tweezer apparatus
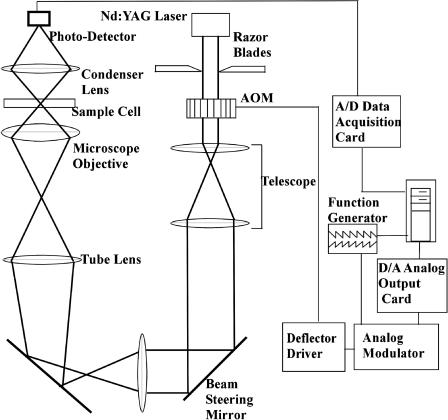
The optical portion of our scanning-line laser tweezer apparatus is shown in Fig. 2 and described by Liesfeld et al. (2003). It consists of an Nd:YAG laser (λ = 1064 nm), an acousto-optic modulator (DTD274HA6, IntraAction, Bellwood, IL), a telescope system, an inverted microscope (Axiovert M-135, Zeiss, Thornwood, NY) with a high-numerical-aperture objective (Plan Neofluar 100X 1.3 Oil, Zeiss), and a condenser lens with a fast photo diode as detector. The laser beam can be shaped with a pair of razor blades that cut off part of the beam. This shaped beam profile is imaged through the telescope system onto the back focal plane of the microscope objective. At the same time, the telescope images the acousto-optic modulator and the beam steering mirror into the same plane, converting an angular defection by the modulator or mirror into a lateral displacement of the focus of the laser beam in the focal plane of the objective. The focal plane is located in the sample cell, 2.0 μm above the coverslip. The location of the focal plane was regularly confirmed by trapping a particle in the laser focus and measuring the distance required to move the microscope objective such that the particle touches the coverslip. The sample cell is mounted on a motorized and computer-controlled translation stage.
FIGURE 2.
Schematic diagram of the scanning-line optical tweezer setup. The laser beam is deflected by a computer-controlled acousto-optic modulator (AOM) and imaged by a telescope system onto the back focal plane of a microscope objective. The beam profile in this plane can be controlled by a pair of knife edges in a conjugate plane. The laser beam is focused into the sample cell by a high-numerical-aperture microscope objective. A condenser lens images the transmitted laser light onto a fast photo diode. A fast data-acquisition system measures the transmitted light intensity synchronously with the beam deflection.
On the other side of the sample cell, the transmitted laser light is collected with a condenser lens and imaged onto a fast photo diode (SD 445-11-21-305, Advanced Photonics, Camarillo, CA) that is used to determine the particle position in the trap (Nambiar and Meiners, 2002). A reverse-bias voltage of 38.0 volts is applied to the photo diode to increase its speed in the infrared spectrum and to avoid unintended filtering (Berg-Sørensen et al., 2003). In addition, the particle position is also monitored by video microscopy. The trapped particle is illuminated in bright-field mode through the condenser lens, and imaged through the microscope objective onto a charge-coupled device camera. The charge-coupled device camera is oriented such that its horizontal x axis corresponds to the direction of the scan line in the focal plane.
The electronic portion of the scanning-line optical tweezer system consists of the scan generator and the data-acquisition system. At the heart of the scan generator is a computer-controlled two-channel arbitrary waveform generator (Tektronix TDS 210, Beaverton, OR) that generates the signals for the deflection and amplitude modulation during the scan. These signals are modulated by computer-controlled amplitude and offset modulation circuitry, which allows us to rapidly switch between the scanning-line and a conventional single-spot trapping mode without losing the particle during the switch-over. The outputs of the modulation circuitry in turn control the frequency and amplitude of an RF driver (DE-272, IntraAction), which changes the amplitude and deflection angle of the laser beam through the acousto-optic modulator. The data-acquisition electronics for the fast position measurement scheme consists of a fast amplifier for the photo-diode signal with a bandwidth of 10 MHz, and an A/D converter card (CompuScope 14100, Gage, Montreal, Canada). The converter card is synchronized with the scan generator, and records a frame of 500 data points per scan. The data are stored for offline reduction and analysis.
Sample preparation
λ-DNA (Gibco BRL, Gaithersburg, MD) is labeled at one end with biotin and at the other end with digoxigenin (DIG). This is accomplished by enzymatic incorporation of labeled dUTP nucleotides (Roche Diagnostics, Indianapolis, IN) into the overhanging ends of the DNA (Zimmermann and Cox, 1994). The doubly end-labeled DNA is subsequently attached to streptavidin-coated polystyrene microspheres (0.95-μm diameter, Bangs Laboratories, Fishers, IN) through a 4-h incubation at room temperature in a TE-NaCl buffer (10 mM TrisCl, 1 mM EDTA, 10 mM NaCl, at pH 8.0). The stoichiometric ratio between DNA molecules and microspheres is kept well below one to ensure that the vast majority of microsphere tethers consist of only a single DNA molecule.
Flow cells are used to attach the DNA-microsphere constructs to a glass surface. The cells are constructed of piranha solution (1 part H2O2, 2 parts H2SO4) cleaned microscope coverglasses and slides with a 100-μm-thick adhesive tape spacer in between. Reagents are introduced into the flow cell through small holes in the microscope slide. To provide a suitably modified surface for the attachment of the DNA-bead constructs, a 0.025 μg/μl solution of polyclonal sheep anti-DIG) antibodies (Roche Diagnostics, Indianapolis, IN) in PBS (8 mM Na2PO4, 1.5 mM KHPO4, 2.7 mM KCl, 130 mM NaCl, pH 7.4) is introduced into the flow cell and incubated at room temperature for 3 h, allowing the antibodies to adsorb nonspecifically on the glass surfaces. Subsequently, the flow cell is thoroughly flushed with a 0.10 mg/ml solution of α-casein (Hannah Research Institute, Ayr, UK) and 0.1% (w/v) Tween 20 in TE-NaCl buffer. The added blocking agents help to prevent any nonspecific adsorption of the DNA on the glass surfaces. Then, the flow cell is filled with the DNA-microsphere construct solution and incubated overnight at room temperature on a rotating rack. Finally, extraneous and weakly bound microspheres and DNA molecules are flushed from the sample cell with ample TE-NaCl buffer containing 0.1% (w/v) Tween 20.
The sample cell is mounted on the translation stage of the inverted microscope at the center of the optical tweezer apparatus. The integrity of each DNA tether is verified by measuring its maximum extension using a stationary laser trap to control for nonspecific adsorption of the DNA to the protein-coated coverglass or microsphere surfaces. DNA tethers that cannot be stretched to at least 97% of the nominal contour length of 16.4 μm are rejected.
Data reduction
The data collected for all experiments are the position of the tethered microsphere in the optical line potential. These position measurements are performed either by video analysis of the microscopic image of the microsphere, or by analyzing the transmitted-light data from the photo diode. In both schemes, vast amounts of raw data are collected, which need to be reduced to simple position data for further analysis.
For the video analysis, the video stream is digitized and deinterlaced to obtain a sequence of images at a frame rate of 60 frames per second. From the first image of the sequence, a template pattern of a trapped microsphere was defined, and a pattern-matching algorithm from a commercial software package (LabVIEW 6.1 with IMAQ vision 5.0, National Instruments, Austin, TX) was used to locate the center of the microsphere relative to its position in the first frame in all subsequent frames. Together with the calibration of the microscope and image acquisition system the relative motion of the microsphere along the scan line as a function of time is obtained.
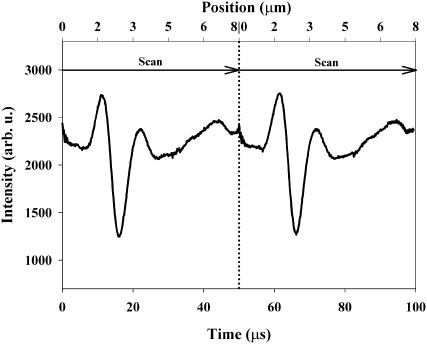
The data from the fast position measurements are analyzed following the procedure discussed elsewhere (Nambiar and Meiners, 2002). In brief, a background is subtracted from the 500 data points that measure the transmitted laser light during each scan and the minimum is identified. A typical trace of the transmitted laser light during a scan with a microsphere trapped in the potential is shown in Fig. 3. A parabolic function is fitted to a window of 20 points around this minimum to provide a more accurate determination of the location of this minimum, using the built-in “peakfinder” function in LabVIEW. The location of the minimum is then converted to the position of the microsphere along the scan line using the known scan length of 8 μm, scan rate of 20 kHz, and data-acquisition rate of 10 MHz. This procedure is repeated for every 500-point frame, yielding the position of the microsphere as a function of time with a time resolution of 50 μs and an estimated spatial resolution of 50 nm.
FIGURE 3.
Intensity of the transmitted laser light as a function time and position during the scan. The pronounced dip occurs when the scanning laser beam hits the trapped microsphere. The position of the microsphere in the potential is determined from the timing of the minimum with respect to the scan.
Data analysis
The data analysis consists of procedures to convert the measured positions of the microsphere into extension data for the λ-DNA molecule. These extension data yield in turn the forces that act upon the microsphere in the optical potential as a function of position along the scan line. These data are used to characterize the optical potential and the performance of the constant-force optical trapping scheme.
To determine the extension of the DNA molecule, the location of the attachment point on the coverslip needs to be accurately known. For this aim, 2500 video frames of the tethered microsphere are recorded in the absence of any optical potential. The center of the microsphere is determined for each frame, and the average is considered the location of the attachment point. This attachment point is referenced to a different microsphere that is stuck on the coverglass in the same field of view. This allows us to track any subsequent motion of the microscope stage by following the immobile bead, and infer the location of the DNA attachment point from its position relative to the stuck bead.
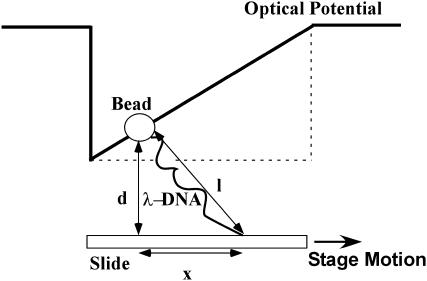
In the presence of the optical forces, the DNA molecule is extended. To determine the extension of the DNA molecule, the center of the tethered microsphere is determined for each video frame. Together with the information about the location of the DNA attachment point we obtain the length of the projection of the extended DNA-microsphere construct in the plane of the coverslip. From this apparent extension x, and the geometry of our experiment where the microsphere is trapped at a depth d above the coverslip as shown in Fig. 4, we obtain the actual extension E of the DNA molecule from
 |
(1) |
where rb stands for the radius of the microsphere.
FIGURE 4.
Sketch of a microsphere tethered to a glass coverslip by a λ-DNA molecule, in an optical ramp-type potential. The slide is mounted on a piezo-actuated microscope stage that is moved against the optical force acting on the particle. The extension of the DNA molecule is used to determine the magnitude of the optical force, taking the geometry above into account.
The force associated with extending the DNA molecule to a length E can be calculated using the force-extension relationship for a wormlike chain (Marko and Siggia, 1995),
 |
(2) |
where lp stands for the persistence length of the molecule and L0 for its nominal contour length. For λ-DNA under typical buffer conditions the corresponding numbers used in our analysis are lp = 50 nm and L0 = 16.4 μm. To find the lateral optical force that the scanning-line tweezers exert on the microsphere as a function of position, the restoring force of the DNA molecule is projected onto the focal plane,
 |
(3) |
The fast position measurements based on the transmitted laser light intensity are analyzed in a similar fashion. The attachment point is again determined by analyzing a sequence of 2500 video frames of the tethered microsphere without an optical potential. Then, the DNA molecule is extended with a stationary trap, and the position of the microsphere measured by video image analysis. Then the optical potential is abruptly changed from the stationary trap to the scanning-line trap using the amplitude and offset modulation circuit described above to control the acousto-optic modulator. The position measurement taken during the first scan is equated with the previous video measurement, and all subsequent position measurements are referenced to this starting point. The extension of the DNA molecule is again calculated using Eq. 1, and if an analysis in terms of forces is desired, the prescription described above for the video position measurements can be followed.
RESULTS AND DISCUSSION
The lateral optical forces acting onto the microsphere along the scan line are measured as a function of position for both the amplitude-modulation and asymmetric-beam mode. For this aim, the surface-tethered microsphere is moved from one end of the scan line to the other by moving the coverslip to which the DNA tether is attached. From the extension of the DNA molecule the force acting on the microsphere is inferred. From the residual variation of the force as a function of position along the scan line, the quality of the constant-force trap is assessed. Finally, an optical ramp potential is used to study the relaxation of an extended DNA-microsphere construct with high temporal resolution.
Amplitude-modulation mode measurements
A ramp-like optical potential was generated by modulating the laser beam amplitude synchronously with the scanning motion. As the potential changes linearly with position, the force acting on a trapped particle remains constant along the scan line. Its magnitude is determined by the depth of the modulation.
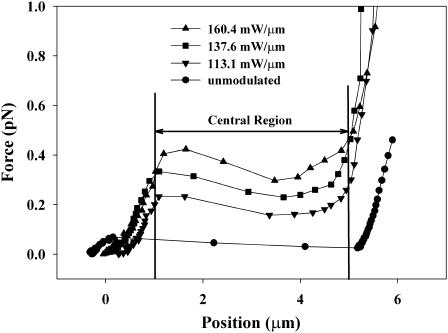
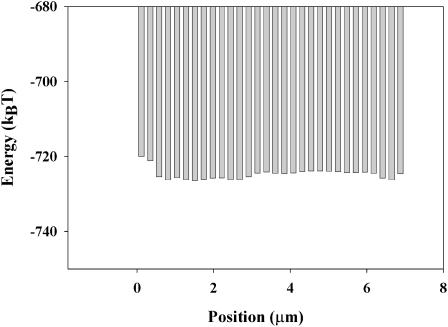
Fig. 5 shows the force exerted on a trapped particle as a function of position along the scan line, as determined from the extension of an attached DNA molecule. The force measured in the central region of the scan line increases with increasing modulation depth. When the laser beam intensity going into the microscope is modulated at a rate of 160.4 mW/μm, as measured in the back focal plane of the microscope objective, an average force of 365 fN is achieved. In general, the force remains fairly constant over the central 3.8 μm of the scan. Deviations from a perfectly flat profile are determined by fitting a straight line to the forces as a function of position. The slope of the regression line yields the effective residual spring constant of the optical potential. It is <5.3 fN/μm for a 160.4mW/μm modulation. Table 1 shows the forces and residual spring constants for different modulation depths. We attribute the imperfections in the optical potential that give rise to these deviations to the fact that the diffraction efficiency of the acousto-optic modulator varies with the deflection angle and thus superimposes another slight intensity modulation on top of the desired triangular ramp. In addition, the trap strength varies slightly with position in the focal plane due to aberrations in the imaging system. The variations of the trap stiffness along the scan line are minimized through careful alignment of all optical components and the acousto-optic modulator. This alignment and the corresponding imperfections in the optical potential were characterized by releasing a microsphere repeatedly at different points in the unmodulated potential and observing its Brownian motion along the scan line. From the probability distribution of the particle position, the shape of the optical potential is calculated. Fig. 6 shows the shape of the optical potential that suggests the optical forces of up to 20 fN are acting on the particle. Local distortions in the flat potential without any modulation were also characterized by measuring the extension of a DNA molecule between the microsphere and the coverslip in the same way the ramp potentials were mapped. The highest force measured in the central region of the potential from these imperfections of the potential was 33 fN.
FIGURE 5.
Optical forces acting on a microsphere in an amplitude-modulated scanning-line laser trap. The forces associated with different modulation depth are determined from the extension of a λ-DNA molecule that tethers the microsphere to the coverglass. The central 4-μm-wide region of the optical potential exhibits relatively constant forces, whose averages are calculated for this region and tabulated in Table 1. Outside this central region, the edges of the optical potential become visible as either disappearing or strongly increasing forces.
TABLE 1.
Forces obtained with an amplitude-modulated optical ramp potential
| Modulation (mW/μm) | Average force (fN) | Spring constant (fN/μm) |
|---|---|---|
| 0 | 33.0 | 5.8 |
| 113.1 | 192.2 ± 13.1 | 6.0 |
| 137.6 | 274.3 ± 22.3 | 4.6 |
| 160.4 | 350.6 ± 20.9 | 5.3 |
The average force is determined over a 4-μm-wide central region of the potential. The residual spring constant as a measure for the deviation from a perfectly linear potential is obtained from a linear regression in that region. Averages over different molecules together with statistical errors are shown where applicable.
FIGURE 6.
Potential energy of a microsphere in an unmodulated scanning-line trap. Potential differences within the trap were determined from the probability distribution of the position of a diffusing bead. The offset is estimated from the stiffness of an equivalent stationary trap.
Asymmetric beam mode measurements
To achieve higher forces than those that can be obtained with the amplitude modulation of the laser beam during the scan, we exploit a lateral scattering force stemming from an asymmetric beam profile in the back focal plane of the microscope objective. The laser beam is partially blocked with a razor blade to yield a truncated Gaussian profile, which is imaged onto the back focal plane of the objective. This results in an off-normal incidence of the laser beam on the trapped microsphere, in turn providing a lateral component to the scattering force that pushes the microsphere toward one end of the optical line potential, as discussed in the Materials and Methods section.
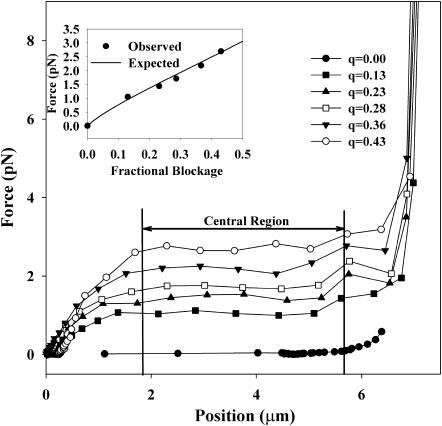
We varied the fraction of the Gaussian profile laser beam that was blocked and measured the lateral force acting on the microsphere as a function of position in the optical potential by measuring the extension of an attached DNA molecule, as previously described. The results are shown in Fig. 7. Forces of up to 2.69 pN are obtained over a scan line of 3.4 μm when 43% of the power of the laser beam is blocked. In the central region, this force is constant to within 26.6 fN/μm. Table 2 shows the forces and residual spring constants obtained by this method for various fractional occlusions of the laser beam.
FIGURE 7.
Optical force as a function of position in the potential generated by asymmetries in the beam profile. Blocking a larger fraction q of the beam leads to an increased asymmetry of the beam and yields a higher optical force acting on the trapped microsphere. The graph shows the force profile obtained for a single tethered bead. The force is relative constant over a central 4-μm-wide region, for which the average force is computed. The inset shows a comparison between the average forces measured and the theoretical prediction for the lateral component of the optical scattering force, Eq. 4.
TABLE 2.
Forces obtained with an asymmetric beam profile in the back focal plane of the scanning-line optical tweezers
| Fractional blockage | Average force (pN) | Spring constant (fN/μm) |
|---|---|---|
| 0 | 0.027 | 7.5 |
| 13.0 | 0.986 ± 0.093 | 12.3 |
| 23.1 | 1.417 ± 0.029 | 20.8 |
| 28.6 | 1.682 ± 0.035 | 23.9 |
| 36.6 | 2.182 | 29.2 |
| 43.0 | 2.697 | 26.6 |
The average force is determined over a 4-μm-wide central region of the potential. The residual spring constant as a measure for the deviation from a perfectly linear potential is obtained from a linear regression in that region.
The expected force for a given blockage of the laser beam can be predicted with the simple geometric model shown in Fig. 1 and a calculation of the resultant scattering forces as discussed by Liesfeld et al. (2003). Adapting the standard expression for the radiation-pressure-induced force from a reflecting surface to our geometry, the lateral force acting on the particle is
 |
(4) |
where P is the time-averaged incident laser power,  the Fresnel reflection coefficient for reflection from a surface at normal incidence, using n1 = 1.59 as the refractive index for the polystyrene microsphere and n2 = 1.33 for the surrounding buffer. Θ Stands for the average angle of incidence of the laser beam that is truncated at x = b in the back focal plane,
 |
(5) |
where σ is the width of the unblocked Gaussian beam in the back focal plane and Φ the maximum acceptance angle of the microscope objective. A comparison between the predictions of Eq. 4 and the experimentally measured forces is shown as the inset in Fig. 7. The experimental data agree well with the predictions. Furthermore, the measured forces exhibited good repeatability as they varied from sample to sample by typically <6%. We attribute the remaining discrepancies to the polydispersity of the microspheres.
The maximum optical force that can be realized in this scheme was limited by the laser power available in our experimental apparatus. Although the laser beam has an intensity of 1.5 W at the back aperture of the microscope objective, the laser power incident on the microsphere and the attached DNA molecule is only a fraction of this because the laser beam is scanned over a 8-μm-long line in the focal plane. Therefore, laser-induced damage to the sample is much lower than the total laser power suggests (Mohanty et al., 2002), and in fact we did not observe any damage to the DNA molecules during our experiments.
It is worth emphasizing that the force-generating mechanism in the asymmetric-beam mode is fundamentally different from the way the forces are generated with the amplitude-modulated potential. Although the amplitude-modulated potential exerts a conservative optical gradient force on the trapped particle, the scattering force in the asymmetric-beam mode is nonconservative. In the latter mode, the trapped microsphere sees always the same electromagnetic field, irrespective of its lateral position along the scan line. This is in contrast to the situation of the ramp potential, where the field is stronger on one end than at the other end of the line. Therefore, the energy barrier that the particle needs to overcome to escape the trapping line is the same, no matter where along the line it is trapped. Work, however, must be done to move the particle within the line trap against the scattering force. Therefore, the integral over the work that is required to move the particle from one end of the line to the other end, extract it orthogonally to the line from the trap, move it force-free outside the trap back to the other end, and drop it back into the line trap is nonzero,
 |
(6) |
This fundamental difference in how the forces are generated results in the ability to scale this scheme to longer scan lines without increasing the risk for light-induced damage to the molecule. The force depends only on the average laser power incident onto the trapped particle. To maintain the same force over a longer distance, only the overall laser power going into the microscope objective increases linearly with scan length, but the average power at each point along the scan line remains the same. To achieve a longer ramp potential with the same force, however, the overall laser power increases quadratically with length, and the local intensity at the end of the scan line increases linearly, which in turn increases the risk of light-induced damage to the biomolecule.
Fast measurements of DNA relaxation
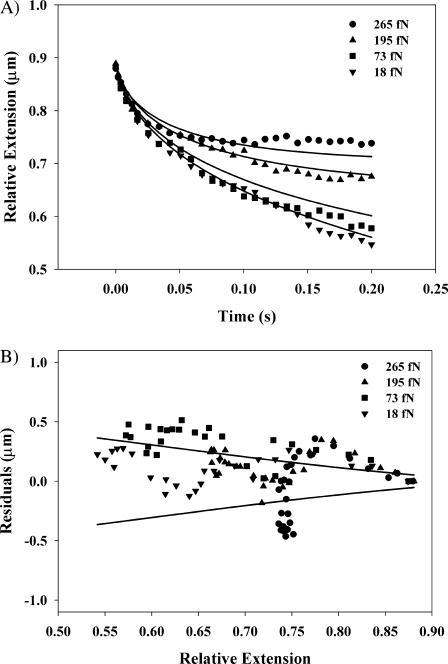
A first application of the scanning-line constant-force optical tweezers is a fast measurement of the relaxation of a single DNA molecule with attached microsphere. The surface-tethered DNA molecule is extended to 88% of its nominal contour length of 16.4 μm. The microsphere at its end is then released into a ramp-like optical potential that was generated with the scanning-line optical tweezers through synchronous amplitude modulation. The entropic restoring force of the DNA molecule is opposed by the constant lateral force of the optical potential, and the DNA molecule will ultimately reach an equilibrium extension at which these forces balance. The relaxation to this new equilibrium is slowed down by the combined hydrodynamic friction on the microsphere and the DNA molecule. We observe the relaxation of the DNA-microsphere construct by measuring the position of the microsphere with a time resolution of 50 μs by analyzing the transmitted laser light intensity as described above. The result of this measurement is shown in Fig. 8 A for relaxations against different applied forces ranging from 18 to 265 fN.
FIGURE 8.
Relaxation of an extended λ-DNA molecule against an external force. (A) Relative extension of the DNA molecule as a function of time against different applied lateral optical forces. Data were taken at a rate of 20 kHz and approximately every hundredth data point is shown for clarity. The solid lines represent the theoretical predictions from the wormlike chain model as modified for our experimental geometry. The optical forces are determined by mapping the optical ramp potential, and then averaged over the portion of the trap through which the microsphere moves while the DNA relaxes. (B) Shows the differences between the theoretical and actual extensions of the DNA molecule, as plotted in A. The solid lines indicate the expected thermal noise that is predicted by the equipartition theorem.
The experimental data are compared to a prediction from the static wormlike chain model (Marko and Siggia, 1995), which yields the entropic force of the DNA molecule for a given extension, as given by Eq. 2. The equation of motion for the microsphere under the influence of the restoring force of the DNA along the scan line, FDNA,x, the external optical force Fopt, and hydrodynamic friction described by a friction coefficient ζ is
 |
(7) |
The optical force acting on the microsphere for a given ramp potential is determined from the static force measurements described above. FDNA,x is obtained using the geometric projections in Eqs. 1 and 3. If we assume that the hydrodynamic friction coefficient for the bead-DNA construct is primarily determined by the microsphere, and use the Stokes drag coefficient  on a sphere in a medium of viscosity η in the vicinity of a surface, as its friction coefficient, the equation of motion for the microsphere, Eq. 7, can be solved numerically without adjustable parameters. The solid curves in Fig. 8 A show these solutions for our experimental parameters. In general, good agreement with the experimental data is obtained.
A look at the relatively small residual differences between the measured and theoretically predicted relaxation curves can be used to estimate the noise in such a single-shot dynamic measurement. If the DNA-microsphere construct is modeled for each extension as an overdamped harmonic oscillator with a spring constant  and a friction coefficient ζ, the thermal fluctuations of the system as given by the equipartition theorem are
 |
(8) |
This estimate for the thermal fluctuations is plotted together with the residual differences between the observed and theoretically predicted relaxation curves under different external forces in Fig. 8 B. The observed fluctuations are generally within the expected range, although a small and yet not understood systematic variation of the residuals as a function of the extension of the construct may be present in the data. This demonstrates that single-shot experiments studying the dynamics of DNA molecules are feasible with noise approaching the thermal limit of the DNA molecule itself.
CONCLUSIONS
In conclusion, we have demonstrated that scanning-line optical tweezers can be used to exert a constant optical force on a trapped particle and attached biomolecule without resorting to electronic feedback mechanisms. Depending on the magnitude of the desired forces, two force-generating schemes can be used. First, the amplitude of the trapping laser beam can be modulated synchronously while it is scanned along a line in the focal plane, yielding a ramp-shaped optical potential. This ramp potential can generate forces of up to 365 fN over 3.8 μm, with a residual spring constant of <5.3 fN/μm. If higher forces are desired, the laser beam can be shaped asymmetrically in the back focal plane of the microscope objective. This gives rise to a lateral component to the scattering force that acts on the trapped particle and stretches the attached DNA molecule with forces of up to 2.69 pN over a distance of 3.4 μm.
This development of an all-optical constant-force laser trap facilitates experiments where a biomolecule needs to be held under constant tension, irrespectively of its extension. We demonstrate this method by measuring the relaxation of a DNA-microsphere construct from an extended state to equilibrium. With a fast position measurement scheme, the extension of the molecule is measured as a function of time with 50-μs time resolution. The observed relaxation is consistent with a theoretical prediction from the wormlike chain model, and the observed fluctuations of the system during relaxation can mostly be attributed to the thermal fluctuations of the DNA-microsphere construct itself.
We anticipate that this technique will be useful for the study of the dynamics of single DNA molecules, self-assembly processes of DNA-protein complexes, and studies of molecular motors that move processively along the DNA molecule. In all these instances the apparent length of the DNA changes with time, and most measurements must be carried out under constant-force conditions such as provided by the constant-force scanning-line tweezers.
Acknowledgments
We thank Ben Liesfeld for his help in the early stages of this experiment.
Support from the National Institutes of Health under grant no. GM 69534, the National Science Foundation through Frontier Center, grant no. PHY 0114336, and the Alfred P. Sloan Foundation is gratefully acknowledged.
References
- Berg-Sørensen, K., L. Oddershede, E. L. Florin, and H. Flyvbjerg. 2003. Unintended filtering in a typical photodiode system for optical tweezers. J. Appl. Phys. 93:3167–3176. [Google Scholar]
- Crocker, J. C., J. A. Matteo, A. D. Dinsmore, and A. G. Yodh. 1998. Entropic attraction and repulsion in binary colloids probed with a line optical tweezer. Phys. Rev. Lett. 82:4352–4355. [Google Scholar]
- Faucheux, L. P., L. S. Bordieu, P. D. Kaplan, and A. J. Libchaber. 1995a. Optical thermal ratchet. Phys. Rev. Lett. 74:1504–1507. [DOI] [PubMed] [Google Scholar]
- Faucheux, L. P., Stolovitzky, G., and A. J. Libchaber. 1995b. Periodic forcing of a Brownian particle. Phys. Rev. E. 51:5239–5250. [DOI] [PubMed] [Google Scholar]
- Finer, J. T., R. M. Simmons, and J. A. Spudich. 1994. Single myosin molecule mechanics: piconewton forces and nanometre steps. Nature (Lond.). 368:113–119. [DOI] [PubMed] [Google Scholar]
- Gittes, F., and C. F. Schmidt. 1998. Thermal noise limitations on micromechanical experiments. Eur. Biophys. J. 27:75–81. [Google Scholar]
- Lang, M. J., C. L. Asbury, J. W. Shaevitz, and S. M. Block. 2002. An automated two-dimensional optical force clamp for single molecule studies. Biophys. J. 83:491–501. [DOI] [PMC free article] [PubMed] [Google Scholar]
- Liesfeld, B., R. Nambiar, and J. C. Meiners. 2003. Particle transport in asymmetric scanning-line optical tweezers. Phys. Rev. E. 68:051907. [DOI] [PubMed] [Google Scholar]
- Marko, J. F., and E. D. Siggia. 1995. Stretching DNA. Macromolecules. 28:8759–8770. [Google Scholar]
- Mohanty, S. K., A. Rapp, S. Monajembashi, P. K. Gupta, and K. O. Greulich. 2002. Comet assay measurements of DNA damage in cells by laser microbeams and trapping beams with wavelengths spanning a range of 308 nm to 1064 nm. Radiat. Res. 157:378–385. [DOI] [PubMed] [Google Scholar]
- Nambiar, R., and J. C. Meiners. 2002. Fast position measurements with scanning-line optical tweezers. Opt. Lett. 27:836–838. [DOI] [PubMed] [Google Scholar]
- Owen, R. J., J. C. Crocker, R. Verma, and A. G. Yodh. 2001. Measurement of long-range steric repulsions between microspheres due to an adsorbed polymer. Phys. Rev. E. 64:011401–011406. [DOI] [PubMed] [Google Scholar]
- Perkins, T. T., R. V. Dalal, P. G. Mitsis, and S. M. Block. 2003. Sequence-dependent pausing of single lambda exonuclease molecules. Science. 301:1914–1918. [DOI] [PMC free article] [PubMed] [Google Scholar]
- Smith, D. E., S. J. Tans, S. B. Smith, S. Grimes, D. L. Anderson, and C. Bustamante. 2001. The bacteriophage Φ29 portal motor can package DNA against a large internal force. Nature (Lond.). 413:748–752. [DOI] [PubMed] [Google Scholar]
- Svoboda, K., C. F. Schmidt, B. J. Schnapp, and S. M. Block. 1993. Direct observation of kinesin stepping by optical trapping interferometry. Nature (Lond.). 365:721–727. [DOI] [PubMed] [Google Scholar]
- Wang, M. D., M. J. Schnitzer, H. Yin, R. Landick, J. Gelles, and S. M. Block. 1998. Force and velocity measured for single molecules of RNA polymerase. Science. 282:902–907. [DOI] [PubMed] [Google Scholar]
- Zimmermann, R. M., and E. C. Cox. 1994. DNA stretching on functionalized gold surfaces. Nucleic Acids Res. 22:492–497. [DOI] [PMC free article] [PubMed] [Google Scholar]


